Most Requested Symbols

The broader European financials space has not yet shown the same technical deterioration as its domestic equity counterpart.
The table has an average reading of -16.61%.
Today's featured stock is Acushnet Holdings Corp (GOLF).
AMZN, ATO, AXP, GME, HCA, JBL, MKSI, SPOT, and SUI
Call: American Express Company (AXP), Put: DocuSign, Inc. (DOCU), Covered Write: Barrick Gold Corporation (GOLD)
NDW Morning Update Video - March 23, 2023
NDW Morning Update Video
Click here to download MP3
From a broad ranking perspective, the last few weeks haven’t offered too much in the way of changes to take inventory of. Within the DALI rankings, International Equities and Cash remain in positions of strength, followed by Domestic Equities and Commodities. Within the Domestic Equities Sector Breakdown, however, there have been a variety of changes that are worth consolidating and mentioning in a single report piece. Over the last month and a half:
These changes can leave the average individual feeling like their head is spinning, watching a tennis match of relative strength between the groups. At times like this more than ever, the prudent investor should remember to use the DALI rankings as a piece in the puzzle in establishing what action is real, and what action is just part of the storm. Today’s report will aim to do just that.

The “Headliners”:
Financials and Energy Deteriorating: While the former comes at the expense of a fundamentally unique circumstance, the action has led the technical picture to deteriorate to unacceptable levels. The Financials-Banks group is the worst-ranked group on the ACGS page, being the only group to score below an average score of 1.0. While oversold, exposure should look to be trimmed on rallies. 2022’s darling Energy has quickly fallen from grace, seeing the Group fall below a 3.0 average score and below the money market. The broad proxy for the group XLE reversed down into O’s against the money market on its 6.5% Relative Strength chart, suggesting growing weakness from the group. Continue to exercise caution.
Technology Advancing: As previous reports have touched on, Technology has adopted a more defensive posture like Consumer Staples, which has already established itself in an overweight position. The tech-heavy Nasdaq 100 (NDX) remains in a positive trend and rallied above resistance intraday Wednesday. Heavyweight Apple AAPL has picked up additional technical attribute points over the last month, giving a sign of growing strength from the Tech Generals. Representative XLK is the highest-ranking fund of the SPDR Sector Suite, clocking in at a strong 4.63 fund score.

The “Too Early to Call”:
Healthcare and Consumer Discretionary Advancing: Advances for the two groups come largely at the expense of the previously mentioned “Headline” deterioration for Financials and Energy. Both groups’ advances seem to simply be a consequence of other circumstances rather than true strength. Both groups earn an equal weight designation at the time of writing.
Communication Services Advancing: Despite moving up from the bottom ranking for the first time in over a year, the group remains in underweight territory. While the move should continue to be monitored going forward for signs of further improvement, the sector remains one to avoid from a broad sector perspective.
Of course, it should be noted that any one area can show a pick-up (or breakdown) of Relative Strength at any point, and overarching notable areas of strength will undoubtedly continue to shift if the market continues its recent run of volatility. As always, continue to keep a watchful eye on the sector breakdown using various areas of the platform to stay up to date as we wrap up what has been an eventful first quarter of the year.

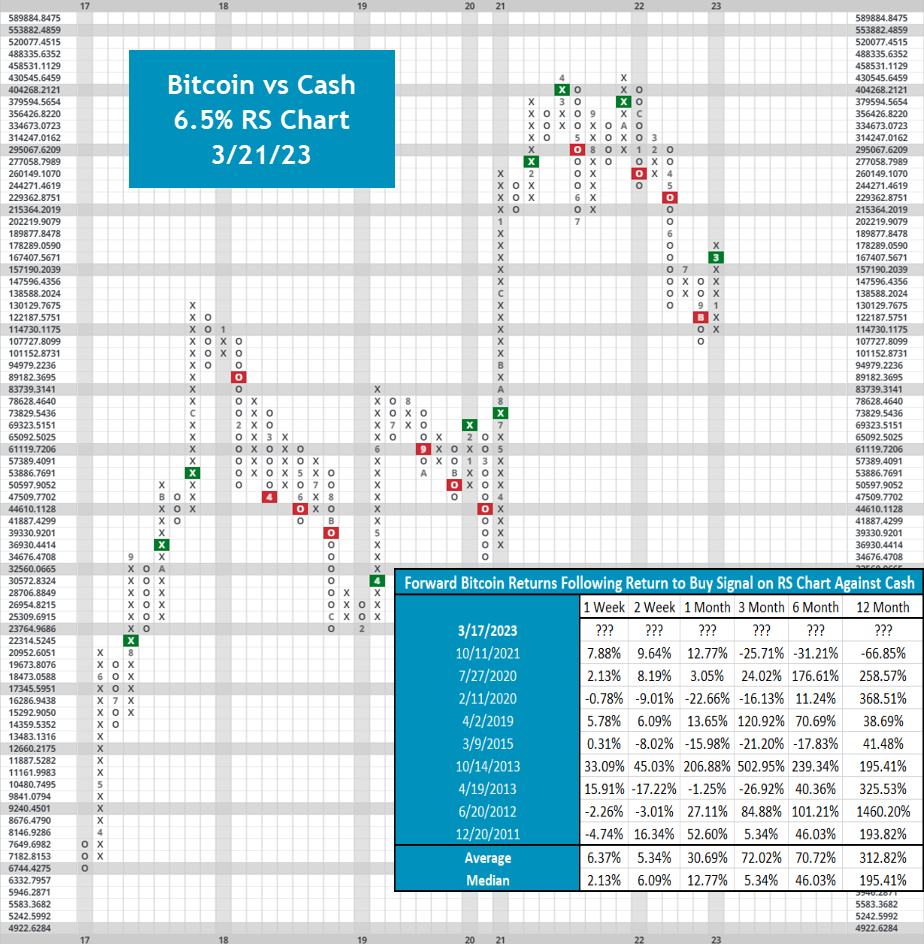
It was yet another productive week for the broad crypto space, seeing the Nasdaq Crypto Index (NCI) advance 9.81%, outpacing the S&P 500 (SPX) by over 7%. This outperformance came off the back of yet another dominant week for crypto heavyweight Bitcoin, which gained just under 15% over the last 17 days. This positive action led to a variety of constructive technical developments on the default 5% Point and Figure chart, seeing the crypto king break back into a positive trend for the first time since early April 2022 and breaking past key resistance dating back to last summer in the process. While the move does bring Bitcoin into what would typically be considered heavily overbought territory for other securities, the nature of this space dictates that elevated weekly OBOS readings are not uncommon. With Bitcoin re-entering a positive trend, consider moving to a more broad exposure strategy within the space as 2023’s stellar performance seems to be having overarching positive effects on the industry.
Another positive sign for Bitcoin comes from its 6.5% Relative Strength (RS) chart against cash. This week, Bitcoin returned to a buy signal against cash for the first time since late 2021. 2022’s poor performance led $BTC to post a series of three consecutive RS sell signals against cash, signaling long-term weakness against the money market. However, historical forward returns following a return to a buy signal against cash are strong, showing a near 90% positive hit rate 12 months out. While average returns are inflated by a stellar few years, median returns still highlight the strength of following this signal. While a few other standout crypto names (namely Litecoin $LTC & Ethereum $ETH) returned to buy signals throughout the last few months, Bitcoin’s RS chart has been closely watched for signs of broad strength. While the recency bias of 2021’s head fake certainly serves as a harsh reminder of the volatility of the space, it certainly seems as if this RS buy signal is a positive sign.
Each week the analysts at DWA review and comment on all major asset classes in the global markets. Shown below is the summary or snapshot of the primary technical indicators we follow for multiple areas. Should there be changes mid-week we will certainly bring these to your attention via the report.
| Universe | BP Col & Level (actual) | BP Rev Level | PT Col & Level (actual) | PT Rev Level | HiLo Col & Level (actual) | HiLo Rev Level | 10 Week Col & Level (actual) | 10 Week Rev Level | 30 Week Col & Level (actual) | 30 Week Rev Level |
|---|---|---|---|---|---|---|---|---|---|---|
| ALL |
|
36% |
|
36% |
|
22% |
|
26% |
|
40% |
| NYSE |
|
40% |
|
44% |
|
24% |
|
24% |
|
34% |
| OTC |
|
36% |
|
34% |
|
20% |
|
28% |
|
38% |
| World |
|
40% |
|
34% |
|
|
|
34% |
|
44% |

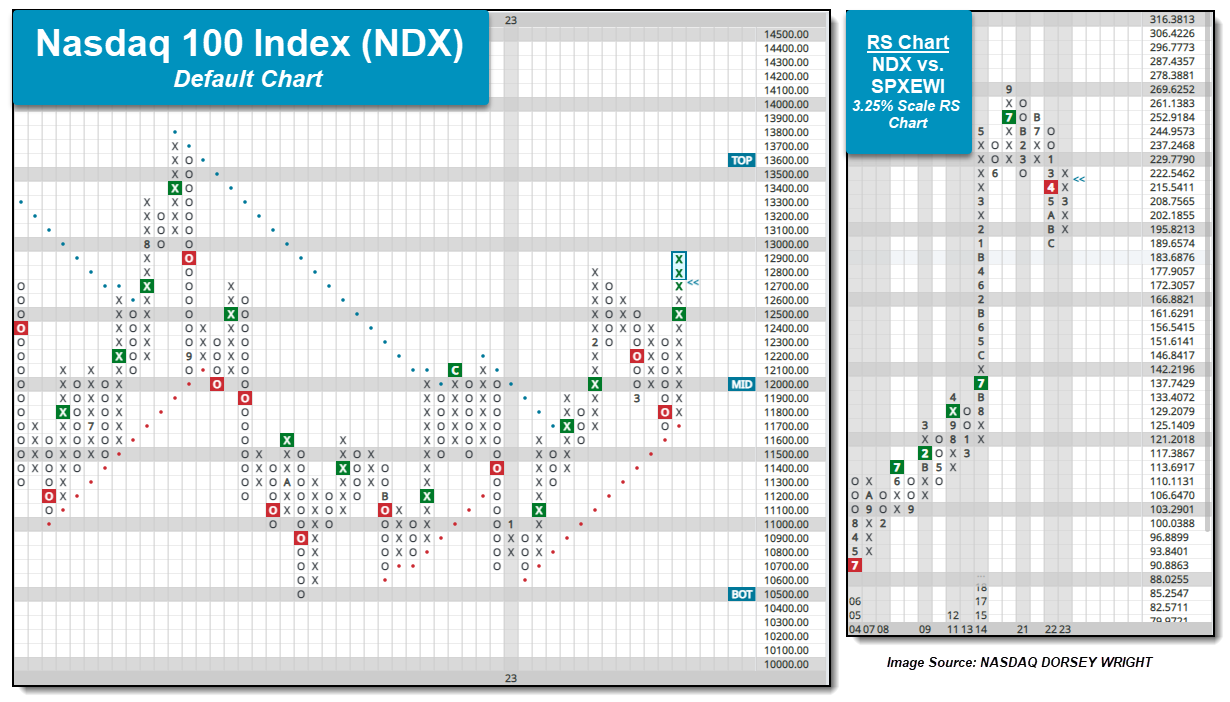
US Equity indices have rallied notably to begin this week with the S&P 500 Index SPX having picked up 2.20% (3/17 to 3/21). While the Russell 2000 Index RUT is the top performer so far this week, the Nasdaq-100 NDX and Nasdaq Composite NASD carried that baton last week, as they were up 5.83% and 4.41% (3/10 to 3/17). NDX and NASD are also the top-performing US Equity indices during the month of March, up 5.81% and 3.53%, and year-to-date, up 16.47% and 13.32%. NDX has not only fared better than NASD from a performance perspective but also on its trend chart. While many US Equity indices moved into a negative trend at the beginning of March - like the Nasdaq Composite and S&P 500 SPX - the Nasdaq-100 was able to maintain its positive trend after testing the bullish support line at 11700. Action toward the end of last week saw NDX complete a bearish signal reversal to return to a buy signal before continuing higher to 12700 during action Tuesday this week. Intraday action on Wednesday brought NDX up to 12900, clearing the February rally high on the chart and bringing the index to levels not seen since August of last year.
Recent action for NDX has not only led to absolute improvement but relative improvement as well. The RS chart below compares NDX to the S&P 500 Equal Weighted Index SPXEWI on a 3.25% scale, and while it remains on an RS sell signal, the chart has been in Xs since last Monday, March 13th. The shift into Xs is the first time since 2022 began that NDX has shown a near-term trend of outperformance versus SPXEWI on this chart. Additionally, the NDX versus our cash proxy RS comparison moved back to a long-term RS buy signal back in early February and the chart has maintained in Xs since that time.
While the trend and RS charts are our main two points of analysis for understanding NDX’s improvement and strength, secondary metrics like weekly momentum are on the verge of moving back positive as well. Typically, weekly momentum remains positive (or negative) for 6 to 8 weeks, and NDX has exhibited negative weekly momentum since the end of February. A flip to positive weekly momentum can be an indicator of higher prices in the near term.
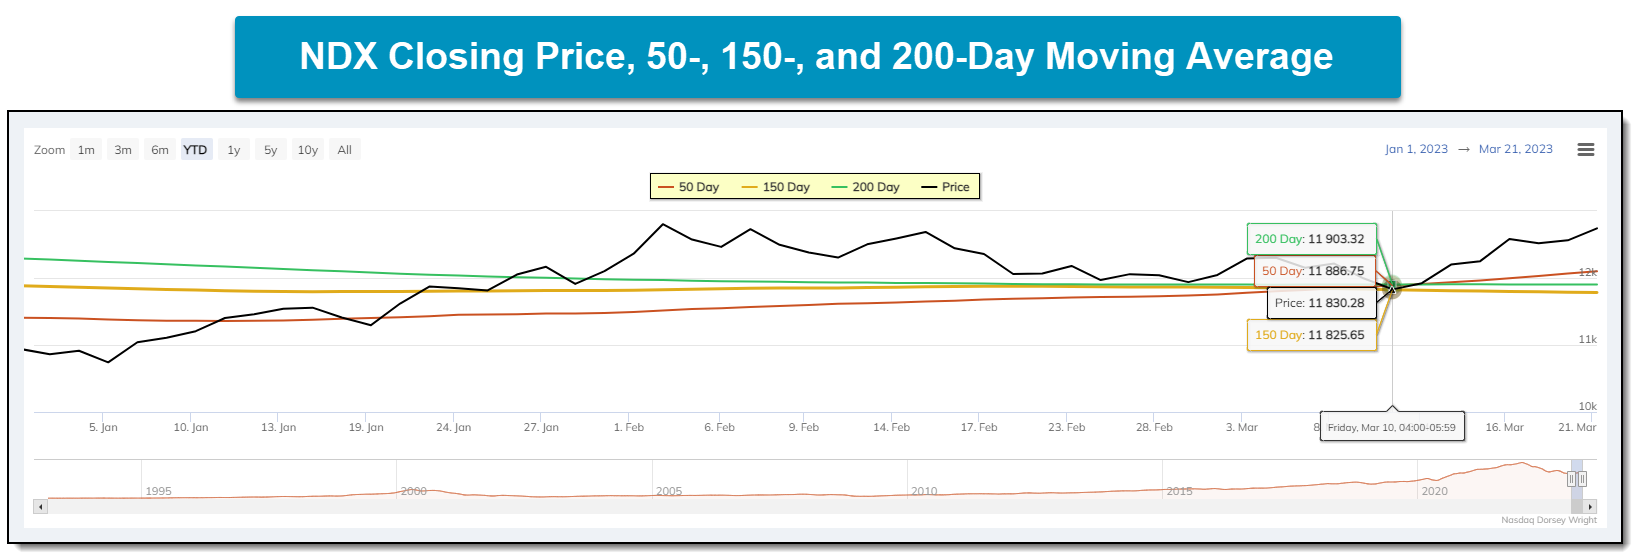
Our last observation comes from the line chart below, which plots NDX’s closing price as well as the 50-, 150-, and 200-day moving averages. Except for Friday, March 10th, NDX’s closing price has maintained above all three moving averages since the latter part of January. The Nasdaq Composite is the only other US Equity index with its current price trading above all three moving averages currently. The S&P 500 on the other hand trades below its 50-day moving average along with the Russell 1000 RUI and Dow .DJIA. The S&P 500 Equal Weighted SPXEWI and Russell 2000 both trade below their 50-, 150-, and 200-day moving averages.
While a couple of US equity indices were able to rally above resistance that dates back to August last year, most of the US Equity indices now trade below their December rally highs – except for NDX and NASD. Additionally, with Wednesday’s intraday action, the Nasdaq Composite will return to a buy signal and flip back into a positive trend, joining NDX as the only other US Equity index trend chart to trade in a positive trend. So, as it stands, NDX and NASD not only carry the near-term leadership baton from a performance standpoint but a relative and trending one as well.
The past week saw no significant technical developments in the Basic Materials, Industrial, Consumer Non-Cyclical, Financials or Utilities Sectors. Those that saw noteworthy movement are included below, in order of their relative strength ranking in the DALI domestic equity sector rankings. Sector designations are based on DALI sector rankings and are as follows: 1 - 3 overweight, 4 - 7 equal-weight, and 8 - 11 underweight.

Technology- Equal Weight, Improving
Technology advanced another spot in the DALI sector rankings to the fourth position, showing further improvement but still leaving it with an Equal Weight recommendation. The sector has gained 31 RS signals since February, the most of any sector during that time. Semiconductors continue to show broad strength. Larger names have seen increased demand amid broader market uncertainty and should be the area of focus for those looking to add exposure to Technology. AAPL and PANW each moved to a buy signal this week, demonstrating strength across the various subsectors.
Consumer Cyclical- Equal Weight
Consumer Discretionary moved up to the 5th position within DALI over the past week, its highest level within the sector rankings since February last year. The Consumer Discretionary Select Sector SPDR Fund XLY gained 3.26% over the past week, outperforming SPX by more than 1%. The fund did test support at $136, but ultimately maintained a buy signal and has reversed back into Xs with this week’s action. Nike NKE reported earnings this week, beating estimates, but still cited inventory as a headwind. Overall, NKE’s technical picture is still one that needs further improvement. Textiles/Apparel DWATEXT along with Restaurants DWAREST were among the better-performing subsectors, adding 3.62% and 2.31%. Sketchers SKX is a strong name within the Textiles subsector, while Starbucks SBUX is a 4 for 5’er within the Restaurants space.
Healthcare- Equal Weight
Healthcare moved up to sixth in the DALI sector rankings this week after passing financials and energy. Both financials and energy were poor performers over the last few weeks, so this upgrade in rank has more to do with other sectors weakening and not so much strength in healthcare. While now in equal weight territory, healthcare should still be approached with caution. The Health Care Select Sector SPDR Fund XLV has a fund score of 3.72 but has a negative score direction of 2.15 which speaks to the quick loss of strength in the sector.
Energy- Underweight, Weakening
Energy lost more than 40 buy signals over the last week, falling from fourth to eighth in the DALI sector rankings and now squarely in underweight territory. The Energy Select Sector SPDR Fund (XLE) was down more than 1.6% over the last week, while the S&P was up just over 2%. XLE completed a fourth consecutive sell signal last week and has taken out all support it has found since September. XLE’s fund score remains acceptable but has diminished significantly and now shows a -2.4 score direction. The recent chart action is consistent with a technical breakdown – a series of lower tops and lower bottoms violating multiple levels of support.
Communication Services- Underweight
Communication Services moved up to 10th within the DALI Sector rankings this week, overtaking Real Estate and moving out of the last position for the first time in over a year. The SPDR Select fund for the group XLC now showcases a 3.08 fund score, having put in place localized support on its default chart. One stock to keep an eye on within the sector is The New York Times Company (NYT), a 4/5’er on a productive pair of consecutive buy signals.
Real Estate- Underweight
Real Estate returned to the bottom of our DALI sector ranks last week. SPDR Sector Fund XLRE now carries an abysmal 0.35 fund score, which is marginally better than the Equal Weight Real Estate ETF (EWRE) from Invesco with a score of 0.27. Heavyweights and past leaders in the sector, PLD and SPG, broke key support and have seen deterioration in their attribute rating. Two promising charts are VICI and GLPI.

Financials have been the talk of the town across financial markets over the past week. The stress of banking failures in the U.S. carried over into international equity markets, leading to the collapse and subsequent acquisition of Credit Suisse, a prominent global financial institution that had been in business since 1856. This broader weakness from financials led the sector to drop rapidly across most of our relative comparisons for US equities. However, we have not seen the same relative weakness from broader European financial representatives, at least not yet.
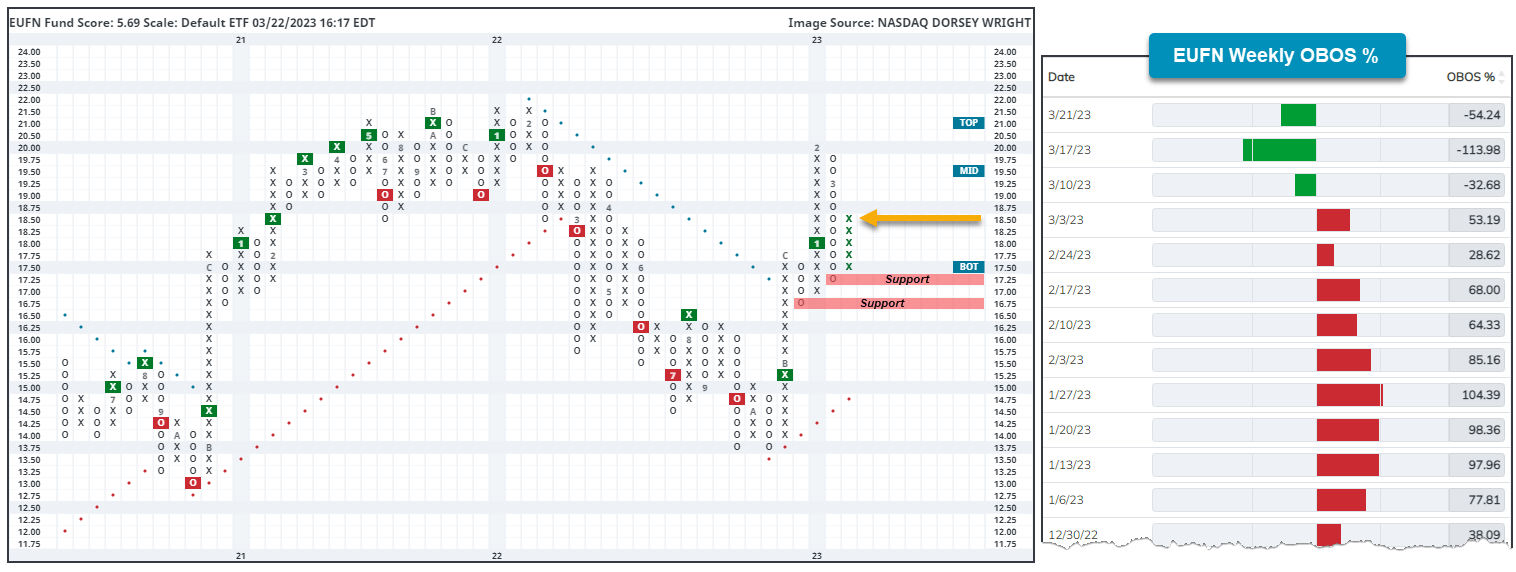
This can be seen through the iShares MSCI Europe Financial ETF EUFN, which we highlighted earlier this month for its rapid price ascension. The enhanced volatility seen in financials over the past few weeks did lead EUFN to retract from its rally high at $20 to ultimately notch a low at $17.25, marking a decline of just over 13% in about a week. It is also worth noting that EUFN was sitting on a significant stem in a heavily overbought position prior to this move, potentially amplifying the magnitude of the decline. The low at $17.25 caused the weekly overbought/oversold reading to flip to a -113% oversold reading through the movement on Friday (3/17), leaving the fund in a heavily washed-out position. This week led to two consecutive days of sharp improvement for EUFN on Monday and Tuesday, leaving the fund at the current chart position of $18.50. It is worth noting that Wednesday has seen the fund retract slightly, though not enough to change the default chart with a loss of just 0.89%. That also marks the first trading day out of the past ten trading days that EUFN has not moved at least 1.5% in any direction.
Even with the increased volatility March has brought for EUFN, the underlying technical picture for the fund remains favorable with a strong 5.69 fund score paired with an intensely positive score direction of 5.44. Taking a step back and simply viewing the point-and-figure movement also presents a positive picture; we see a security that is trading on two consecutive buy signals, pulled back from an overbought territory after an extended rally, marked a higher low and reversed back up toward the mid-point on its trading band. Most broad financial representatives on the US equity side cannot say the same, as they have generally shown further technical deterioration. While we may not want to view the European financial space in the same light that was used a few weeks ago, it is important to understand the differences in the movement between domestic and international equity markets.
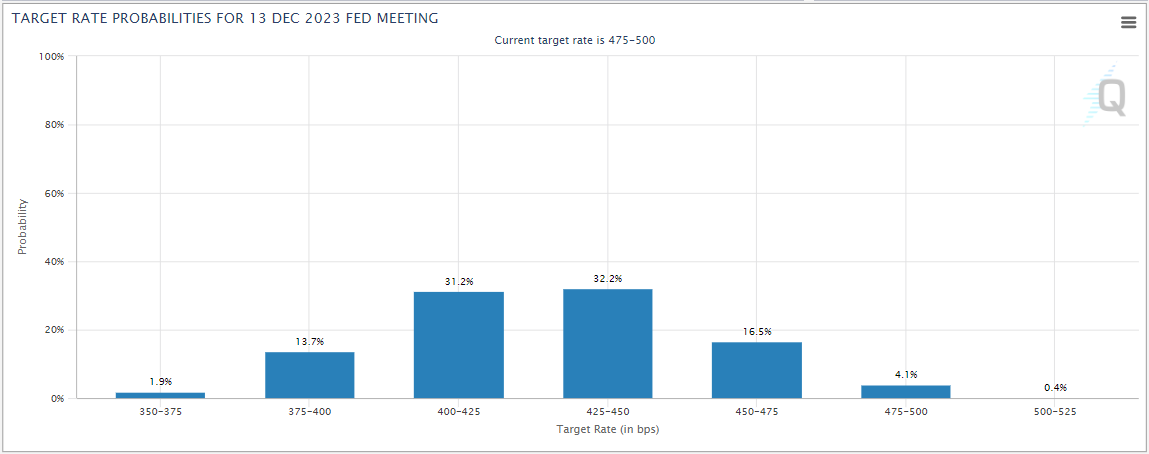
The FOMC wrapped up its March meeting on Wednesday and raised the fed funds target rate by 25 basis points to 475 – 500 bps as had been expected. The FOMC’s summary of economic projections show that members’ median expectation for the fed funds rate in 2023 is 4.3%, up from 4.1% in the December projections. Despite this, and Fed Chair Powell stating that the committee did foresee rate cuts this year, the fed futures market is now pricing in a better than 90% chance of at least one rate cut by the end of the year.
US Treasury yields fell following the meeting with the 10-year US Treasury yield (TNX) closing at 3.5% after trading near 3.65% early in the day. The two-year US Treasury yield closed at around 3.95% after trading above 4.2% earlier in the day. US equities also declined following Powell’s press conference and after Treasury Secretary Yellen told a Senate Panel that officials are not considering expanding FDIC coverage to all deposits. The S&P 500 finished the day down 1.65% after being up in earlier trading.
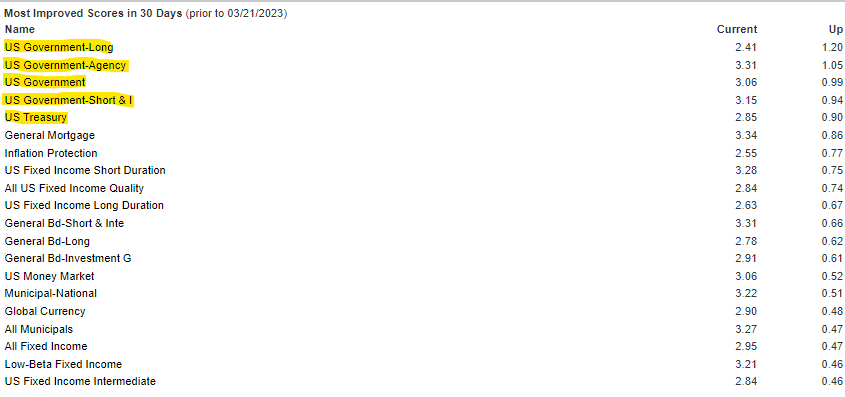
The inverse fixed income group fell in the Asset Class Group Scores (ACGS) rankings since last week, when it ranked second. The average score of the US Government group has improved markedly in recent weeks, going from below 2.0 at the beginning of March to its current reading of 3.06, this is the first time the group has been above the 3.0 score threshold since November 2020. Other rate sensitive groups like US Treasuries, have also climbed out of the red zone as the recent decline in yields has been a tailwind for core bonds. US government groups account for the top five most improved fixed groups over the last month, while equity related groups have seen the largest score declines. Preferreds and convertibles – now sit at the bottom of the rankings, with preferreds now the only fixed income group with an average score below 2.0.

Remember, these are technical comments only. Just as you must be aware of fundamental data for the stocks we recommend based on technical criteria in the report, so too must you be aware of important data regarding delivery, market moving government releases, and other factors that may influence commodity pricing. We try to limit our technical comments to the most actively traded contracts in advance of delivery, but some contracts trade actively right up to delivery while others taper off well in advance. Be sure you check your dates before trading these contracts. For questions regarding this section or additional coverage of commodities email will.gibson@nasdaq.com.
Data represented in the table below is through 3/21/2023:
Broad Market Commodities Report
| Symbol | Name | Price | PnF Trend | RS Signal | RS Col. | 200 Day MA | Weekly Mom |
|---|---|---|---|---|---|---|---|
| CL/ | Crude Oil Continuous | 69.67 | Negative | Buy | O | 87.00 | -2W |
| DBLCIX | Deutsche Bank Liquid Commodities Index | 478.45 | Negative | Sell | O | 533.21 | -2W |
| DWACOMMOD | DWA Continuous Commodity Index | 761.83 | Positive | Buy | O | 808.63 | -2W |
| GC/ | Gold Continuous | 1941.10 | Positive | Sell | X | 1779.37 | +2W |
| HG/ | Copper Continuous | 4.00 | Negative | Sell | X | 3.77 | -7W |
| ZG/ | Corn (Electronic Day Session) Continuous | 630.00 | Negative | Buy | O | 666.63 | -5W |
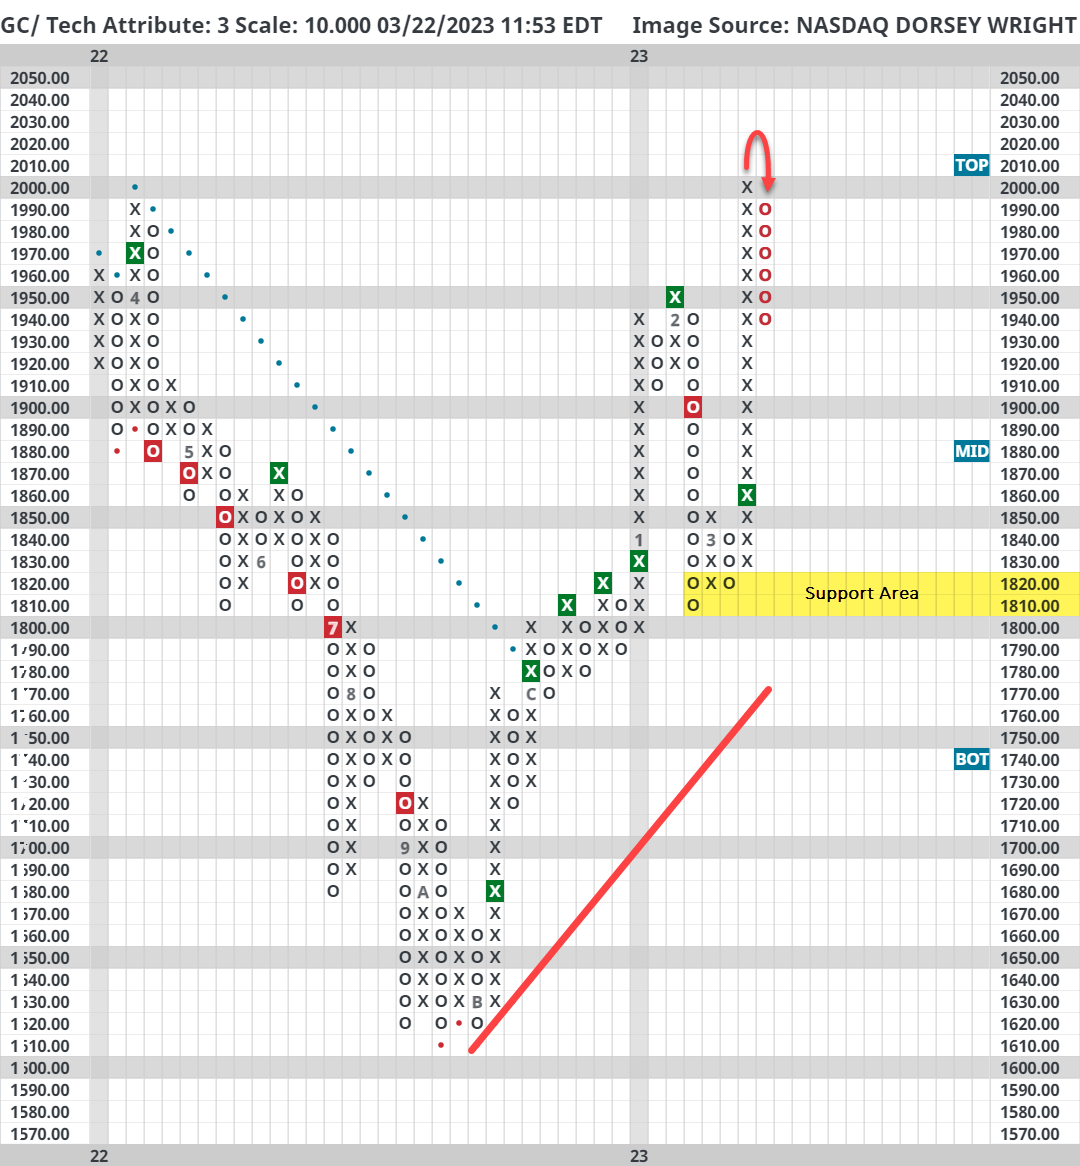
Gold (GC/) is up nearly 7% so far this year (through 3/21); however, roughly 6% of that return has come in the month of March alone due to a perceived flight to safety. As seen on the default chart of GC/ below, gold began the year on strong footing with a string of consecutive buy signals and a positive trend breakout in December. In February, the precious metal quickly pulled back to the $1800 level before catching a big tailwind in early March amidst the regional banking crisis. Following yesterday’s action, GC/ pulled back to its February highs at around $1950 after eclipsing $2000 earlier this week.
Note that support for gold is distant from current levels, not offered until around $1810 - $1820. Also, gold has been quick to react this year to headline risk-on/risk-off sentiment, so those looking to add long exposure may consider waiting for a higher bottom to be established.
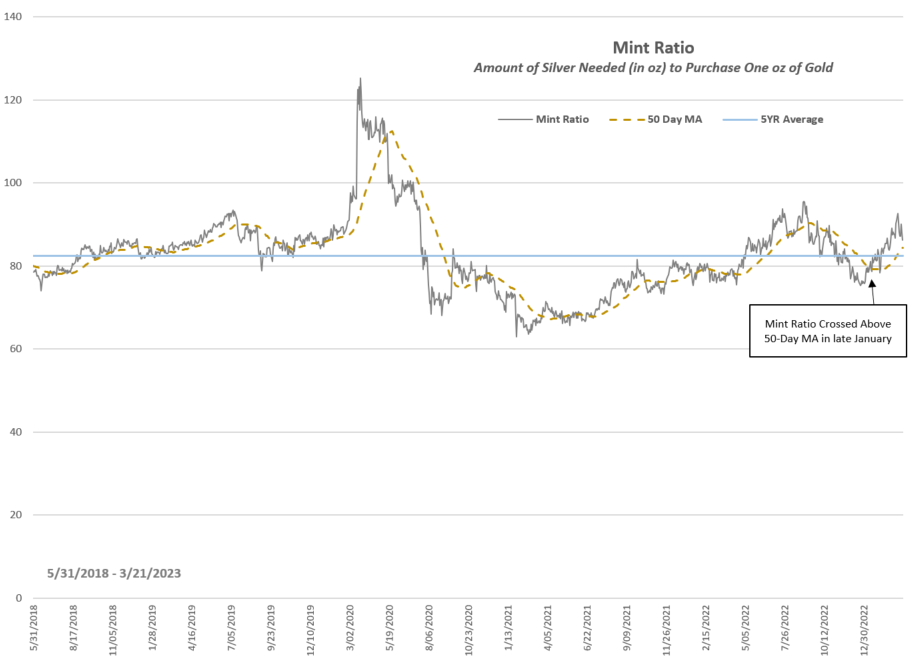
When discussing price movements for gold as potential risk-on/risk-off signals, it can be helpful to compare its behavior to silver (SI/) via the Mint Ratio. The Mint Ratio simply measures the amount of silver needed (in oz) to purchase a single ounce of gold. In most periods this relationship is inversely correlated to risk appetite, rising in market downturns as investors flock to the traditional safety of gold over silver which tends to have more economic uses.
The line chart below is a five-year history of this relationship. Interestingly, the Mint Ratio crossed above its 50-day moving average back in late January of this year, which in hindsight would have been a good risk-off signal. There are other noteworthy periods, like 2020, but also plenty of uneventful crosses. A longer-term chart (since 1976) is available upon request to the email address at the top of this Alternative Assets Update.
Going forward, investors should watch the Mint Ratio for past tops and bottoms, like September 2022 and early January 2023, respectively, for sentiment guidance. Additionally, investors should keep an eye on the ratio's 50-day moving average which is quickly approaching due to the recent pullback in gold - a break below could be interpreted as bullish for risk assets.
Average Level
-16.61
| < - -100 | -100 - -80 | -80 - -60 | -60 - -40 | -40 - -20 | -20 - 0 | 0 - 20 | 20 - 40 | 40 - 60 | 60 - 80 | 80 - 100 | 100 - > |
|---|---|---|---|---|---|---|---|---|---|---|---|
|
Sell signalicf
|
|||||||||||
|
Sell signalgsg
|
|||||||||||
|
Sell signaluso
|
|||||||||||
|
Sell signalRSP
|
|||||||||||
|
Sell signalgcc
|
Buy signaldia
|
Sell signaldx/y
|
|||||||||
|
Sell signalijr
|
Buy signalhyg
|
Buy signalspy
|
Sell signalTLT
|
Buy signaloneq
|
Buy signalqqq
|
||||||
|
Sell signaldvy
|
Sell signaliwm
|
Buy signalVOOV
|
Buy signallqd
|
Buy signalief
|
Buy signalvoog
|
Buy signalGLD
|
|||||
|
Sell signaleem
|
Buy signalijh
|
Buy signalefa
|
Buy signalagg
|
Buy signalfxe
|
Buy signalxlg
|
Buy signalshy
|
|||||
| < - -100 | -100 - -80 | -80 - -60 | -60 - -40 | -40 - -20 | -20 - 0 | 0 - 20 | 20 - 40 | 40 - 60 | 60 - 80 | 80 - 100 | 100 - > |
| AGG | iShares US Core Bond ETF |
| USO | United States Oil Fund |
| DIA | SPDR Dow Jones Industrial Average ETF |
| DVY | iShares Dow Jones Select Dividend Index ETF |
| DX/Y | NYCE U.S.Dollar Index Spot |
| EFA | iShares MSCI EAFE ETF |
| FXE | Invesco CurrencyShares Euro Trust |
| GLD | SPDR Gold Trust |
| GSG | iShares S&P GSCI Commodity-Indexed Trust |
| HYG | iShares iBoxx $ High Yield Corporate Bond ETF |
| ICF | iShares Cohen & Steers Realty ETF |
| IEF | iShares Barclays 7-10 Yr. Tres. Bond ETF |
| LQD | iShares iBoxx $ Investment Grade Corp. Bond ETF |
| IJH | iShares S&P 400 MidCap Index Fund |
| ONEQ | Fidelity Nasdaq Composite Index Track |
| QQQ | Invesco QQQ Trust |
| RSP | Invesco S&P 500 Equal Weight ETF |
| IWM | iShares Russell 2000 Index ETF |
| SHY | iShares Barclays 1-3 Year Tres. Bond ETF |
| IJR | iShares S&P 600 SmallCap Index Fund |
| SPY | SPDR S&P 500 Index ETF Trust |
| TLT | iShares Barclays 20+ Year Treasury Bond ETF |
| GCC | WisdomTree Continuous Commodity Index Fund |
| VOOG | Vanguard S&P 500 Growth ETF |
| VOOV | Vanguard S&P 500 Value ETF |
| EEM | iShares MSCI Emerging Markets ETF |
| XLG | Invesco S&P 500 Top 50 ETF |
| Symbol | Company | Sector | Current Price | Action Price | Target | Stop | Notes |
|---|---|---|---|---|---|---|---|
| GPK | Graphic Packaging Intl. | Forest Prods/Paper | $23.94 | 21 - 23 | 26 | 18 | 5 for 5'er, #2 of 15 in favored FORE sector matrix, LT pos mkt RS, triple top, 1.3% yield |
| AES | The AES Corporation | Utilities/Electricity | $22.97 | lo-mid 20s | 43.50 | 18.50 | 5 TA rating, top quintile EUTI sector, buy-on-pullback, 2.52% yield, R-R > 4.5 |
| PGR | The Progressive Corporation | Insurance | $140.23 | low 120s - low 130s | 168 | 106 | 4 for 5'er, top quartile of favored INSU sector matrix, one box from mkt RS buy, spread triple top |
| COHU | Cohu, Inc. | Semiconductors | $37.63 | mid 30s | 51 | 29 | 4 for 5'er. top 10% of SEMI sector matrix, big base breakout, R-R>2.5 |
| TSCO | Tractor Supply Company | Retailing | $235.67 | mid 210s - high 230s | 298 | 186 | 5 TA rating, LT market RS buy, recent peer RS buy, top half RETA sector matrix |
| MSI | Motorola Solutions Inc. | Telephone | $271.66 | hi 240s - lo 270s | 316 | 212 | 5 TA rating, top decile of TELE sector matrix, consec. buy signals, LT mkt RS buy, |
| V | Visa Inc. | Finance | $221.95 | 210s - 220s | 262 | 188 | 5 for 5'er top third of FIN sector matrix, LT pos mkt RS, spread quintuple top |
| AVGO | Broadcom Ltd | Semiconductors | $636.75 | mid 560s - lo 620s | 696 | 496 | 5 TA rating, top half SEMI sector matrix, fifth consec. buy signal, bullish triangle, LT mkt RS buy |
| ITW | Illinois Tool Works Inc. | Machinery and Tools | $235.16 | 220s - 240s | - | 194 | 3 for 5'er, favored MACH sector, LT pos mkt RS, multiple consec buy signals, pullback from ATH, 2.2% yield |
| MRK | Merck & Co., Inc. | Drugs | $105.54 | mid 100s - low 110s | 137 | 89 | 4 for 5'er top third of DRUG sector matrix, multiple consec buys, pullback from ATH, 2.7% yield |
| YUMC | Yum China Holdings Inc | Restaurants | $61.17 | hi 50s - mid 60s | 86 | 50 | 4 TA rating, top quintile of favored Restaurants sector RS matrix, consec. buy signals, R-R > 2.5 |
| BJRI | BJ's Restaurants Inc. | Restaurants | $29.52 | low 30s | 55 | 26 | 4 for 5'er, top third of favored REST sector matrix, triple top, pullback from 52-week high, R-R>3.5 |
| ADI | Analog Devices, Inc. | Semiconductors | $188.40 | lo 180s - lo 190s | 266 | 158 | 4 TA rating, top third SEMI sector RS matrix, LT RS buy, R-R near 3 |
| FISV | Fiserv, Inc. | Computers | $113.04 | mid 100s - mid 110s | 123 | 91 | 5 for 5'er, top 25% of COMP sector matrix, LT pos mkt RS, pullback from 52-week high |
| TXRH | Texas Roadhouse, Inc. | Restaurants | $106.40 | 100s | 125 | 90 | 5 TA rating, top half REST sector matrix, consec. buy signals, LT RS buy, 2.10% yield. |
| LW | Lamb Weston Holdings Inc | Food Beverages/Soap | $99.65 | mid-90s - low 100s | 113 | 86 | 5 for 5'er, 4 of 75 in FOOD sector matrix, quad top breakout, pullback from ATH, 1.1% yield, Earn. 4/6 |
| ASO | Academy Sports and Outdoors, Inc. | Retailing | $64.67 | lo-upper 60s | 86 | 52 | 5 TA rating, top decile RETA sector matrix, buy-on-pullback |
| GOLF | Acushnet Holdings Corp | Leisure | $50.24 | hi 40s - low 50s | 73 | 42 | 5 for 5'er, top third of LEIS sector matrix, quintuple top breakout, pullback from MY high, R-R~3.0, 1.56% yield |
| Symbol | Company | Sector | Current Price | Action Price | Target | Stop | Notes |
|---|---|---|---|---|---|---|---|
| LAUR | Laureate Education Inc | Business Products | $11.45 | (11.50-12.50) | 6 | 13.50 | 0 for 5'er, LT negative trend & market RS, spread triple bottom, OBOS>100%, R-R>3.0 |
| Comment | |||||||
|---|---|---|---|---|---|---|---|
|
|
|||||||
GOLF Acushnet Holdings Corp R ($49.71) - Leisure - GOLF is a 5 for 5'er that ranks 17th of 51 names in the leisure sector matrix. After undergoing a period of consolidations between October and January, GOLF broke out last month when it broke a quintuple top at $49 and reached a new multi-year high before pulling back to prior resistance. Long exposure may be added in the upper $40s to low $50s and we will set our initial stop at $42, a potential spread quadruple bottom break on GOLF's default chart. We will use the bullish price objective, $73, as our target price, giving us a reward-to-risk ratio of approximately 3.0. GOLF also carries a 1.56% yield.
| 21 | 22 | 23 | |||||||||||||||||||||||||||||||||||||||||||||||||||
| 57.00 | X | • | • | Top | 57.00 | ||||||||||||||||||||||||||||||||||||||||||||||||
| 56.00 | X | X | O | X | • | 56.00 | |||||||||||||||||||||||||||||||||||||||||||||||
| 55.00 | X | O | X | O | X | O | • | 55.00 | |||||||||||||||||||||||||||||||||||||||||||||
| 54.00 | 6 | X | O | X | O | X | O | • | • | X | 54.00 | ||||||||||||||||||||||||||||||||||||||||||
| 53.00 | X | X | O | X | O | X | C | O | X | • | X | • | X | O | 53.00 | ||||||||||||||||||||||||||||||||||||||
| 52.00 | X | O | X | O | 8 | O | X | B | O | X | O | X | • | X | O | • | 3 | O | 52.00 | ||||||||||||||||||||||||||||||||||
| 51.00 | X | O | X | O | 7 | O | X | O | X | O | X | O | X | O | • | X | X | O | X | • | X | O | 51.00 | ||||||||||||||||||||||||||||||
| 50.00 | X | O | O | X | O | X | O | A | X | O | 1 | X | O | • | X | O | X | O | X | O | • | X | O | 50.00 | |||||||||||||||||||||||||||||
| 49.00 | X | O | X | 9 | O | X | O | X | O | • | O | • | 8 | O | X | O | X | O | • | • | • | • | X | O | Mid | 49.00 | |||||||||||||||||||||||||||
| 48.00 | X | O | X | O | X | O | X | • | O | • | X | O | O | X | O | X | X | • | X | • | X | • | 2 | 48.00 | |||||||||||||||||||||||||||||
| 47.00 | X | X | O | O | O | • | O | 2 | • | X | 9 | O | B | O | X | O | C | O | X | O | X | 47.00 | |||||||||||||||||||||||||||||||
| 46.00 | X | O | X | • | O | X | O | X | • | X | O | X | O | X | O | X | O | 1 | O | X | • | 46.00 | |||||||||||||||||||||||||||||||
| 45.00 | X | O | 5 | • | O | X | O | 3 | O | • | X | O | X | O | X | O | X | O | X | O | • | 45.00 | |||||||||||||||||||||||||||||||
| 44.00 | X | O | X | • | O | O | X | O | X | X | • | • | X | X | O | X | O | X | O | O | X | • | 44.00 | ||||||||||||||||||||||||||||||
| 43.00 | 2 | O | X | 4 | • | O | X | O | X | O | 5 | O | X | • | X | O | 7 | • | A | O | O | • | 43.00 | ||||||||||||||||||||||||||||||
| 42.00 | X | 3 | X | O | X | • | O | X | O | X | O | X | O | X | O | 6 | O | X | • | • | 42.00 | ||||||||||||||||||||||||||||||||
| 41.00 | X | O | X | O | X | • | O | O | X | O | X | O | X | O | X | O | X | • | 41.00 | ||||||||||||||||||||||||||||||||||
| 40.00 | X | O | X | O | • | 4 | O | O | O | X | O | X | • | Bot | 40.00 | ||||||||||||||||||||||||||||||||||||||
| 39.00 | O | C | O | • | O | X | O | • | 39.00 | ||||||||||||||||||||||||||||||||||||||||||||
| 38.00 | O | X | • | O | • | • | 38.00 | ||||||||||||||||||||||||||||||||||||||||||||||
| 37.00 | O | X | • | • | 37.00 | ||||||||||||||||||||||||||||||||||||||||||||||||
| 36.00 | O | • | 36.00 | ||||||||||||||||||||||||||||||||||||||||||||||||||
| 21 | 22 | 23 |
| AMZN Amazon.com Inc. ($98.68) - Internet - AMZN reversed back into Xs and rallied to break a spread triple top at $102. The move also shifts the trend back to positive for AMZN, which will bring the stock up to a 2 for 5'er. Resistance lies at $116, the February rally high. Support lies at $96 and the bullish support line at $91. |
| ATO Atmos Energy Corp ($107.35) - Gas Utilities - ATO reversed into Os and broke a triple bottom at $108 for a second sell signal since September of last year. The stock remains a 3 for 5'er and does rank in the top half of the Gsa Utilities sector matrix. Keep an eye on the bullish support line, which lies at $104. A move to $102 would flip the trend to negative and drop the stock to a 2 for 5'er. Support also lies at $98, the October low. |
| AXP American Express Company ($165.53) - Finance - AXP shares moved higher today to break a double top at $166 to mark its first buy signal. This 4 for 5'er has been in a positive trend since November and on an RS buy signal versus the market since February 2022. AXP is trading near the middle of its trading band with a weekly overbought/oversold reading of -17%. From here, support is offered at $156. |
| GME GameStop Corporation ($24.57) - Retailing - GME broke a double top at $20 to complete a bearish signal reversal before rallying up to $27. This move brings the stock to chart levels not seen since December 2022 and will shift the trend back to positive. The rally will also bring the market and peer RS charts back into Xs and flip back to RS buy signals, which will bring GME up to a 5 for 5'er in attribute rating. Resistance for GME now lies at $28 and $34. Support on the default chart lies in the $16 to $15.50 range. Those seeking exposure to the stock may look for normalization at current prices before adding. |
| HCA HCA Healthcare Inc. ($259.42) - Healthcare - HCA shares moved higher today to break a double top at $260 to mark its first buy signal. This 5 for 5'er has been in a positive trend since October and on an RS buy signal versus the market since June 2012. HCA shares are trading in actionable territory with a weekly overbought/oversold reading of 11%. From here, support is offered at $244. |
| JBL Jabil Circuit, Inc. ($82.33) - Electronics - JBL moved higher intraday Wednesday to break a double top at $84. This 5 for 5'er moved to a positive trend in January and has maintained an RS buy signal against the market since 2019. The weight of the technical evidence is favorable and shows near-term improvement. Initial support is not seen until $75, with the potential for further resistance at $85. |
| MKSI MKS Instrument, Inc. ($83.80) - Electronics - MKSI fell Wednesday to break a double bottom at $84, marking its fourth consecutive sell signal this month. This 2 for 5'er moved to a negative trend two weeks ago and sits in the bottom half of the electronics sector RS matrix. Long exposure should be avoided. Further support may be seen at $81. The potential for overhead resistance may be found at $91. |
| SPOT Spotify Technology S.A. ($131.58) - Media - SPOT broke a double top at $132 for a sixth consecutive buy signal. The stock is a 5 for 5'er that ranks 1st (out of 39) in the Media sector matrix. SPOT has maintained a positive trend since January, a peer RS buy signal since February, and a market RS buy signal since earlier this month. From here, resistance lies at $138 and $148. Support lies at $120 and $116. |
| SUI Sun Communities Inc ($129.45) - Real Estate - SUI shares broke a double bottom at $132 on Wednesday, resulting in a second consecutive sell signal. Note that the 2 for 5'er also now sits in the bottom half of the real estate stock sector matrix. No new exposure here. Those long may consider selling into rallies. The next level of support is offered at around $126. |
| Name | Option Symbol | Action | Stop Loss |
|---|---|---|---|
| American Express Company - $164.45 | AXP2316F165 | Buy the June 165.00 calls at 9.55 | 154.00 |
| Name | Option | Action |
|---|---|---|
| HCA Healthcare Inc. ( HCA) | Jun. 255.00 Calls | Stopped at 17.40 (CP: 16.70) |
| AbbVie Inc. ( ABBV) | Jun. 145.00 Calls | Stopped at 12.80 (CP: 12.30) |
| Name | Option Symbol | Action | Stop Loss |
|---|---|---|---|
| DocuSign, Inc. - $57.64 | DOCU2316R57.5 | Buy the June 57.50 puts at 7.05 | 67.00 |
| Name | Option | Action |
|---|---|---|
| CoStar Group Inc. (CSGP) | Jun. 75.00 Puts | Raise the option stop loss to 7.30 (CP: 9.30) |
| Micron Technology, Inc. (MU) | Jun. 57.50 Puts | Stopped at 60.00 (CP: 59.41) |
| Name | Option Sym. | Call to Sell | Call Price | Investment for 500 Shares | Annual Called Rtn. | Annual Static Rtn. | Downside Protection |
|---|---|---|---|---|---|---|---|
| Barrick Gold Corporation $17.69 | GOLD2315I19 | Sep. 19.00 | 1.47 | $8,433.05 | 23.87% | 15.58% | 7.02% |
| Name | Action |
|---|---|
| Tapestry Inc. (TPR) - 41.45 | Sell the August 45.00 Calls. |
| Valero Energy Corp (VLO) - 132.19 | Sell the June 135.00 Calls. |
| Fortinet Inc. (FTNT) - 62.46 | Sell the June 65.00 Calls. |
| Meta Platform Inc. (META) - 202.16 | Sell the June 220.00 Calls. |
| MGM Resorts International (MGM) - 42.68 | Sell the June 43.00 Calls. |
| Dexcom Inc. (DXCM) - 118.98 | Sell the September 125.00 Calls. |
| Name | Covered Write |
|---|---|
| Wynn Resorts, Limited ( WYNN - 108.19 ) | June 115.00 covered write. |
Daily Equity & Market Analysis
Loading, Please Wait...
