Gold pulled back this week after a sharp rally. Today, we review these movements with added perspective from the Mint Ratio.
Remember, these are technical comments only. Just as you must be aware of fundamental data for the stocks we recommend based on technical criteria in the report, so too must you be aware of important data regarding delivery, market moving government releases, and other factors that may influence commodity pricing. We try to limit our technical comments to the most actively traded contracts in advance of delivery, but some contracts trade actively right up to delivery while others taper off well in advance. Be sure you check your dates before trading these contracts. For questions regarding this section or additional coverage of commodities email will.gibson@nasdaq.com.
Data represented in the table below is through 3/21/2023:
Broad Market Commodities Report
Portfolio View - Commodity Indices
| Symbol | Name | Price | PnF Trend | RS Signal | RS Col. | 200 Day MA | Weekly Mom |
|---|---|---|---|---|---|---|---|
| CL/ | Crude Oil Continuous | 69.67 | Negative | Buy | O | 87.00 | -2W |
| DBLCIX | Deutsche Bank Liquid Commodities Index | 478.45 | Negative | Sell | O | 533.21 | -2W |
| DWACOMMOD | DWA Continuous Commodity Index | 761.83 | Positive | Buy | O | 808.63 | -2W |
| GC/ | Gold Continuous | 1941.10 | Positive | Sell | X | 1779.37 | +2W |
| HG/ | Copper Continuous | 4.00 | Negative | Sell | X | 3.77 | -7W |
| ZG/ | Corn (Electronic Day Session) Continuous | 630.00 | Negative | Buy | O | 666.63 | -5W |
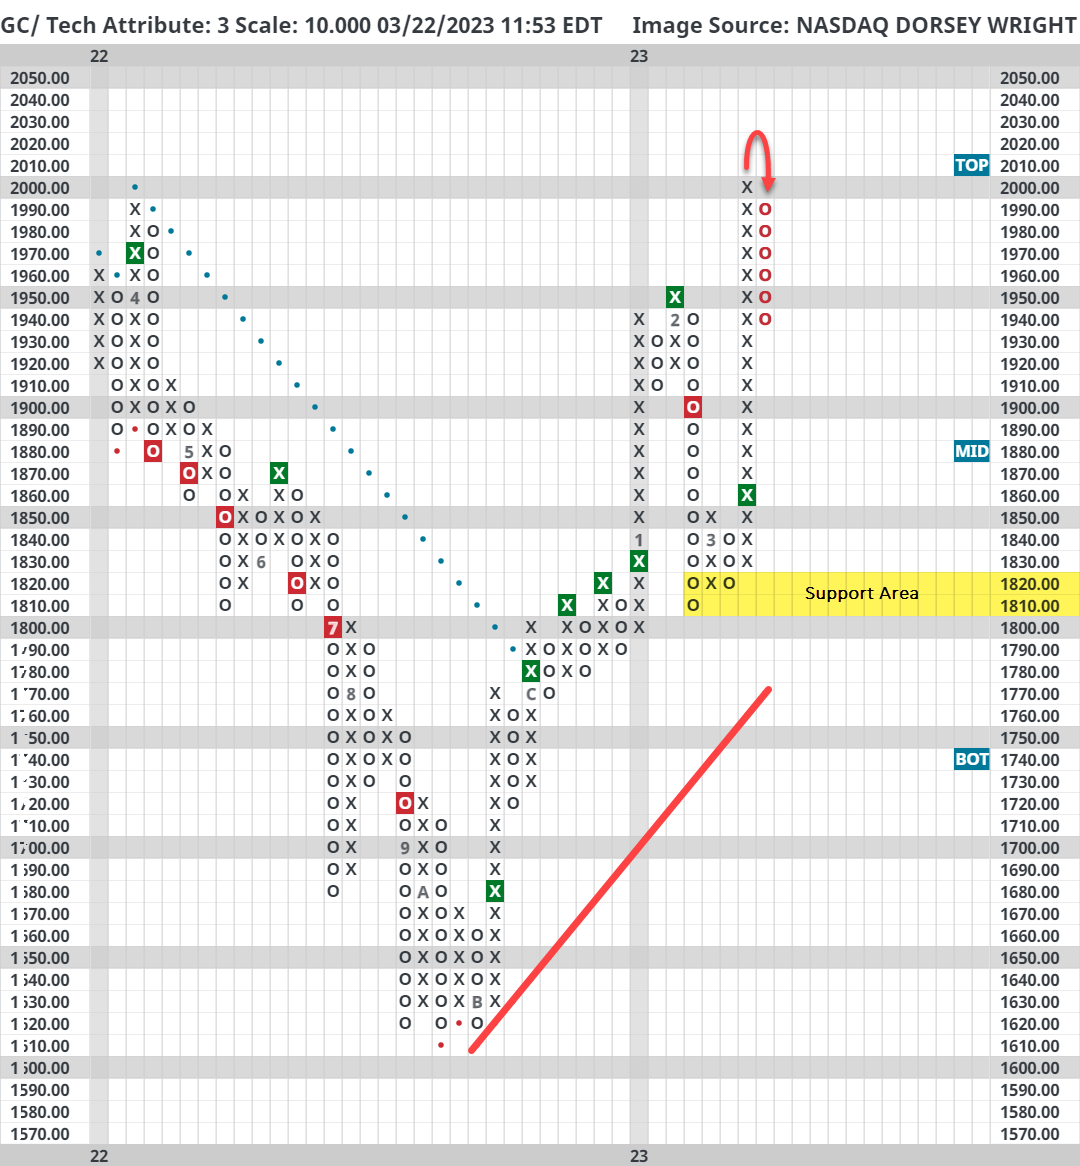
Gold (GC/) is up nearly 7% so far this year (through 3/21); however, roughly 6% of that return has come in the month of March alone due to a perceived flight to safety. As seen on the default chart of GC/ below, gold began the year on strong footing with a string of consecutive buy signals and a positive trend breakout in December. In February, the precious metal quickly pulled back to the $1800 level before catching a big tailwind in early March amidst the regional banking crisis. Following yesterday’s action, GC/ pulled back to its February highs at around $1950 after eclipsing $2000 earlier this week.
Note that support for gold is distant from current levels, not offered until around $1810 - $1820. Also, gold has been quick to react this year to headline risk-on/risk-off sentiment, so those looking to add long exposure may consider waiting for a higher bottom to be established.
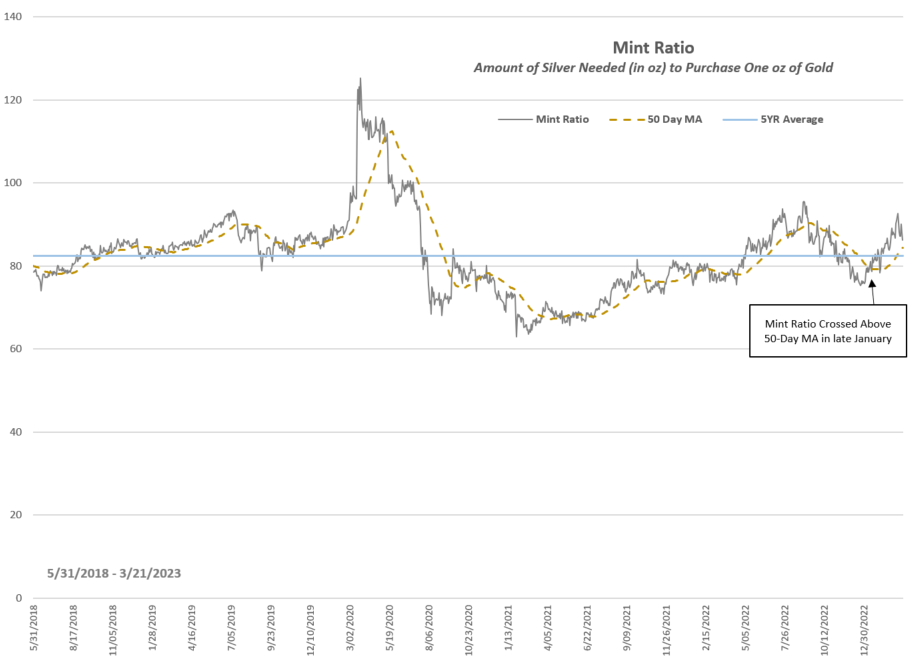
When discussing price movements for gold as potential risk-on/risk-off signals, it can be helpful to compare its behavior to silver (SI/) via the Mint Ratio. The Mint Ratio simply measures the amount of silver needed (in oz) to purchase a single ounce of gold. In most periods this relationship is inversely correlated to risk appetite, rising in market downturns as investors flock to the traditional safety of gold over silver which tends to have more economic uses.
The line chart below is a five-year history of this relationship. Interestingly, the Mint Ratio crossed above its 50-day moving average back in late January of this year, which in hindsight would have been a good risk-off signal. There are other noteworthy periods, like 2020, but also plenty of uneventful crosses. A longer-term chart (since 1976) is available upon request to the email address at the top of this Alternative Assets Update.
Going forward, investors should watch the Mint Ratio for past tops and bottoms, like September 2022 and early January 2023, respectively, for sentiment guidance. Additionally, investors should keep an eye on the ratio's 50-day moving average which is quickly approaching due to the recent pullback in gold - a break below could be interpreted as bullish for risk assets.