NDX rallies to lead US Equity indices.
US Equity indices have rallied notably to begin this week with the S&P 500 Index SPX having picked up 2.20% (3/17 to 3/21). While the Russell 2000 Index RUT is the top performer so far this week, the Nasdaq-100 NDX and Nasdaq Composite NASD carried that baton last week, as they were up 5.83% and 4.41% (3/10 to 3/17). NDX and NASD are also the top-performing US Equity indices during the month of March, up 5.81% and 3.53%, and year-to-date, up 16.47% and 13.32%. NDX has not only fared better than NASD from a performance perspective but also on its trend chart. While many US Equity indices moved into a negative trend at the beginning of March - like the Nasdaq Composite and S&P 500 SPX - the Nasdaq-100 was able to maintain its positive trend after testing the bullish support line at 11700. Action toward the end of last week saw NDX complete a bearish signal reversal to return to a buy signal before continuing higher to 12700 during action Tuesday this week. Intraday action on Wednesday brought NDX up to 12900, clearing the February rally high on the chart and bringing the index to levels not seen since August of last year.
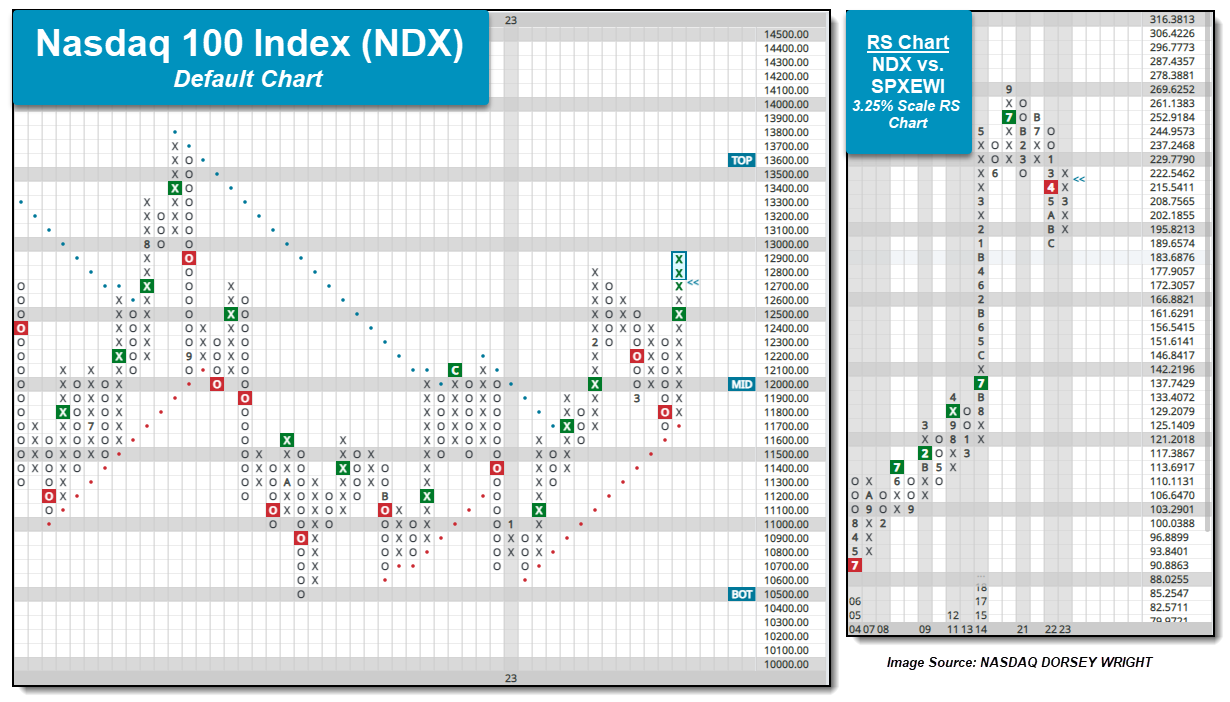
Recent action for NDX has not only led to absolute improvement but relative improvement as well. The RS chart below compares NDX to the S&P 500 Equal Weighted Index SPXEWI on a 3.25% scale, and while it remains on an RS sell signal, the chart has been in Xs since last Monday, March 13th. The shift into Xs is the first time since 2022 began that NDX has shown a near-term trend of outperformance versus SPXEWI on this chart. Additionally, the NDX versus our cash proxy RS comparison moved back to a long-term RS buy signal back in early February and the chart has maintained in Xs since that time.
While the trend and RS charts are our main two points of analysis for understanding NDX’s improvement and strength, secondary metrics like weekly momentum are on the verge of moving back positive as well. Typically, weekly momentum remains positive (or negative) for 6 to 8 weeks, and NDX has exhibited negative weekly momentum since the end of February. A flip to positive weekly momentum can be an indicator of higher prices in the near term.
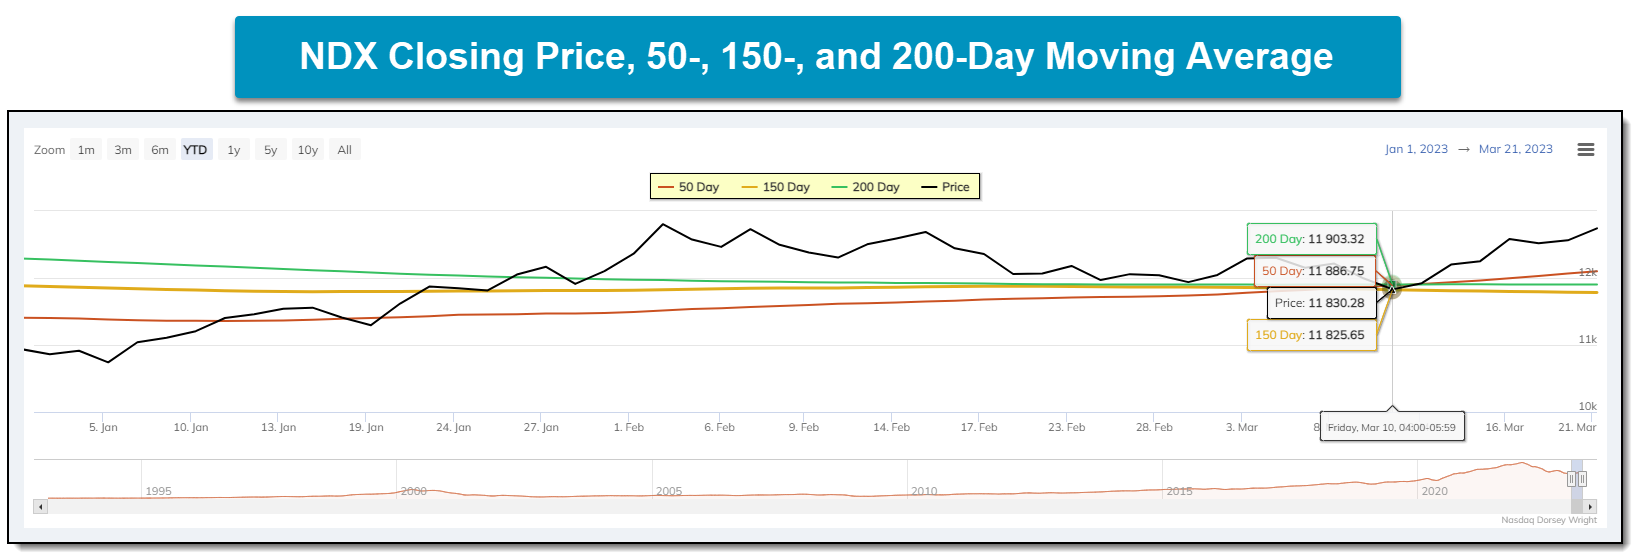
Our last observation comes from the line chart below, which plots NDX’s closing price as well as the 50-, 150-, and 200-day moving averages. Except for Friday, March 10th, NDX’s closing price has maintained above all three moving averages since the latter part of January. The Nasdaq Composite is the only other US Equity index with its current price trading above all three moving averages currently. The S&P 500 on the other hand trades below its 50-day moving average along with the Russell 1000 RUI and Dow .DJIA. The S&P 500 Equal Weighted SPXEWI and Russell 2000 both trade below their 50-, 150-, and 200-day moving averages.
While a couple of US equity indices were able to rally above resistance that dates back to August last year, most of the US Equity indices now trade below their December rally highs – except for NDX and NASD. Additionally, with Wednesday’s intraday action, the Nasdaq Composite will return to a buy signal and flip back into a positive trend, joining NDX as the only other US Equity index trend chart to trade in a positive trend. So, as it stands, NDX and NASD not only carry the near-term leadership baton from a performance standpoint but a relative and trending one as well.