Most Requested Symbols

We’re now less than two weeks away from entering the month of September, which has earned an unfavorable reputation with investors over the years.
The average distribution level is 30.93% overbought.
Today's featured stock is Northrop Grumman Systems Corporation (NOC).
Comments include: AVGO, CCOI, CLR, CTLT, DVN, FFIV, NTES, RL, SNX, and XOM.
Call: FedEx (FDX); Put: Carnival Corporation (CCL); Covered Write: Builders FirstSource (BLDR)
Upcoming RS Institute - Dallas, TX
Register to join us in person for a 3-hour educational symposium on relative strength investing. This event is for financial advisors and will offer 3 hours of CFP/CIMA credit.
Lunch will also be provided. Registration is limited to the first 75 advisors, so be sure to act fast!
Content Delivery Update: Over the past few months, the team here at Nasdaq Dorsey Wright has focused on improving our content delivery experience. As a result, we have expanded our reach to include timely updates on YouTube, Twitter, and Apple Podcasts. Be sure to subscribe or follow us on all channels for exclusive content regarding all things NDW!
Subscribe to our YouTube channel
Follow us on Twitter
Listen on Apple Podcasts
Beginners Series Webinar: Join us on Friday, August 19th, at 2 PM (ET) for our NDW Beginners Series Webinar. This week's topic is Navigating the Models Page. Register Here
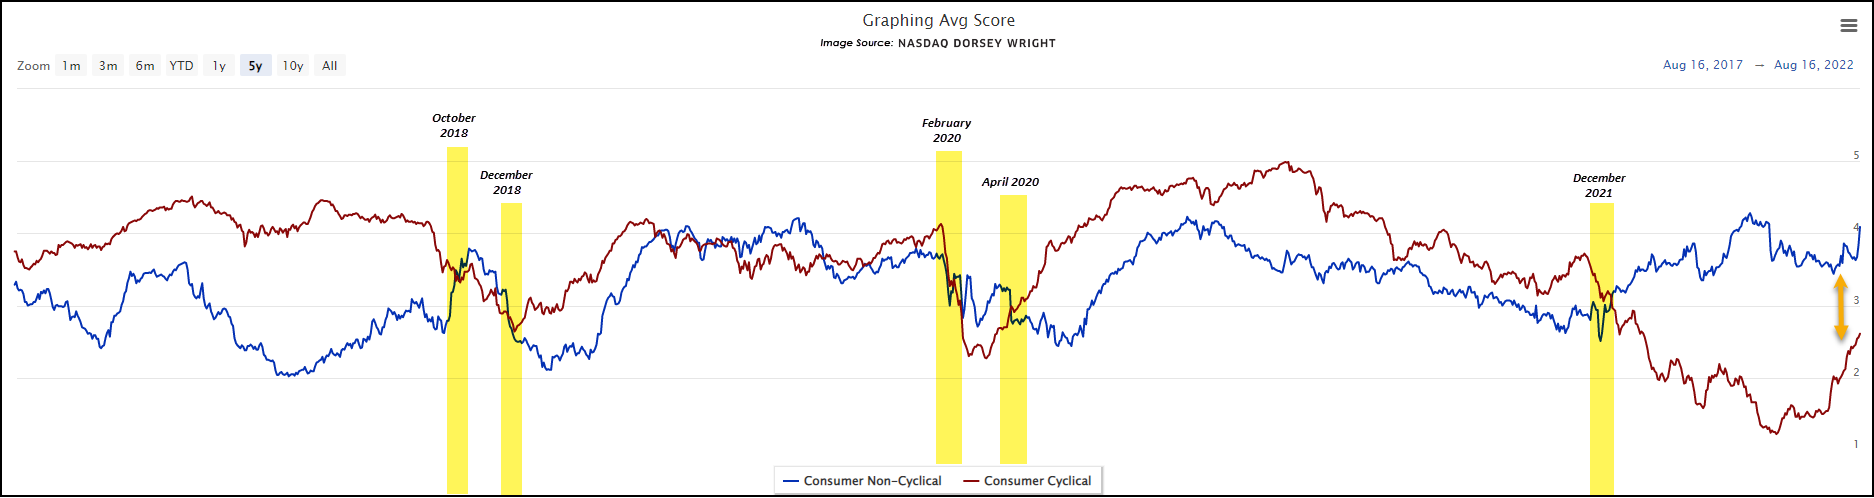
2022 has proved to be an interesting market environment, and the recent two-month rally has been no different. As discussed in previous features, strength from small-cap equities and growth stocks is to be expected from bona fide movements off lows. While this evidence is still present, broadly speaking, it should be noted that this market rally has seen continued leadership from more traditionally defensive sectors, namely utilities and consumer staples. Both sectors fought their way into overweight positions over the last two months in the DALI rankings, and currently are the only two broad-based sectors to sit above a 4.0 average score rank on our Asset Class Group Score (ACGS) page. Both sectors have an above-average score direction, suggesting continued strength in comparison to the broader market.
As seen from the chart below, crosses between defensive sectors (non-discretionary in this case) and the more “risk-on” consumer discretionary sector typically occur around key market inflection points. When consumer discretionary is in favor versus consumer staples, market conditions (usually) favor risk allocation over more stable/defensive assets. That said, the consumer discretionary average fund score has not overtaken consumer staples; in fact, the divergence between the two recently widened. Some speculation on why this is happening - dominance from "quasi staple" stocks like Costco (COST) and Estee Lauder (EL) in comparison to more traditional, “old-school” defensive equities. Also, the possibility of lingering inflationary/macro fears could push investors back to the safety of these sectors along with persistently high commodity prices (especially in the case of utilities). Whatever the fundamental case may be, the spread between consumer discretionary and the two defensive sectors is one to watch as we head into the historically weak month of September.

We’re now less than two weeks away from entering the month of September, which has earned an unfavorable reputation with investors over the years. Historically, September has been the single worst-performing month for the S&P 500 Index (SPX), the Dow Jones Industrial Average (DJIA), and the Nasdaq Composite (NASD) (Source: Stock Trader's Almanac). The Almanac says “September is when leaves and stocks tend to fall; on Wall Street, it’s the worst month of all.” September has lived up to its reputation recently as the S&P 500 (SPX) was down -3.92% and -4.76% in September of 2020 and 2021, respectively.
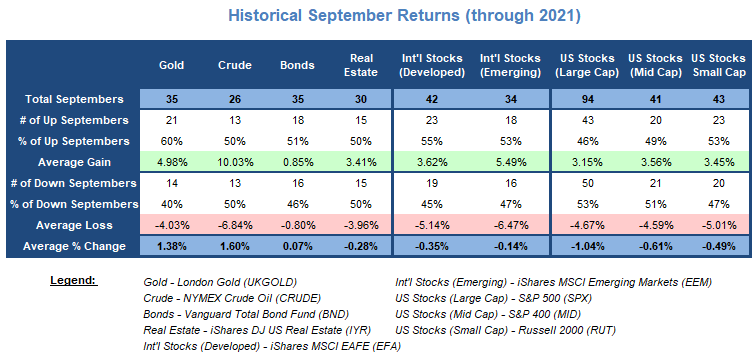
As a result of the poor equity performance, many investors look for opportunities in other assets in September. One asset in particular that receives a lot of credit for helping investors through this frustrating month is gold, and the numbers below support this statement. Gold has posted a positive return in 21 out of the 35 Septembers since 1987. In other words, September has been a positive month for gold investments about 60% of the time. The average gain for gold during all 35 Septembers measured comes out to 1.38%, with an average of 4.98% during positive Septembers.
In the table below, you will also see the historical September returns for different asset classes as far back as data exists in our system. Not surprisingly, areas like gold, crude oil, and bonds have provided the best returns. In fact, each asset class (with the exception of US large-cap and mid-cap) has produced positive returns at least half the time.
However, up versus down is just half the story -- the magnitude of returns is another thing to consider. Take a look at the two international equity proxies in the table (the developed and emerging stock ETFs). Even though they have historically posted a gain more than 50% of the time, the losing years outweigh the winning years in terms of the magnitude of movement. For example, developed international stocks have seen gains in 55% of the Septembers going back to 1980, producing an average return of 3.62% in those years. However, during the 45% of the years when this index was down during September, the average loss was -5.14%. As a result, the average return for the month of September is in the red at -0.35%. Similar numbers can be seen for US small-cap stocks as well.
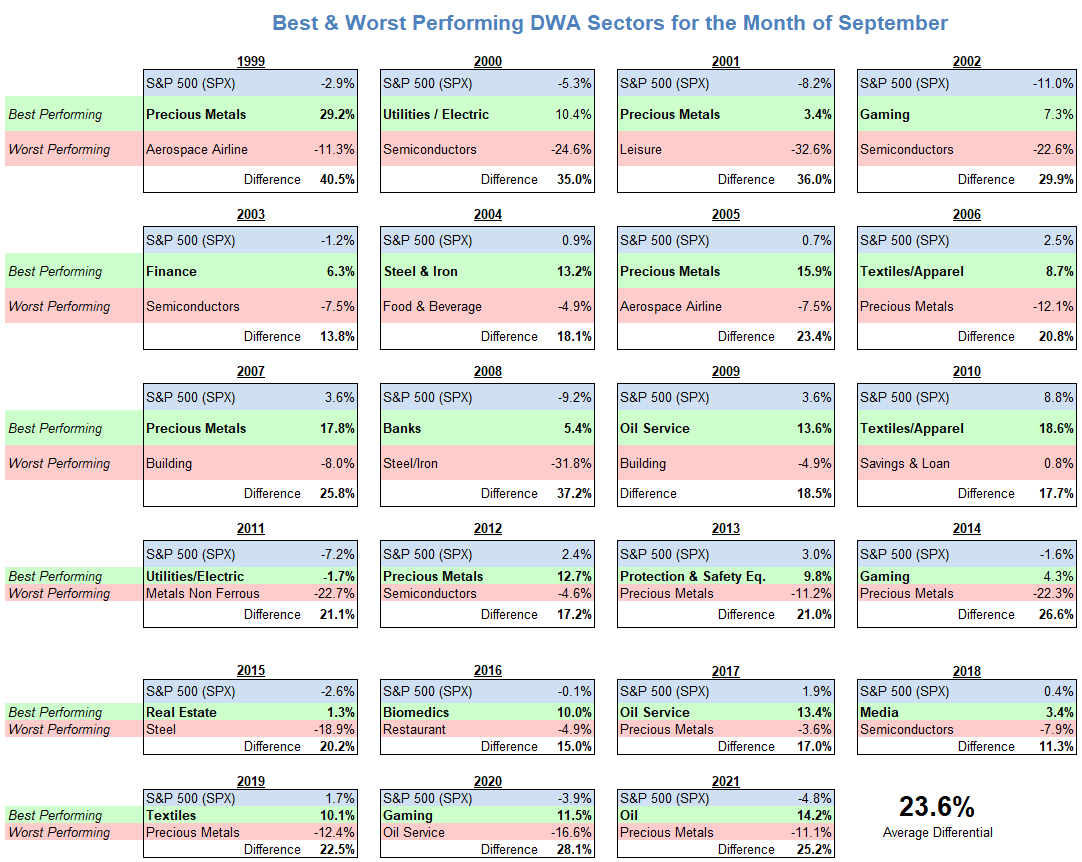
Although September is generally viewed unfavorably by equity investors, there have been a few impressive outlying Septembers, such as 2007, 2009, 2010, and 2013, all of which saw gains in excess of 3% for the S&P. Even though September has not generally been kind to the broad equity indexes, there have been opportunities provided by sector rotation. Take 2008 for instance. The SPX as a whole was down -9.20%, however, the DWA Bank Sector Index (DWABANK) actually provided a gain in excess of 5%. On the other side of the story, the Steel & Iron sector ([DWASTEE}) fell 31.8%, bringing the performance differential for September 2008 to 37.2%, the second-largest dispersion of all Septembers since 1999. Last year, while SPX was down nearly 5% in September, the DWA Oil Index ([DWAOIL]) was up more than 14%.
On average, the differential between the best and worst performing group is around 23.5% over the last 23 years. Last year, the aforementioned DWAOIL was up 14.2%, while the DWA Precious Metals Index (DWAPREC) was the worst performer, finishing down -11.1%, for a differential of 25.2%. The smallest difference between the best and the worst-performing sectors in our lookback period was in 2018 when the best and worst performing sector indexes were separated by only 11.3%, while the largest spread came in 1999 (40.5%).
In the table below, you can see the best and worst-performing sectors during the month of September for each year going back to 1999. Precious metals has been the most frequent bottom performer, turning in the worst performance six times since 1999 (2006, 2013, 2014, 2017, 2019, and 2021), however, the precious metals index has also been the best performing group in five out of the 23 years, more than any other group. Semiconductors (DAWSEMI) has been another frequent bottom performer, finishing last in five Septembers.
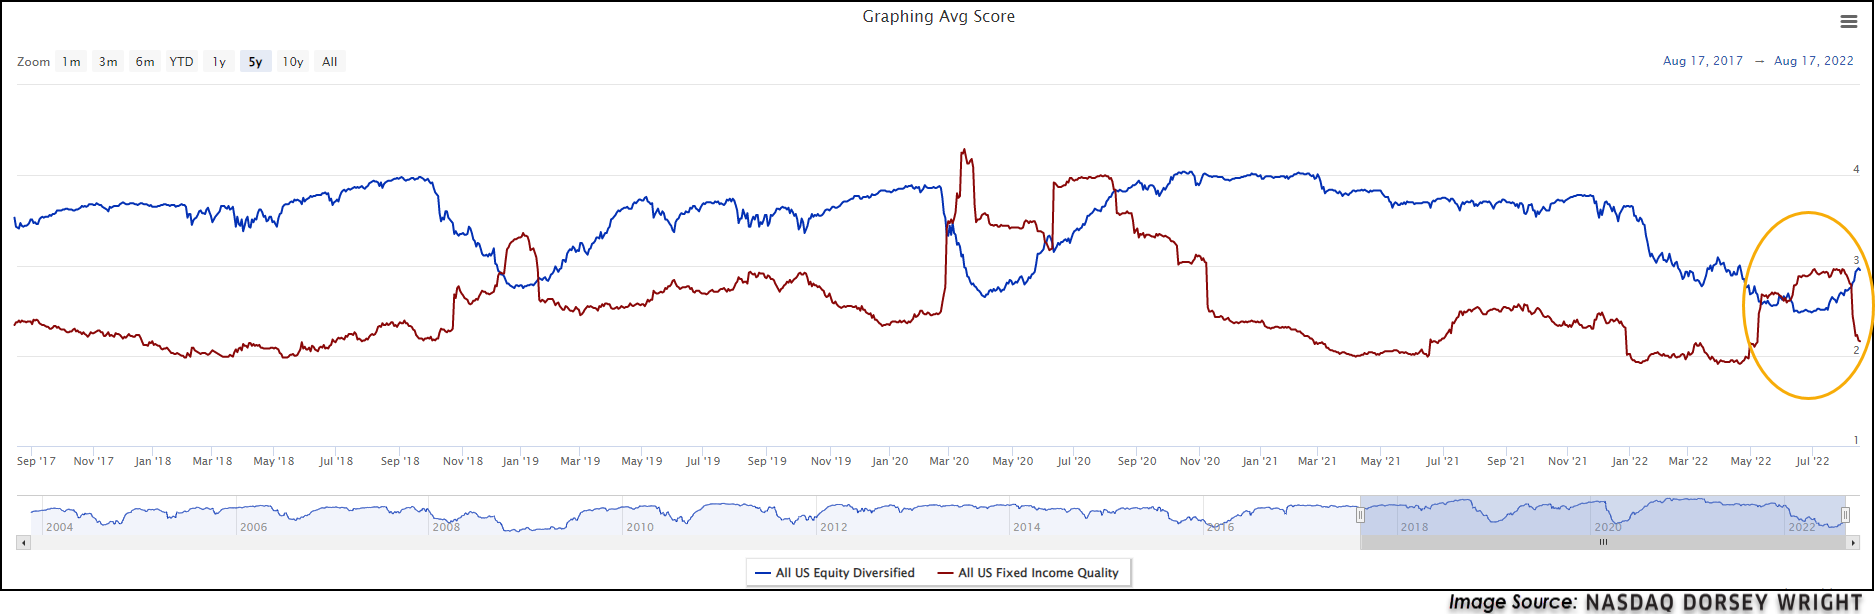
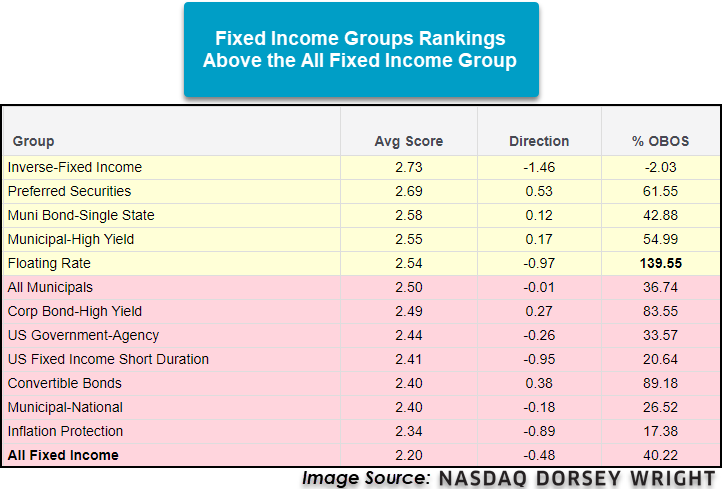
Just a few months ago, fixed income as an asset class was slowly creeping up the rankings on the Asset Class Group Scores page as equities struggled. Despite rising interest rates, fixed income securities weathered the downside seen in the equity market in a much better fashion which led to an increase in relative strength. Fast forwarding to today, domestic equities have rallied strongly over the past two months and while interest rates further out on the yield curve have fallen, they have not fallen enough for most fixed income groups to compete with equities. The fall in relative strength seen in fixed income has led to an abrupt shift in the Asset Class Group Scores rankings. As it currently stands, there are no fixed income groups with an average score above 3.0 and the Inverse-Fixed Income group is one-hundredth of a point away from being the top-ranked fixed income group. When looking at a comparison between the All US Equity Diversified and All US Fixed Income Quality groups, the sharp decline in scores becomes evident with almost all the decline in the All US Fixed Income Quality group coming after the start of August.
Shifting to just the fixed income landscape, it’s not surprising to see the top two groups with the highest score directions are Preferred Securities and Convertible Bonds, both of which have heavy ties to equity movements. One of the prior leaders of the fixed income space, US Fixed Income Short Duration, fell below the 2.5 score threshold this week but is still one of the best scoring fixed income groups on the system. Despite the recent weakness, in a market environment where the trend for long-duration interest rates is still higher, short duration is still likely to be one of the safer fixed income groups. A higher scoring group in the fixed income space that can lower the risk from rising interest rates is the Floating Rate. The Floating Rate group is one of six fixed income groups with an average score above 2.50 and benefits from rising interest rates. As most clients need fixed income exposure for a variety of reasons, it may not be plausible to completely rotate out of the space, and using a floating rate bond fund can help stabilize fixed income exposure as interest rates rise. Overall, the fixed income market remains weak as interest rates have sustained their intermediate-term trend higher. Low duration or other less interest rate sensitive groups are still preferred for the time being as strength has held up much better in these areas compared to others. As a general rule of thumb, groups that are scoring above their broad representative, in this case, All Fixed Income, are areas to target for exposure within an asset class. Even though fixed income is weak compared to other asset classes, it’s still necessary for many clients’ portfolios.

Average Level
30.93
| AGG | iShares US Core Bond ETF |
| USO | United States Oil Fund |
| DIA | SPDR Dow Jones Industrial Average ETF |
| DVY | iShares Dow Jones Select Dividend Index ETF |
| DX/Y | NYCE U.S.Dollar Index Spot |
| EFA | iShares MSCI EAFE ETF |
| FXE | Invesco CurrencyShares Euro Trust |
| GLD | SPDR Gold Trust |
| GSG | iShares S&P GSCI Commodity-Indexed Trust |
| HYG | iShares iBoxx $ High Yield Corporate Bond ETF |
| ICF | iShares Cohen & Steers Realty ETF |
| IEF | iShares Barclays 7-10 Yr. Tres. Bond ETF |
| LQD | iShares iBoxx $ Investment Grade Corp. Bond ETF |
| IJH | iShares S&P 400 MidCap Index Fund |
| ONEQ | Fidelity Nasdaq Composite Index Track |
| QQQ | Invesco QQQ Trust |
| RSP | Invesco S&P 500 Equal Weight ETF |
| IWM | iShares Russell 2000 Index ETF |
| SHY | iShares Barclays 1-3 Year Tres. Bond ETF |
| IJR | iShares S&P 600 SmallCap Index Fund |
| SPY | SPDR S&P 500 Index ETF Trust |
| TLT | iShares Barclays 20+ Year Treasury Bond ETF |
| GCC | WisdomTree Continuous Commodity Index Fund |
| VOOG | Vanguard S&P 500 Growth ETF |
| VOOV | Vanguard S&P 500 Value ETF |
| EEM | iShares MSCI Emerging Markets ETF |
| XLG | Invesco S&P 500 Top 50 ETF |
| Symbol | Company | Sector | Current Price | Action Price | Target | Stop | Notes |
|---|---|---|---|---|---|---|---|
| RLI | R L I Corp | Insurance | $118.62 | 110s | 161 | 96 | 5 for 5'er, top 20% of INSU sector matrix, spread triple top, R-R>2.0 |
| GPK | Graphic Packaging Intl. | Forest Prods/Paper | $23.35 | 21 - 23 | 26 | 18 | 5 for 5'er, #2 of 15 in favored FORE sector matrix, LT pos mkt RS, triple top, 1.3% yield |
| KDNY | Chinook Therapeutics Inc. | Biomedics/Genetics | $21.61 | 17-20 | 22 | 15 | 5 TA rating, top decile BIOM sect., cons. buy signals, pos. monthly mom. |
| ABBV | AbbVie Inc. | Drugs | $141.44 | low 150s - low 160s | 192 | 134 | 5 for 5'er, top 20% of DRUG sector matrix, 3.7% yield |
| BJ | BJ's Wholesale Club Holdings Inc | Retailing | $69.13 | mid 60s - low 70s | 83 | 55 | 5 TA rating, top quintile RETA sect., cons. buy signals, pos. wkly mom.Earn. 8/18 |
| UNH | UnitedHealth Group Incorporated | Healthcare | $545.00 | 510s - 530s | 632 | 432 | 5 for 5'er, top 25% of HEAL sector matrix, LT pos mkt RS, 1.3% yield |
| CI | CIGNA Corporation | Insurance | $291.60 | 260s - low 280s | 356 | 224 | 4 for 5'er, #3 of 67 in INSU sector matrix, new ATH, 1.6% yield |
| TAP | Molson Coors Company | Food Beverages/Soap | $55.68 | mid 50s - low 60s | 78 | 49 | 5 for 5'er, top quintile of FOOD sector matrix, quad top, 2.6% yield, R-R>2.0 |
| DOX | Amdocs Limited | Software | $89.05 | mid-80s to low 90s | 111 | 68 | 4 TA rating, top quintile SOFT matrix, cons. buy signals, recent pos. wkly mom. |
| GEF | Greif Brothers | Business Products | $71.87 | mid to hi 60s | 80 | 57 | 5 for 5'er, top 20% of BUSI sector matrix, spread triple top, 2.7% yield, Earn. 8/31 |
| AMT | American Tower REIT | Real Estate | $277.46 | 260 - 280 | 272+ | 220 | 5 for 5'er, top third of REAL sector matrix, LT pos mkt RS, spread quad top, 2.2% yield |
| TMUS | T-Mobile US Inc. | Telephone | $145.55 | mid 130s - mid 140s | 172 | 120 | 5 for 5'er, #5 of 3 in TELE sector matrix. LT pos mkt RS, triple top breakout |
| TMO | Thermo Fisher Scientific Inc. | Healthcare | $596.04 | 560s - 590s | 808 | 496 | 5 for 5'er, top quartile of HEAL sector matrix, LT pos mkt RS, big base breakout, R-R>2.0 |
| BAH | Booz Allen Hamilton Holding | Business Products | $98.14 | 90s | 110 | 79 | 4 for 5'er, 12th of 103 in favored BUSI sector matrix. triple top, 1.8% yield |
| MSFT | Microsoft Corporation | Software | $291.32 | 270s - low 290s | 352 | 240 | 5 for 5'er, top half of favored SOFT sector matrix, LT pos mkt RS, spread triple top, pos trend change |
| WPC | W.P. Carey & Co. LLC | Real Estate | $88.29 | $80s | 100 | 71 | 4 TA rating, top decile REAL sector, consec. buy signals, recent pos. wkly mom., buy-on-pullback, 5.01% yield |
| GOOGL | Alphabet Inc. Class A | Internet | $119.55 | mid 110s - mid 120s | 152 | 100 | 4 for 5'er, top half of favored INET sector matrix, LT pos mkt RS, quad top breakout |
| MCD | McDonald's Corporation | Restaurants | $266.82 | hi 240s - mid 260s | 324 | 220 | 4 for 5'er, top third of favored REST sector matrix, LT pos mkt RS, bullish triangle, 2.15% yield |
| ABC | AmerisourceBergen Corporation | Drugs | $149.53 | mid 140s - mid 150s | 172 | 126 | 4 for 5'er, top half of favored DRUG sector matrix, triple top, pos trend change, 1.2% yield |
| LVS | Las Vegas Sands Corp. | Gaming | $37.45 | hi 30s - low 40s | 56 | 30 | 4 TA rating, top third GAME sect., recent pos. trend., pos. monthly mom. |
| XENE | Xenon Pharmaceuticals Inc | Healthcare | $36.40 | mid to upper $30s | 42 | 30 | 5 for 5'er, top 25% of favored HEAL sector matrix, spread quad top, pullback from ATH |
| NOC | Northrop Grumman Systems Corporation | Aerospace Airline | $492.51 | 470s to 510s | 616 | 396 | 4 TA rating, top decile of AERO sect., spread triple top breakout, pos. wkly mom. |
| Symbol | Company | Sector | Current Price | Action Price | Target | Stop | Notes |
|---|
| Comment | |||||||
|---|---|---|---|---|---|---|---|
|
|
|||||||
NOC Northrop Grumman Systems Corporation R ($492.04) - Aerospace Airline - NOC has a strong 4 TA rating and sits in the top decile of the aerospace airline sector RS matrix. The stock showed notable improvement early this year before consolidating toward the middle of the current trading band since March. The movement this week saw NOC move out of this trading range with a spread triple top break at $496, marking a new all-time high. Weekly momentum also just flipped positive, suggesting the potential for further upside from here. Exposure may be considered from the low $470s to the upper $510s. Our initial stop will be set at $396, which would violate multiple support levels and move the stock into a negative trend. The bullish price objective of $616 will serve as our price target.
| 21 | 22 | ||||||||||||||||||||||||||||||||||||||||||||||||||||
| 496.00 | • | X | 496.00 | ||||||||||||||||||||||||||||||||||||||||||||||||||
| 488.00 | X | X | • | • | • | X | 488.00 | ||||||||||||||||||||||||||||||||||||||||||||||
| 480.00 | X | O | 6 | O | X | • | X | • | 8 | 480.00 | |||||||||||||||||||||||||||||||||||||||||||
| 472.00 | X | O | X | X | O | X | O | X | O | X | 472.00 | ||||||||||||||||||||||||||||||||||||||||||
| 464.00 | X | O | 4 | O | X | X | O | X | O | X | O | X | Mid | 464.00 | |||||||||||||||||||||||||||||||||||||||
| 456.00 | X | O | X | X | O | X | O | X | O | X | 7 | • | O | X | 456.00 | ||||||||||||||||||||||||||||||||||||||
| 448.00 | 3 | O | X | O | X | O | X | O | X | O | X | • | O | X | 448.00 | ||||||||||||||||||||||||||||||||||||||
| 440.00 | X | O | X | O | X | O | X | O | O | • | O | • | 440.00 | ||||||||||||||||||||||||||||||||||||||||
| 432.00 | X | O | X | O | 5 | • | • | 432.00 | |||||||||||||||||||||||||||||||||||||||||||||
| 424.00 | X | O | • | 424.00 | |||||||||||||||||||||||||||||||||||||||||||||||||
| 416.00 | X | • | 416.00 | ||||||||||||||||||||||||||||||||||||||||||||||||||
| 408.00 | X | X | X | • | 408.00 | ||||||||||||||||||||||||||||||||||||||||||||||||
| 400.00 | X | O | X | O | X | X | X | • | 400.00 | ||||||||||||||||||||||||||||||||||||||||||||
| 396.00 | X | X | O | X | O | X | O | X | O | X | • | Bot | 396.00 | ||||||||||||||||||||||||||||||||||||||||
| 392.00 | X | O | X | O | 1 | O | X | O | X | O | X | • | 392.00 | ||||||||||||||||||||||||||||||||||||||||
| 388.00 | X | O | X | O | X | O | X | O | X | O | • | 388.00 | |||||||||||||||||||||||||||||||||||||||||
| 384.00 | X | O | O | X | O | X | O | • | 384.00 | ||||||||||||||||||||||||||||||||||||||||||||
| 380.00 | X | O | X | X | O | 2 | • | 380.00 | |||||||||||||||||||||||||||||||||||||||||||||
| 376.00 | X | X | X | O | X | O | X | O | X | • | 376.00 | ||||||||||||||||||||||||||||||||||||||||||
| 372.00 | X | O | X | O | 7 | X | O | X | O | X | O | X | • | 372.00 | |||||||||||||||||||||||||||||||||||||||
| 368.00 | X | O | X | O | X | O | X | A | O | X | X | O | O | • | 368.00 | ||||||||||||||||||||||||||||||||||||||
| 364.00 | X | O | 6 | X | O | X | O | X | O | B | X | O | X | • | 364.00 | ||||||||||||||||||||||||||||||||||||||
| 360.00 | 5 | O | O | X | O | X | O | X | O | X | O | X | • | 360.00 | |||||||||||||||||||||||||||||||||||||||
| 356.00 | X | O | X | 9 | X | O | X | O | X | O | X | • | 356.00 | ||||||||||||||||||||||||||||||||||||||||
| 352.00 | X | O | O | X | O | O | X | O | X | • | 352.00 | ||||||||||||||||||||||||||||||||||||||||||
| 348.00 | X | O | O | • | C | • | 348.00 | ||||||||||||||||||||||||||||||||||||||||||||||
| 344.00 | X | • | • | • | 344.00 | ||||||||||||||||||||||||||||||||||||||||||||||||
| 340.00 | X | • | 340.00 | ||||||||||||||||||||||||||||||||||||||||||||||||||
| 336.00 | X | • | 336.00 | ||||||||||||||||||||||||||||||||||||||||||||||||||
| 332.00 | X | • | 332.00 | ||||||||||||||||||||||||||||||||||||||||||||||||||
| 328.00 | 4 | • | 328.00 | ||||||||||||||||||||||||||||||||||||||||||||||||||
| 324.00 | • | X | • | 324.00 | |||||||||||||||||||||||||||||||||||||||||||||||||
| 320.00 | • | • | X | • | 320.00 | ||||||||||||||||||||||||||||||||||||||||||||||||
| 316.00 | X | X | • | X | • | 316.00 | |||||||||||||||||||||||||||||||||||||||||||||||
| 312.00 | X | O | X | O | • | X | • | 312.00 | |||||||||||||||||||||||||||||||||||||||||||||
| 308.00 | X | O | X | O | X | • | • | • | X | X | • | 308.00 | |||||||||||||||||||||||||||||||||||||||||
| 304.00 | X | O | O | X | O | X | • | X | • | 3 | O | X | • | 304.00 | |||||||||||||||||||||||||||||||||||||||
| 300.00 | O | X | O | X | O | X | O | X | O | X | • | 300.00 | |||||||||||||||||||||||||||||||||||||||||
| 296.00 | C | X | O | 2 | O | X | O | X | O | • | 296.00 | ||||||||||||||||||||||||||||||||||||||||||
| 292.00 | 1 | X | O | X | O | • | O | • | • | 292.00 | |||||||||||||||||||||||||||||||||||||||||||
| 288.00 | O | O | X | • | • | 288.00 | |||||||||||||||||||||||||||||||||||||||||||||||
| 284.00 | O | • | 284.00 | ||||||||||||||||||||||||||||||||||||||||||||||||||
| 21 | 22 |

| AVGO Broadcom Ltd ($558.45) - Semiconductors - AVGO moved higher Thursday to break a double top at $560. This also broke through the bearish resistance line to place the stock in a positive trend, improving AVGO to a 5 TA rating. The stock also sits in the top half of the favored semiconductors sector RS matrix and has maintained an RS buy signal against the market since 2010. Exposure may be considered on this breakout. Initial support is offered at $528, with further support potentially found at $488. Note that the earnings are expected on 9/1. |
| CCOI Cogent Communications Group, Inc. ($57.81) - Internet - CCOI broke a double bottom at $58 to return to a sell signal and violate the bullish support line. The stock will become a 2 for 5'er will fall in rank furhter into the bottom half of the Internet sector matrix. A move above $65 would return to trend to positive and a buy signal. Support lies at $56, the May and June 2022 lows. |
| CLR Continental Resources Inc. ($70.56) - Oil - CLR gave a second consecutive buy signal on Thursday when it broke a triple top at $70. The move also returned CLR to positive trend and will elevate it to a 5 for 5'er. From here, CLR faces overhead resistance at $75, its multi-year high. Meanwhile, support can be found at $66. |
| CTLT Catalent Inc. ($106.42) - Drugs - CTLT shares moved lower today to break a double bottom at $106 to mark its first sell signal. This 4 for 5'er has been in a positive trend since July but on an RS sells signal versus the market since February. CLTL is trading in the middle of its trading band and is testing its bullish support line. From here, support is offered at $99. |
| DVN Devon Energy Corporation ($67.92) - Oil - DVN returned to a positive trend and gave a third consecutive buy signal on Thursday when it broke a double top at $66. The positive trend change will promote DVN to a 4 for 5'er; the stock also ranks in the top half of the oil sector matrix. From here, DVN faces overhead resistance at $72, while support sits at $62. DVN carries a 9.75% yield. |
| FFIV F5 Inc. ($173.44) - Internet - FFIV broke a double top at $174 for a third consecutive buy signal. The stock is a 3 for 5'er that ranks in the bottom half of the Internet sector matrix. Resistance lies at $178. Support lies at $166 and $160. |
| NTES Netease.com Inc. (China) ADR ($85.41) - Internet - NTES broke a double top at $94 for a second consecutive buy signal. The stock is a 4 for 5'er that is rebounding after pulling back in the late-July and early-August. Resistance lies at $97 and $100. Support lies at $90, the bullish support line, as well as in the $87 to $88 range. |
| RL Ralph Lauren ($98.61) - Textiles/Apparel - RL broke a double bottom at $96 for a second sell signal and to violate the bullish support line. This will bring the stock down to a 1 for 5'er. Support now lies at $94 and $91. |
| SNX TD SYNNEX Corporation ($106.57) - Computers - SNX gave a second consecutive buy signal at $106 Thursday, matching the rally high from June. This 4 for 5'er moved to a positive trend in July and ranks in the top half of the computers sector RS matrix. Monthly momentum also recently flipped positive, suggesting the potential for further upside from here. Initial support is found at $98 with further support at $92, which is the current level of the bullish support line. |
| XOM Exxon Mobil Corporation ($94.38) - Oil - XOM gave a third consecutive buy signal Thursday when it completed a bullish triangle at $95. The move adds further positive evidence to XOM's technical picture as the stock is a 4 for 5'er and ranks in the top quintile of the oil sector matrix. XOM now finds support at $90, while overhead resistance sits at $97. |
| Name | Option Symbol | Action | Stop Loss |
|---|---|---|---|
| FedEx Corporation - $234.69 | FDX2216L230 | Buy the December 230.00 calls at 20.90 | 208.00 |
| Name | Option | Action |
|---|---|---|
| United Parcel Service, Inc. ( UPS) | Oct. 185.00 Calls | Raise the option stop loss to 23.40 (CP: 25.40) |
| BJ's Wholesale Club Holdings Inc ( BJ) | Nov. 65.00 Calls | Initiate an option stop loss of 9.70 (CP: 11.70) |
| Lowe's Companies Inc. ( LOW) | Oct. 200.00 Calls | Raise the option stop loss to 19.00 (CP: 21.00) |
| Estee Lauder Companies ( EL) | Jan. 270.00 Calls | Raise the option stop loss to 28.60 (CP: 30.60) |
| Name | Option Symbol | Action | Stop Loss |
|---|---|---|---|
| Carnival Corporation - $10.47 | CCL2320M10 | Buy the January 10.00 puts at 1.66 | 11.00 |
| Name | Option | Action |
|---|---|---|
|
|
||
| Name | Option Sym. | Call to Sell | Call Price | Investment for 500 Shares | Annual Called Rtn. | Annual Static Rtn. | Downside Protection |
|---|---|---|---|---|---|---|---|
| Builders FirstSource, Inc. $67.00 | BLDR2218K70 | Nov. 70.00 | 5.20 | $32,109.40 | 31.47% | 27.56% | 6.50% |
| Name | Action |
|---|---|
| Occidental Petroleum Corporation (OXY) - 62.97 | Sell the October 65.00 Calls. |
| CrowdStrike Holdings, Inc. Class A (CRWD) - 196.89 | Sell the October 190.00 Calls. |
| CrowdStrike Holdings, Inc. Class A (CRWD) - 196.89 | Sell the October 190.00 Calls. |
| Chewy, Inc. Class A (CHWY) - 48.25 | Sell the October 45.00 Calls. |
| EQT Corporation (EQT) - 47.11 | Sell the October 44.00 Calls. |
| CF Industries Holdings, Inc. (CF) - 103.60 | Sell the November 100.00 Calls. |
| Antero Resources Corp (AR) - 40.24 | Sell the November 40.00 Calls. |
| Amazon.com Inc. (AMZN) - 142.10 | Sell the November 145.00 Calls. |
| Lattice Semiconductor Corp (LSCC) - 61.52 | Sell the December 70.00 Calls. |
| The Boeing Company (BA) - 167.20 | Sell the October 170.00 Calls. |
| Plug Power Inc. (PLUG) - 28.47 | Sell the November 27.50 Calls. |
| Sunrun Inc (RUN) - 33.85 | Sell the November 40.00 Calls. |
| Dollar Tree, Inc. (DLTR) - 168.18 | Sell the November 170.00 Calls. |
| Exxon Mobil Corporation (XOM) - 92.20 | Sell the November 95.00 Calls. |
| Apollo Global Management Inc. (APO) - 59.24 | Sell the December 62.50 Calls. |
| Cenovus Energy Inc. (CVE) - 17.93 | Sell the December 19.00 Calls. |
| Name | Covered Write |
|---|---|
| BJ's Wholesale Club Holdings Inc ( BJ - 69.13 ) | November 70.00 covered write. |
Daily Equity & Market Analysis
NDW MORNING UPDATE
Dec 16, 2025
Loading, Please Wait...
