We’re now less than two weeks away from entering the month of September, which has earned an unfavorable reputation with investors over the years.
We’re now less than two weeks away from entering the month of September, which has earned an unfavorable reputation with investors over the years. Historically, September has been the single worst-performing month for the S&P 500 Index (SPX), the Dow Jones Industrial Average (DJIA), and the Nasdaq Composite (NASD) (Source: Stock Trader's Almanac). The Almanac says “September is when leaves and stocks tend to fall; on Wall Street, it’s the worst month of all.” September has lived up to its reputation recently as the S&P 500 (SPX) was down -3.92% and -4.76% in September of 2020 and 2021, respectively.
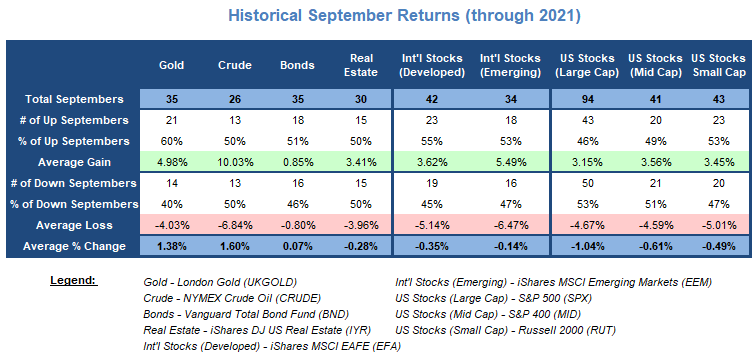
As a result of the poor equity performance, many investors look for opportunities in other assets in September. One asset in particular that receives a lot of credit for helping investors through this frustrating month is gold, and the numbers below support this statement. Gold has posted a positive return in 21 out of the 35 Septembers since 1987. In other words, September has been a positive month for gold investments about 60% of the time. The average gain for gold during all 35 Septembers measured comes out to 1.38%, with an average of 4.98% during positive Septembers.
In the table below, you will also see the historical September returns for different asset classes as far back as data exists in our system. Not surprisingly, areas like gold, crude oil, and bonds have provided the best returns. In fact, each asset class (with the exception of US large-cap and mid-cap) has produced positive returns at least half the time.
However, up versus down is just half the story -- the magnitude of returns is another thing to consider. Take a look at the two international equity proxies in the table (the developed and emerging stock ETFs). Even though they have historically posted a gain more than 50% of the time, the losing years outweigh the winning years in terms of the magnitude of movement. For example, developed international stocks have seen gains in 55% of the Septembers going back to 1980, producing an average return of 3.62% in those years. However, during the 45% of the years when this index was down during September, the average loss was -5.14%. As a result, the average return for the month of September is in the red at -0.35%. Similar numbers can be seen for US small-cap stocks as well.
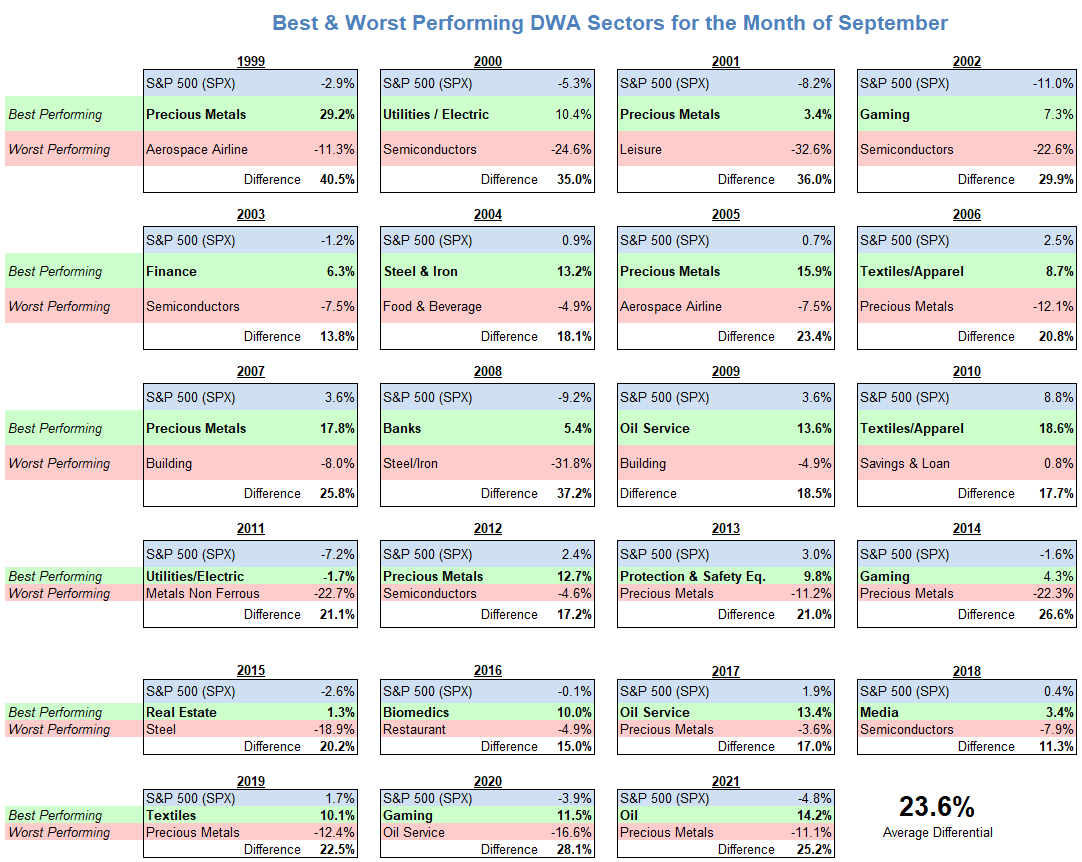
Although September is generally viewed unfavorably by equity investors, there have been a few impressive outlying Septembers, such as 2007, 2009, 2010, and 2013, all of which saw gains in excess of 3% for the S&P. Even though September has not generally been kind to the broad equity indexes, there have been opportunities provided by sector rotation. Take 2008 for instance. The SPX as a whole was down -9.20%, however, the DWA Bank Sector Index (DWABANK) actually provided a gain in excess of 5%. On the other side of the story, the Steel & Iron sector ([DWASTEE}) fell 31.8%, bringing the performance differential for September 2008 to 37.2%, the second-largest dispersion of all Septembers since 1999. Last year, while SPX was down nearly 5% in September, the DWA Oil Index ([DWAOIL]) was up more than 14%.
On average, the differential between the best and worst performing group is around 23.5% over the last 23 years. Last year, the aforementioned DWAOIL was up 14.2%, while the DWA Precious Metals Index (DWAPREC) was the worst performer, finishing down -11.1%, for a differential of 25.2%. The smallest difference between the best and the worst-performing sectors in our lookback period was in 2018 when the best and worst performing sector indexes were separated by only 11.3%, while the largest spread came in 1999 (40.5%).
In the table below, you can see the best and worst-performing sectors during the month of September for each year going back to 1999. Precious metals has been the most frequent bottom performer, turning in the worst performance six times since 1999 (2006, 2013, 2014, 2017, 2019, and 2021), however, the precious metals index has also been the best performing group in five out of the 23 years, more than any other group. Semiconductors (DAWSEMI) has been another frequent bottom performer, finishing last in five Septembers.