Most Requested Symbols

In yesterday’s (1/19) trading, the iShares Russell 2000 ETF (IWM) broke a spread quintuple bottom when it hit $205, taking out support that had held since March of last year. The fund now sits at roughly the same level it did in early January 2021, about 15% off the all-time high it reached in November of last year. With the violation of major support yesterday and IWM now trading in correction territory, today we wanted to take a deeper look to see which areas of small caps have held up the best and which have been particularly weak.
The average distribution reading is -27.72% oversold.
Today's featured stock is Cushman & Wakefield Plc (CWK)
ABG, BC, OXM, PLCE, VFC, RGLD, CEVA, SEE, TTC, CNMD, ZBRA, & ALRM.
Call: Stag Industrial (STAG); Put: eBay (EBAY); Covered Write: Live Nation (LYV)
NDW Morning Update Video - January 21, 2022
NDW Morning Update Video
Click here to download MP3
Beginners Series Webinar: Join us on Friday, January 21st, at 2 PM (ET) for our NDW Beginners Series Webinar. This week's topic is Using the Dashboard & Account Preferences. Register Here
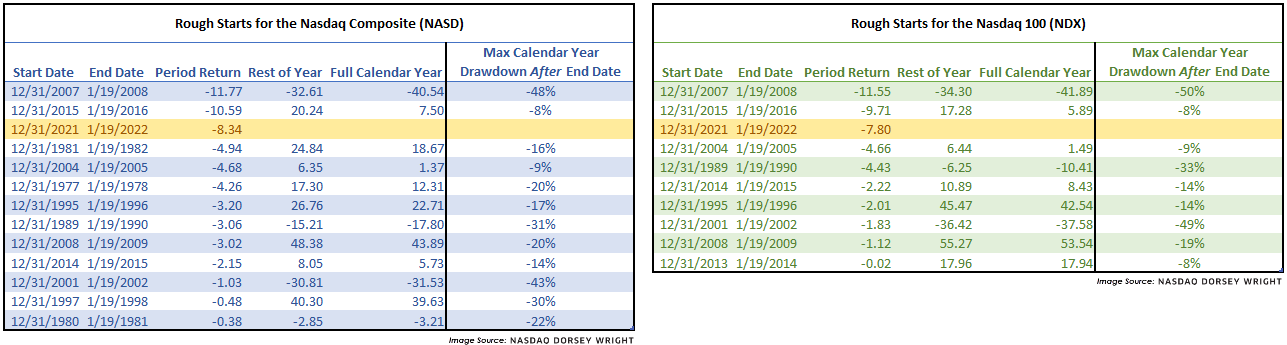
The Nasdaq Composite (NASD) is down over 8% year-to-date (through 1/19), which marks its third-worst start to a calendar year with data going back to 1977. The last time we saw a worse start to the year was in 2016 when the index was already off over 10% at this point. The Nasdaq 100 (NDX) is also under pressure, marking its third-worst start to a year since 2016 with a loss of 7.8%.
It is rare to see these indices treading underwater at this point in the year; in fact, over the past 45 years (including 2022) the Nasdaq Composite has only experienced this 13 times or said differently, the index has been positive by January 19th 70% of the time (there is nothing special about January 19th other than it is the most recent day of market action used in our lookback period). Apart from a couple of notable outliers, we see markets finish the year in the positive territory about 2/3rds of the time. However, we also tend to see elevated volatility persist – evidenced by the fact most drawdowns intensified.
Although many Nasdaq Composite/NDX-related areas of the market are trading near washed-out territory, based on this small data set we could reasonably expect to see further buying opportunities. The current environment could be likened to the metaphor of catching a falling knife, which we try to avoid. So, remain patient, keep a close watch on bullish percent charts in oversold field position, and wait for demand to reenter the picture with Point & Figure buy signals on individual trend charts.

In yesterday’s (1/19) trading, the iShares Russell 2000 ETF (IWM) broke a spread quintuple bottom when it hit $205, taking out support that had held since March of last year. The fund now sits at roughly the same level it did in early January 2021, about 15% off the all-time high it reached in November of last year.
With the violation of major support yesterday and IWM now trading in correction territory, today we wanted to take a deeper look to see which areas of small caps have held up the best and which have been particularly weak.
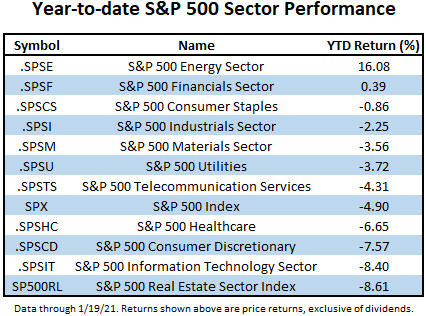
In the large cap space, energy has been by far the best performing sector in the S&P 500, up just over 16% year-to-date. Energy is followed by financials, which has gained 0.39% and is the only other S&P 500 sector in the green this year. On the other end of the spectrum, real estate has been the worst-performing sector in the S&P this year, down more than -8.5%. Real estate is followed closely by technology, which has shed -8.4% in 2022 as the sector has been hampered by concerns about rising rates and stretched valuations as we discussed last week.
Looking at the year-to-date sector attribution for IWM, we see a similar picture of leadership. As in large cap, energy is by far the best performing small cap sector, with a total return north of 10.5%, it is also the only sector that shows positive YTD performance. Like in large caps, financials has been the second-best performing small cap sector in 2022. However, while real estate has been the worst performer in the S&P 500, healthcare has been the biggest laggard in small caps, unfortunately, it is also has the largest weight within IWM at over 17%. Meanwhile, technology has been the second-worst performing sector in IWM, as was its S&P 500 counterpart.
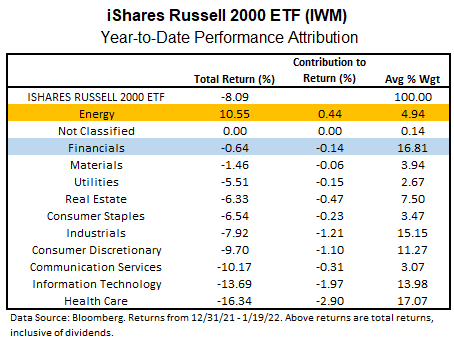
In last week’s piece about tech valuations, we also mentioned the recent bias towards large cap stocks outperforming small caps within the Nasdaq (NASD). Based on the year-to-date numbers, we can see that this bias has not been limited to Nasdaq or technology stocks. Looking only at the headline numbers, it is apparent large caps have a clear advantage as IWM has posted a year-to-date total return of -8.09% (through 1/19), while the S&P 500 Total Return Index (TR.SPXX) is down -4.84%. The bias towards large caps also carries through to the sector level in almost every instance. Out of the 11 macro sectors, there are only two instances – basic materials and real estate – where a sector within IWM has outperformed its S&P 500 counterpart. The largest differential coming in the health care sector, where small caps have lost -16.34%, while the S&P 500 Healthcare Sector Index (.SPHC) is down -6.65%, it is also worth noting that the performance numbers for the small sectors in the IWM attribution are based on total return, while the S&P 500 sector returns are price return, which gives an advantage to the small cap sectors to the extent that any dividends have been paid this year.
Beyond mere performance numbers, we can also see the bias toward large caps is reflected in the fund scores for the individual sector funds in both size groups. The table below displays the Select SPDR Sector funds, representing the S&P 500 sectors next to their small cap counterparts, represented by the Invesco S&P Small Cap Sector funds.
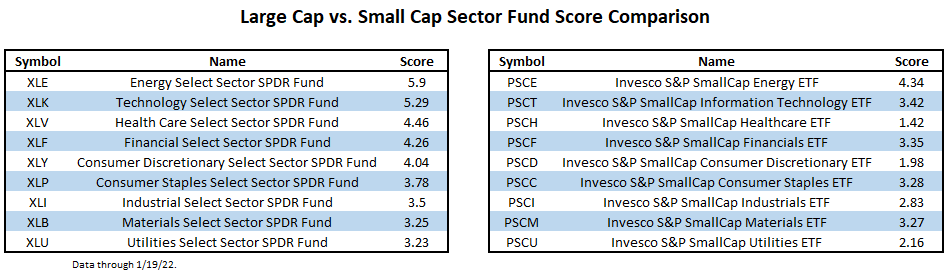
In eight of nine sectors (real estate and communication services have been excluded due the absence of representative small cap funds), the large cap representative has a superior fund score reading; the lone exception is the materials sector where the small cap materials ETF (PSCM) has a slightly higher score than its large cap counterpart, (XLB), 3.27 vs. 3.25. It is also worth noting that the lowest-scoring small cap fund is the healthcare representative (PSCH); the sector that has the highest weighting in IWM and is also the worst performer year-to-date. The Invesco small cap funds are based on S&P small cap sector indexes, while IWM is based on the Russell 2000, so there are undoubtedly some differences in the composition of these ETFs versus the sectors within IWM, however, in both instances there as an observable bias towards large caps.
Overall, there does not appear to be a significant difference in sector leadership between large and small cap. Year-to-date, the energy and financial sectors have posted the best performance within their respective size categories and the energy sector funds have the strongest fund scores within both groups.
However, in the current environment there does appear to be a clear bias toward large caps almost across the board as was reflected in both the year-to-date performance numbers and the scores of the individual sector funds.
The sector allocation of the Russell 2000, and by extension, IWM, also appears to be a significant headwind currently. Its largest sector by weight, health care, has been the worst performing small cap sector year-to-date and the healthcare sector ETF has the weakest fund score reading among the small cap sector fund lineup. Consumer discretionary, which has the second-weakest score posting in the small cap ETF family, also has a relatively large weighting within IWM – 11.27% on average in 2022.
Investors may do well to utilize an alternative weighting scheme for their small cap exposure that emphasizes areas of strength, while significantly underweighting or avoiding some of the weakest areas within the space, which happen to also have some of the largest weightings in the Russell 2000 index.
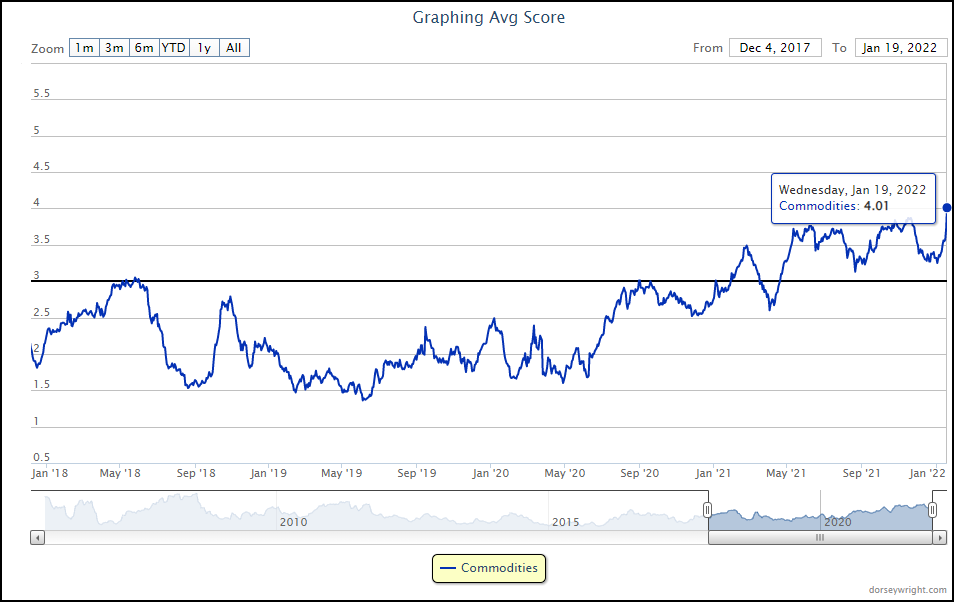
Alternative markets have been one of the few asset classes to start off 2022 on a strong footing, with muted returns from international equities and pullbacks experienced across domestic equities. One of the major stories in alternative investments this month has been the resurgence in oil, with the crude oil continuous CL/ chart reaching a new 52-week high at $86 in trading Wednesday (as discussed in yesterday’s Alternative Assets Overview). This has helped the broad commodities group climb into the “blue sky zone” on the Asset Class Group Scores (ACGS) page with the recent score posting of 4.01 marking the group’s highest average score reading since 2011. Commodities have remained north of the 3.00 score threshold since April of last year and began to move rapidly higher in late December before ascending to current levels.
The rise in crude oil prices has led to swift score movement from the MLPs group, which rose from a score of 3.15 at the end of 2021 to a recent score posting of 4.41. While this improvement has been notable, MLPs have a tendency to show heightened volatility with a group rRisk score of 2.48. The group is also nearing overbought positioning with the second-highest weekly OBOS average on the entire ACGS system at a recent posting of 79.74%.
There certainly may be actionable areas within the MLP space, however, oil-related funds are not the only aspect of commodity markets to show recent improvement. Agriculture showed improvement alongside broad commodities beginning at the end of 2020 but saw relatively muted movement throughout the second half of 2021. The group pushed higher this week to match the MLP group score at 4.41, marking its highest score since 2011 as well. The agriculture group score direction sits at 1.30, which is among the highest directional moves out of all 135 ACGS groups.
There are limited options for those looking to invest in the agriculture space, but one broad option is the Invesco DB Agriculture Fund DBA. This fund has shown notable improvement on its ¼ point chart, giving two consecutive buy signals before reversing back up into a column of Xs to form another double top at $20.25 in Wednesday’s trading. DBA sits at a favorable 4.53 fund score posting, which bests the average agriculture score (4.41) as well as the average all-US score (3.25), and is paired with a sharply positive 2.63 score direction. Note that DBA does generate a K1 and carries an expense ratio of 0.94%. Those looking to add exposure may consider DBA at current levels, with initial support seen on the ¼ point chart at $19.50.


Average Level
-27.72
| AGG | iShares US Core Bond ETF |
| USO | United States Oil Fund |
| DIA | SPDR Dow Jones Industrial Average ETF |
| DVY | iShares Dow Jones Select Dividend Index ETF |
| DX/Y | NYCE U.S.Dollar Index Spot |
| EFA | iShares MSCI EAFE ETF |
| FXE | Invesco CurrencyShares Euro Trust |
| GLD | SPDR Gold Trust |
| GSG | iShares S&P GSCI Commodity-Indexed Trust |
| HYG | iShares iBoxx $ High Yield Corporate Bond ETF |
| ICF | iShares Cohen & Steers Realty ETF |
| IEF | iShares Barclays 7-10 Yr. Tres. Bond ETF |
| LQD | iShares iBoxx $ Investment Grade Corp. Bond ETF |
| IJH | iShares S&P 400 MidCap Index Fund |
| ONEQ | Fidelity Nasdaq Composite Index Track |
| QQQ | Invesco QQQ Trust |
| RSP | Invesco S&P 500 Equal Weight ETF |
| IWM | iShares Russell 2000 Index ETF |
| SHY | iShares Barclays 1-3 Year Tres. Bond ETF |
| IJR | iShares S&P 600 SmallCap Index Fund |
| SPY | SPDR S&P 500 Index ETF Trust |
| TLT | iShares Barclays 20+ Year Treasury Bond ETF |
| GCC | WisdomTree Continuous Commodity Index Fund |
| VOOG | Vanguard S&P 500 Growth ETF |
| VOOV | Vanguard S&P 500 Value ETF |
| EEM | iShares MSCI Emerging Markets ETF |
| XLG | Invesco S&P 500 Top 50 ETF |
| Symbol | Company | Sector | Current Price | Action Price | Target | Stop | Notes |
|---|---|---|---|---|---|---|---|
| AKR | Acadia Realty Trust | Real Estate | $20.94 | 20 - 22 | 28 | 18 | 4 for 5'er, #6 of 154 in REAL sector matrix, one box from RS buy signal, 2.7% yield, Earnings 2/8 |
| FOE | Ferro Corp | Chemicals | $21.63 | high teens to low 20s | 35 | 16 | 4 for 5'er, 8 consec buy signals, pullback from recent high, pos trend, top of DWACHEM matrix |
| SC | Santander Consumer USA Holdings Inc. | Finance | $41.57 | high 30s to mid 40s | 57 | 34 | 5 for 5'er, top 10% of DWAFINA, 3 consec buy signals, all-time highs, 2.11% yield, Earnings 2/1 |
| ESI | Element Solutions Inc. | Chemicals | $23.91 | mid to upper 20s | 37 | 20 | 5 for 5'er, multi-year high, 6 consec buy signals, top of DWACHEM |
| UMC | United Microlectronics Corporation (Taiwan) ADR | Semiconductors | $11.21 | 11.50 - 12.50 | 19 | 10 | 4 for 5'er, top half of favored SEMI sector matrix, bullish catapult, 2.4% yield, R-R>3.0, pot. cov. write |
| SMPL | Simply Good Foods Co | Retailing | $36.67 | mid-to-upper $30s | 56 | 31 | 4 for 5'er top half of RETA sector matrix, bullish catapult, pullback from ATH |
| BRO | Brown & Brown, Inc. | Insurance | $64.63 | low to upper 60s | 77 | 55 | 5 for 5'er, pos trend since 2010, longterm market RS buy signal, one box from 4th consec buy signal Earnings 1/24 |
| SEE | Sealed Air Corporation | Business Products | $68.64 | low-to-mid 60s | 89 | 53 | 5 for 5'er, top 20% of BUSI sector matrix, multiple consec buy signals Earnings 2/7 |
| SWCH | Switch, Inc. Class A | Internet | $25.40 | 25 - 28 | 54.50 | 22 | 4 for 5'er #6 of 51 in INET sector matrix, spread triple top, R-R>5.0 |
| IR | Ingersoll-Rand Inc. | Machinery and Tools | $58.38 | mid 50s to low 60s | 74 | 49 | 5 for 5'er, pullback from ATH, 3 consecutive buy signals, pos monthly momentum |
| LYV | Live Nation Entertainment Inc. | Leisure | $113.28 | low 120s to mid 130s | 142 | 98 | 5 for 5'er, pullback from ATH, long-term market RS buy signal, 2 consecutive buy signals, pos month and weekly momentum |
| EQH | Equitable Holdings Inc | Insurance | $34.39 | mid to upper 30s | 47.5 | 27 | 4 for 5'er, pullback from ATH, 3 consec buy signals, pos weekly momentum flip, 2.2% yield |
| STE | STERIS PLC | Healthcare | $231.86 | hi 220s - low 240s | 316 | 200 | 4 for 5'er, top 25% of HEAL sector matrix, LT pos mkt RS, triple top breakout, Earn. 1/31 |
| LAMR | Lamar Advertising Company | Media | $109.48 | low 100s - low 120s | 158 | 97 | 5 for 5'er, top 25% of MEDI sector matrix, pullback from ATH, 3.4% yield. |
| TROX | Tronox Incorporated | Chemicals | $23.77 | mid 20s | 43.50 | 20 | 5 for 5'er, top 1/3 DWACHEM matrix, 3 weeks pos weekly mom, pullback from rally high, 1.65% yield |
| NSA | National Storage Affiliates | Real Estate | $62.37 | low 60s to low 70s | 91 | 51 | 5 for 5'er, top 10% DWAREAL matrix, pullback from ATH, 7 consec buy signals, 2.74% yield |
| SKT | Tanger Factory Outlet Centers | Real Estate | $18.30 | 19 - 21 | 34.50 | 15.50 | 5 for 5'er, top third of REAL sector matrix, |
| SSNC | SS&C Technologies Holdings, Inc. | Software | $81.84 | high 70s to mid 80s | 103 | 68 | 4 for 5'er, 3 consec buy signals @ all-time highs, top 25% DWASOFT, monthly mom flip, LT market RS buy signal |
| TTM | Tata Motors Limited (India) ADR | Autos and Parts | $34.30 | low-to-mid 30s | 68.50 | 28 | 5 for 5'er, 4th of 58 in AUTO sector matrix, one box from multi-year high, R-R>5.0 |
| CWK | Cushman & Wakefield Plc | Real Estate | $20.93 | low to mid 20s | 30.5 | 17.5 | 4 for 5'er, 6 consecutive buy signals, all-time highs, top 25% DWAREAL matrix, positive trend, pos mon mom |
| Symbol | Company | Sector | Current Price | Action Price | Target | Stop | Notes |
|---|
| Symbol | Company | Sector | Current Price | Action Price | Target | Stop | Notes |
|---|---|---|---|---|---|---|---|
| STOR | Store Capital Corp. | Real Estate | $31.93 | mid-to-upper 30s | 47.50 | 30 | See follow comment below. |
| SMCI | Super Micro Computer, Inc. | Computers | $42.15 | low 40s | 52 | 34 | See follow comment below. |
| Comment |
|---|
| STOR Store Capital Corp. R ($31.93) - Real Estate - STOR moved to a sell signal with yesterday's action. No new exposure here. We will maintain our $30 stop. |
| SMCI Super Micro Computer, Inc. R ($42.50) - Computers - SMCI moved to a sell signal today. No new exposure. We will maintain our $34 stop. |
CWK Cushman & Wakefield Plc R ($21.38) - Real Estate - CWK is a solid 4 for 5’er that ranks in the top quartile of the real estate sector stock matrix. The high-attribute stock has maintained a positive trend since November 2020 and trades on six consecutive buy signals. On December 23, 2021, CWK hit a new all-time high at $22 where it continues to trade today. Additionally, monthly momentum has been positive for two months, suggesting the potential for higher prices. Okay to add new exposure in the low to mid 20s. We will set our initial stop at $17.50, which would mark the first sell signal on the chart. We will use a modified bullish price objective of $30.50 as our near-term price target.
| 19 | 20 | 21 | |||||||||||||||||||||||||||||||||||||||||||||||||||
| 22.00 | X | 22.00 | |||||||||||||||||||||||||||||||||||||||||||||||||||
| 21.00 | • | • | X | 21.00 | |||||||||||||||||||||||||||||||||||||||||||||||||
| 20.00 | X | • | C | • | X | X | Mid | 20.00 | |||||||||||||||||||||||||||||||||||||||||||||
| 19.50 | 3 | X | X | O | • | B | O | • | B | O | X | C | 19.50 | ||||||||||||||||||||||||||||||||||||||||
| 19.00 | X | O | 4 | O | X | 7 | O | X | • | X | O | X | • | X | 8 | A | O | X | O | X | 19.00 | ||||||||||||||||||||||||||||||||
| 18.50 | • | X | O | X | O | X | O | 6 | 8 | X | O | X | 2 | 3 | O | • | X | O | X | O | X | O | X | O | X | 18.50 | |||||||||||||||||||||||||||
| 18.00 | • | X | O | X | 5 | X | O | X | O | X | O | X | O | X | O | • | X | O | X | O | X | O | • | O | • | 18.00 | |||||||||||||||||||||||||||
| 17.50 | 2 | O | O | O | X | O | 9 | A | X | O | X | O | • | X | X | 5 | 6 | X | O | X | • | • | 17.50 | ||||||||||||||||||||||||||||||
| 17.00 | X | X | O | • | O | X | O | • | O | X | O | • | X | X | O | X | O | 4 | 7 | X | 9 | • | 17.00 | ||||||||||||||||||||||||||||||
| 16.50 | X | O | X | • | • | O | X | • | O | X | O | • | X | O | X | O | X | O | X | O | X | • | 16.50 | ||||||||||||||||||||||||||||||
| 16.00 | X | O | X | • | O | • | O | O | • | C | O | 2 | O | X | O | X | O | • | Bot | 16.00 | |||||||||||||||||||||||||||||||||
| 15.50 | X | O | • | • | O | • | X | O | X | O | X | O | • | 15.50 | |||||||||||||||||||||||||||||||||||||||
| 15.00 | 1 | • | O | • | X | X | O | X | 3 | X | • | 15.00 | |||||||||||||||||||||||||||||||||||||||||
| 14.50 | X | • | O | • | • | X | O | X | O | X | O | • | 14.50 | ||||||||||||||||||||||||||||||||||||||||
| 14.00 | X | • | O | • | X | • | X | O | X | 1 | • | 14.00 | |||||||||||||||||||||||||||||||||||||||||
| 13.50 | • | O | X | X | O | • | X | O | X | • | 13.50 | ||||||||||||||||||||||||||||||||||||||||||
| 13.00 | O | X | O | X | O | X | • | • | • | X | O | • | 13.00 | ||||||||||||||||||||||||||||||||||||||||
| 12.50 | O | X | O | X | X | O | X | O | X | • | X | • | B | • | 12.50 | ||||||||||||||||||||||||||||||||||||||
| 12.00 | O | X | O | X | X | X | O | X | O | X | O | 9 | O | X | O | X | • | 12.00 | |||||||||||||||||||||||||||||||||||
| 11.50 | O | X | X | O | X | O | X | O | X | O | 6 | O | 7 | X | O | A | O | X | • | 11.50 | |||||||||||||||||||||||||||||||||
| 11.00 | O | X | O | X | 4 | X | O | X | O | X | 5 | X | O | X | O | X | O | • | 11.00 | ||||||||||||||||||||||||||||||||||
| 10.50 | O | X | O | X | O | X | O | O | O | X | O | • | O | X | • | 10.50 | |||||||||||||||||||||||||||||||||||||
| 10.00 | O | X | O | X | O | X | O | X | • | • | O | • | 10.00 | ||||||||||||||||||||||||||||||||||||||||
| 9.50 | O | X | O | O | X | O | X | • | • | 9.50 | |||||||||||||||||||||||||||||||||||||||||||
| 9.00 | O | X | O | O | • | 9.00 | |||||||||||||||||||||||||||||||||||||||||||||||
| 8.50 | O | X | • | 8.50 | |||||||||||||||||||||||||||||||||||||||||||||||||
| 8.00 | O | X | 8.00 | ||||||||||||||||||||||||||||||||||||||||||||||||||
| 7.50 | O | X | 7.50 | ||||||||||||||||||||||||||||||||||||||||||||||||||
| 7.00 | O | 7.00 | |||||||||||||||||||||||||||||||||||||||||||||||||||
| 19 | 20 | 21 |

| ABG Asbury Automotive Group Inc. ($159.49) - Retailing - ABG broke a triple bottom at 162 before moving lower to 160. ABG is a 2 for 5’er in the unfavored retailing sector that has additional support at 154. Avoid. Earnings are slated for 1/31. |
| ALRM Alarmcom Holdings ($74.42) - Business Products - ALRM fell Thursday to break a double bottom at $75. This 2 for 5'er moved to a negative trend in November and ranks in the bottom quartile of the unfavored business products sector RS matrix. Weekly momentum also just flipped negative, suggesting the potential for further downside from here. Long exposure should be avoided. Further support may be seen at $74, with initial overhead resistance seen at $82. |
| BC Brunswick Corporation ($89.80) - Leisure - BC broke a double bottom at 90, returning the chart to a sell signal and an overall negative trend. BC is now demoted to a weak 2 for 5’er. Avoid as supply is in control and the trend is negative. Earnings are slated for 1/27. |
| CEVA Ceva, Inc. ($36.77) - Semiconductors - CEVA fell Thursday to complete a bearish catapult with a double bottom break at $37. This 0 for 5'er moved to a negative trend last May and ranks in the lower quintile of the unfavored semiconductors sector RS matrix. The overall technical picture is negative here and continues to weaken. Avoid long exposure. Initial overhead resistance may be found at $42. Note that earnings are expected on 2/15. |
| CNMD Conmed Corporation ($127.77) - Healthcare - CNMD shares moved lower today to break a double bottom at $132 and violated its bullish support line. This 4 for 5'er moved to a negative trend today but has been on an RS buy signal versus the market since 2018. CNMD is trading in oversold territory with a weekly overbought/oversold reading of -44%. From here, support is offered at $122. |
| OXM Oxford Industries Inc ($89.93) - Textiles/Apparel - OXM broke a double bottom at 91 before moving lower to 90. This move flips the trend negative and downticks the stock to a 2 for 5’er. Avoid. |
| PLCE Childrens Place Inc. ($66.97) - Retailing - PLCE broke a double bottom at 67, marking the stock’s second consecutive sell signal. PLCE is a weak 1 for 5’er in the unfavored retailing sector. Avoid as supply is in control. |
| RGLD Royal Gold Inc ($104.73) - Precious Metals - RGLD gave a second consecutive buy signal and returned a positive trend on its default chart when it broke a double top at $106. While Thursday's move is positive, the overall technical picture for RGLD remains negative as even with positive trend change it remains an unfavorable 2 for 5'er and ranks in the bottom half of the precious metals sector matrix. From here, the nearest support sits at $98. RGLD is expected to report earnings on 2/16. |
| SEE Sealed Air Corporation ($68.27) - Business Products - SEE broke a double top at $69 to complete a bullish catapult and count for a ninth consecutive buy signal on the chart. The stock is a 5 for 5'er that ranks in the top decile of the Business Products sector matrix. Okay to consider here on the breakout. Support lies at $65, $63, and $61. |
| TTC The Toro Company ($94.78) - Machinery and Tools - TTC broke a double bottom at $96 to complete a bearish triangle as it fell to $95 on the chart, violating the bullish support line. TTC will become a 2 for 5'er in a negative trend. Holders may seek to trim on the breakdown here. Support lies in the $93 to $94 range. |
| VFC V.F. Corporation ($67.42) - Textiles/Apparel - VFC is a 0 for 5’er in the textiles/apparel sector that broke a double bottom at 67, marking the stock’s second consecutive sell signal. Supply is in control. Avoid. Earnings are slated for 1/28. |
| ZBRA Zebra Technologies Corp ($503.18) - Electronics - Shares of ZBRA broke a double bottom at $512 on Thursday, resulting in a third consecutive sell signal. The stock maintains its 5 for 5 technical attribute rating yet its placement in the electronics stock sector matrix has weakened and shares are quickly approaching key support between $456 and $496. Those already long may continue to hold here or trim into rallies if needed given the stock is near the bottom of its ten-week trading band. Demand would reenter the picture with a breakout at $552 but note material resistance sits ahead around $608. Earnings are expected on 2/10. |
| Name | Option Symbol | Action | Stop Loss |
|---|---|---|---|
| Stag Industrial Inc - $42.22 | STAG2217F40 | Buy the June 40.00 calls at 3.60 | 39.00 |
| Name | Option | Action |
|---|---|---|
| QUALCOMM Incorporated ( QCOM) | Mar. 185.00 Calls | Stopped at 170.00 (CP: 170.22) |
| Name | Option Symbol | Action | Stop Loss |
|---|---|---|---|
| eBay Inc. - $61.13 | EBAY2217R62.5 | Buy the June 62.50 puts at 6.50 | 68.00 |
| Name | Option | Action |
|---|---|---|
| Salesforce.com, Inc. (CRM) | May. 240.00 Puts | Raise the option stop loss to 24.60 (CP: 26.60) |
| Paypal Holdings Inc (PYPL) | May. 190.00 Puts | Raise the option stop loss to 23.05 (CP: 25.05) |
| Name | Option Sym. | Call to Sell | Call Price | Investment for 500 Shares | Annual Called Rtn. | Annual Static Rtn. | Downside Protection |
|---|---|---|---|---|---|---|---|
| Live Nation Entertainment Inc. $113.28 | LYV2215G120 | Jul. 120.00 | 10.20 | $52,354.35 | 28.03% | 17.75% | 7.88% |
| Name | Action |
|---|---|
| EQT Corporation (EQT) - 22.20 | Sell the March 23.00 Calls. |
| Alcoa Inc. (AA) - 59.63 | Sell the March 65.00 Calls. |
| Macy's Inc. (M) - 25.27 | Sell the May 28.00 Calls. |
| Continental Resources Inc. (CLR) - 51.84 | Sell the June 55.00 Calls. |
| Commercial Metals Corporation (CMC) - 36.55 | Sell the June 40.00 Calls. |
| Halliburton Company (HAL) - 28.38 | Sell the June 30.00 Calls. |
| Marathon Oil Corporation (MRO) - 19.10 | Sell the July 20.00 Calls. |
| Name | Covered Write |
|---|---|
| Suncor Inc ( SU - 28.38 ) | June 29.00 covered write. |
Daily Equity & Market Analysis
Loading, Please Wait...
