
We examine how market capitalization and relative valuations have affected performance of stocks on the Nasdaq 100 over the short-term.
As we discussed in last Friday’s “Were You Aware?” approximately 40% of the stocks in the Nasdaq Composite (NASD) have pulled back 50% from their 52-week highs. Of course, the index itself has not declined nearly that much – at Monday’s intraday low, around 14,540, NASD was about 10% off of its 52-week high. One of the reasons that the index has held up better than many of its constituents in due do to cap-weighting and that many of the worst performers have been small cap stocks.
However, the performance dispersion hasn’t been just a question of large cap vs. small cap. Even within the Nasdaq-100 (NDX), which is made up entirely of large cap stocks as it is composed of 100 of the largest stocks on the Nasdaq, there has been a bias towards the largest companies. Over the trailing 60 days (through 1/10) the cap-weighted Invesco QQQ Trust (QQQ), which tracks the Nasdaq 100, is down -2.68%, while its equal-weighted counterpart the Direxion Nasdaq-100 Equal Weight ETF (QQQE) is down -8.54%, a difference of nearly 6%.
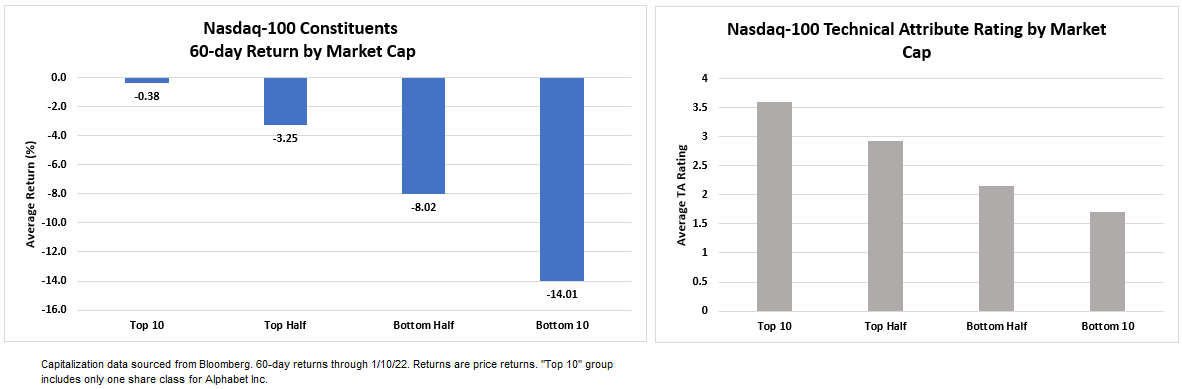
The image below shows the 60-day returns of Nasdaq-100 stocks by market cap. We can see that there is a clear performance bias favoring the largest stocks in the index. The 10 largest stocks are down -0.38% on average over the period while the 10 smallest stocks are down -14%. Meanwhile, the top half of stocks by market cap have outperformed the bottom half by nearly 5%. There is a similar relationship between market cap and technical attribute rating. The 10 largest stocks by market cap have the highest average technical attribute rating, while the smallest 10 have the lowest.
There has been an even more pronounced relationship between recent performance and earnings. Stocks with lower price-to-earnings (PE) ratios have outperformed those with high PE ratios or negative earnings. The chart below groups the stocks in the Nasdaq-100 by PE.
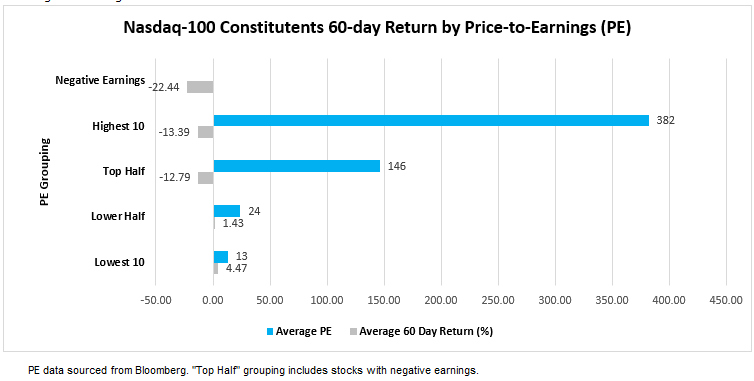
The 10 lowest-PE NDX stocks, which have an average PE ratio of 13, have gained an average of 4.47% over the last two months while the 10 highest-PE stocks, with an average PE ratio of 382, are down more than 13% over the same period.
Stocks with negative earnings, have fared even worse. There are 14 stocks in the Nasdaq-100 that fall into the negative earnings group, including names like Airbnb (ABNB), Peloton (PTON), ZScaler (ZS), and DocuSign (DOCU). The stocks in the negative earnings camp have returned -22.44% on average over the last two months and have an average technical attribute rating of 2.1. The stocks with negative earnings have been included in the “Top Half” group in the chart because PE measures how expensive a firm’s stock is relative to the earnings it generates, and while stocks with negative earnings don’t technically have PE ratios, in terms of earnings, they are more expensive than even the highest PE stocks.
One of the factors that has been cited as contributing to the large declines of Nasdaq stocks, specifically tech stocks, is concerns about rising rates and valuations. There is nothing inherent in tech stocks that should make them especially sensitive to interest rates, however, what many of these stocks have in common is high valuations relative to their earnings, i.e., high PE ratios or negative earnings. In a discounted cash flow valuation, an especially large part of the value of such stocks is often attributable to their terminal value, i.e., the stock’s value beyond a set forecast period, often 5 – 10 years. Terminal value is usually very sensitive to changes in the rate used to discount the cash flows, which is typically based on Treasury yields. So, all else being equal, when interest rates go up, discount rates go up and stock valuations go down, with the effect being especially pronounced in stocks with low current earnings and large terminal values.
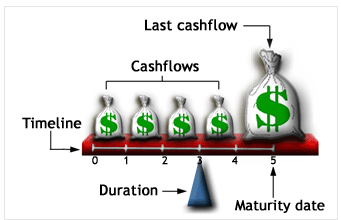
The concept is very similar to duration, which measures a bond’s sensitivity to interest rates. If you have two 10-year bonds, one with a 5% coupon rate and one with a zero coupon (where all interest is paid at maturity), the zero-coupon bond will always have a higher duration, i.e. sensitivity to interest rates - the image below is a good illustration. The fulcrum at the bottom represents duration, if we removed all small cash flows, leaving only one large cash flow at the end, the fulcrum (duration/interest rate sensitivity) would have to increase (move to the right) to maintain balance. It’s essentially the same with stocks, names with high earnings have more/larger cash flows earlier on the timeline, while stocks with high PEs or negative earnings have much or all of their value at the end and.
All of this to say, there is nothing about technology stocks or stocks in the Nasdaq that make them innately more sensitive to rising interest rates. Relative to other sectors, there are a lot of tech stocks with low/zero/negative earnings and much of their value based on expectations for future growth, and as we’ve seen, concerns about valuations have hit these stocks especially hard. Instead of simply reducing exposure to one sector, investors who are concerned that rates may continue to rise and potentially further erode valuations may want to look at their portfolios using relative valuation metrics (like PE) to get an understanding of their exposure from this perspective.
However, we would also caution against simply eliminating high PE and/or negative earnings names without utilizing a technical screen. Some stocks with negative earnings like Palo Alto Networks (PANW) and Marvell Technology Inc (MRVL), have held up quite well and both currently have perfect 5 for 5 TA ratings.
