
In yesterday’s (1/19) trading, the iShares Russell 2000 ETF (IWM) broke a spread quintuple bottom when it hit $205, taking out support that had held since March of last year. The fund now sits at roughly the same level it did in early January 2021, about 15% off the all-time high it reached in November of last year. With the violation of major support yesterday and IWM now trading in correction territory, today we wanted to take a deeper look to see which areas of small caps have held up the best and which have been particularly weak.
In yesterday’s (1/19) trading, the iShares Russell 2000 ETF (IWM) broke a spread quintuple bottom when it hit $205, taking out support that had held since March of last year. The fund now sits at roughly the same level it did in early January 2021, about 15% off the all-time high it reached in November of last year.
With the violation of major support yesterday and IWM now trading in correction territory, today we wanted to take a deeper look to see which areas of small caps have held up the best and which have been particularly weak.
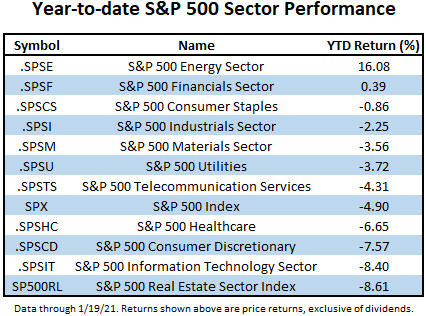
In the large cap space, energy has been by far the best performing sector in the S&P 500, up just over 16% year-to-date. Energy is followed by financials, which has gained 0.39% and is the only other S&P 500 sector in the green this year. On the other end of the spectrum, real estate has been the worst-performing sector in the S&P this year, down more than -8.5%. Real estate is followed closely by technology, which has shed -8.4% in 2022 as the sector has been hampered by concerns about rising rates and stretched valuations as we discussed last week.
Looking at the year-to-date sector attribution for IWM, we see a similar picture of leadership. As in large cap, energy is by far the best performing small cap sector, with a total return north of 10.5%, it is also the only sector that shows positive YTD performance. Like in large caps, financials has been the second-best performing small cap sector in 2022. However, while real estate has been the worst performer in the S&P 500, healthcare has been the biggest laggard in small caps, unfortunately, it is also has the largest weight within IWM at over 17%. Meanwhile, technology has been the second-worst performing sector in IWM, as was its S&P 500 counterpart.
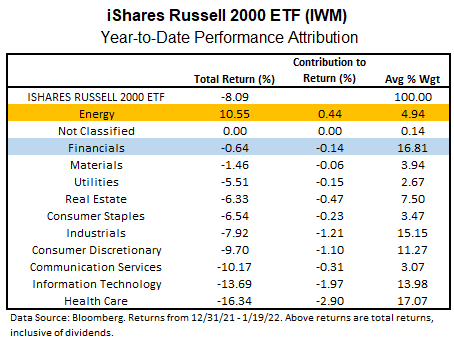
In last week’s piece about tech valuations, we also mentioned the recent bias towards large cap stocks outperforming small caps within the Nasdaq (NASD). Based on the year-to-date numbers, we can see that this bias has not been limited to Nasdaq or technology stocks. Looking only at the headline numbers, it is apparent large caps have a clear advantage as IWM has posted a year-to-date total return of -8.09% (through 1/19), while the S&P 500 Total Return Index (TR.SPXX) is down -4.84%. The bias towards large caps also carries through to the sector level in almost every instance. Out of the 11 macro sectors, there are only two instances – basic materials and real estate – where a sector within IWM has outperformed its S&P 500 counterpart. The largest differential coming in the health care sector, where small caps have lost -16.34%, while the S&P 500 Healthcare Sector Index (.SPHC) is down -6.65%, it is also worth noting that the performance numbers for the small sectors in the IWM attribution are based on total return, while the S&P 500 sector returns are price return, which gives an advantage to the small cap sectors to the extent that any dividends have been paid this year.
Beyond mere performance numbers, we can also see the bias toward large caps is reflected in the fund scores for the individual sector funds in both size groups. The table below displays the Select SPDR Sector funds, representing the S&P 500 sectors next to their small cap counterparts, represented by the Invesco S&P Small Cap Sector funds.
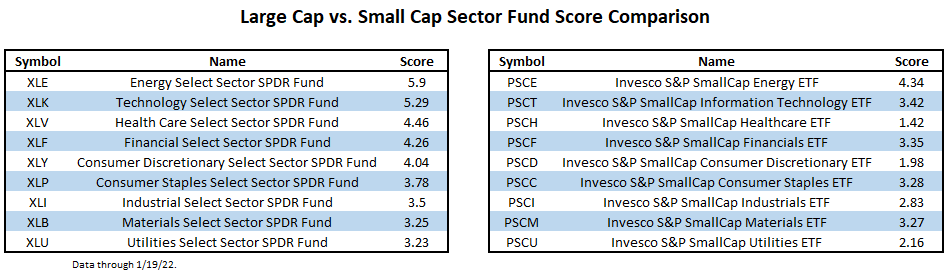
In eight of nine sectors (real estate and communication services have been excluded due the absence of representative small cap funds), the large cap representative has a superior fund score reading; the lone exception is the materials sector where the small cap materials ETF (PSCM) has a slightly higher score than its large cap counterpart, (XLB), 3.27 vs. 3.25. It is also worth noting that the lowest-scoring small cap fund is the healthcare representative (PSCH); the sector that has the highest weighting in IWM and is also the worst performer year-to-date. The Invesco small cap funds are based on S&P small cap sector indexes, while IWM is based on the Russell 2000, so there are undoubtedly some differences in the composition of these ETFs versus the sectors within IWM, however, in both instances there as an observable bias towards large caps.
Overall, there does not appear to be a significant difference in sector leadership between large and small cap. Year-to-date, the energy and financial sectors have posted the best performance within their respective size categories and the energy sector funds have the strongest fund scores within both groups.
However, in the current environment there does appear to be a clear bias toward large caps almost across the board as was reflected in both the year-to-date performance numbers and the scores of the individual sector funds.
The sector allocation of the Russell 2000, and by extension, IWM, also appears to be a significant headwind currently. Its largest sector by weight, health care, has been the worst performing small cap sector year-to-date and the healthcare sector ETF has the weakest fund score reading among the small cap sector fund lineup. Consumer discretionary, which has the second-weakest score posting in the small cap ETF family, also has a relatively large weighting within IWM – 11.27% on average in 2022.
Investors may do well to utilize an alternative weighting scheme for their small cap exposure that emphasizes areas of strength, while significantly underweighting or avoiding some of the weakest areas within the space, which happen to also have some of the largest weightings in the Russell 2000 index.
