The Nasdaq Composite is off to its third worst start to a calendar year using data beginning in 1977. Today, we look to see if this signaled anything about the rest of the year ahead.
Beginners Series Webinar: Join us on Friday, January 21st, at 2 PM (ET) for our NDW Beginners Series Webinar. This week's topic is Using the Dashboard & Account Preferences. Register Here
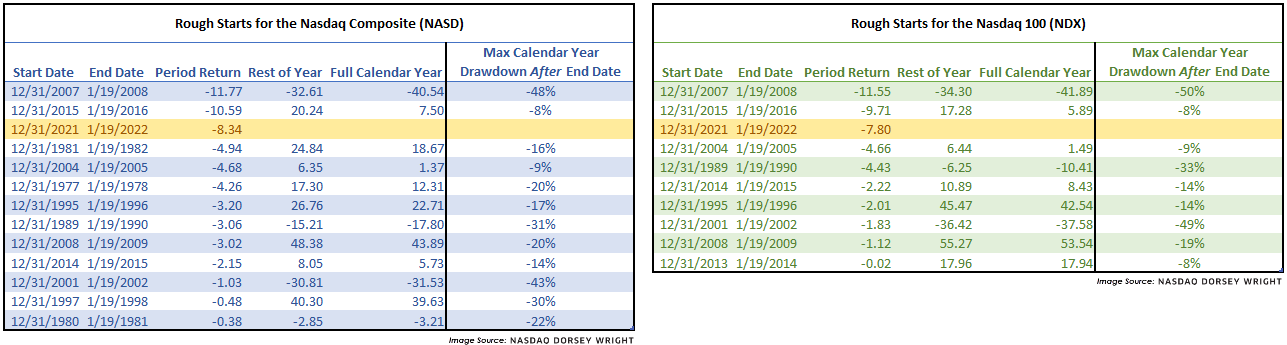
The Nasdaq Composite (NASD) is down over 8% year-to-date (through 1/19), which marks its third-worst start to a calendar year with data going back to 1977. The last time we saw a worse start to the year was in 2016 when the index was already off over 10% at this point. The Nasdaq 100 (NDX) is also under pressure, marking its third-worst start to a year since 2016 with a loss of 7.8%.
It is rare to see these indices treading underwater at this point in the year; in fact, over the past 45 years (including 2022) the Nasdaq Composite has only experienced this 13 times or said differently, the index has been positive by January 19th 70% of the time (there is nothing special about January 19th other than it is the most recent day of market action used in our lookback period). Apart from a couple of notable outliers, we see markets finish the year in the positive territory about 2/3rds of the time. However, we also tend to see elevated volatility persist – evidenced by the fact most drawdowns intensified.
Although many Nasdaq Composite/NDX-related areas of the market are trading near washed-out territory, based on this small data set we could reasonably expect to see further buying opportunities. The current environment could be likened to the metaphor of catching a falling knife, which we try to avoid. So, remain patient, keep a close watch on bullish percent charts in oversold field position, and wait for demand to reenter the picture with Point & Figure buy signals on individual trend charts.