Most Requested Symbols

We examine the Santa Claus Rally - the historical tendency for the equity market to produce positive returns in the final days of the year through the first two trading sessions of the new year.
The average distribution reading is -8.19% oversold.
Today's featured stock is Eaton Corporation (ETN)
AJG, AZO, CARS, CMA, CMCSA, CSL, FANG, GMS, MCD, MPC, MRVL, MTN, MTSI, NOW, PXD, RS, SKY and TER
Call: KLA Corp (KLAC); Put: First Solar (FSLR); Covered Write: Ford (F)
Year-End Review Webinar with RIA Database: With inflation concerns impacting many facets of the US markets in 2021, we will address how leadership trends across major asset classes and US equity sectors have adapted to these pressures in an upcoming webinar with RIA Database. The discussion will take place on December 8th at 2pm ET and is approved for one hour of CFP®, CFA® & CIMA®, CIMC® or CPWA® CE Credit for webcast attendees. Click Here to Register.
Our long-term relative strength rankings through DALI have had quite a few shakeups over the past two weeks. Last Friday, we discussed the shifts that had transpired within the fixed income rankings in DALI as Convertibles & Preferreds continue to lose signals while Long Duration U.S. Treasuries continue to gain. The size and style rankings have also had notable changes occur since the close on November 26th. While the top two ranking size and style groups, Small-Cap Growth and Mid-Cap Growth, continue to reside at the top, they have lost 5 and 3 buy signals, respectively. Probably the most noteworthy change to the rankings is Small-Cap Blend falling from the 3rd rank to 6th and losing 5 buy signals since November 26th. The size and style group that has gained the most signals over this time is Large-Cap Growth, up 7 buy signals. As of the close on the 6th, Large-Cap Growth is the highest-ranking size and style group within the Asset Class Group Scores page with an average group score of 3.90.
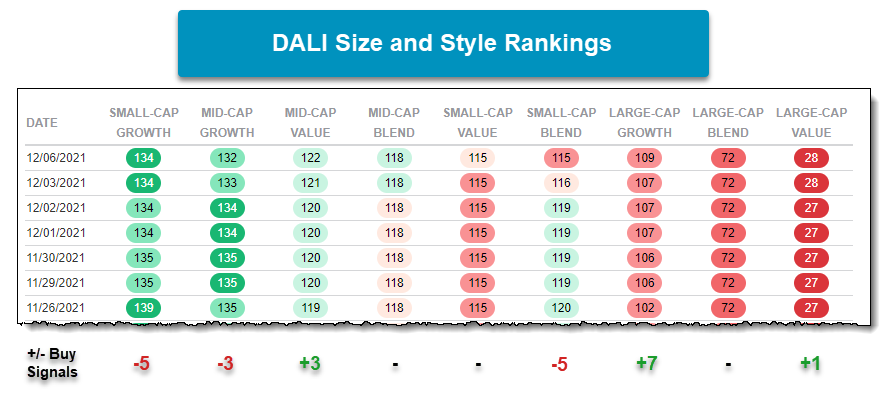
Below we have a couple of proxies as representatives for the Small Cap Blend and Large Cap Growth areas of the size and style rankings.
First, we have the chart of the First Trust Small Cap Core AlphaDEX Fund FYX. The fund still maintains a high fund score of 4.64, but the chart returned to a sell signal by breaking a double bottom at $93 on 11/30. This followed the chart rallying to a new all-time high earlier in November at $100. Ultimately, FYX fell to $92, its lowest level since September of this year, before reversing back into a column of X’s at $95 with action on December 6th. The recent action has led FYX to move back within the trading range of $86 to $97 that it spent roughly 8 months of this year within prior to breaking to a new all-time high in early November.
On the chart of the First Trust Large Cap Growth AlphaDEX Fund FTC, the fund still maintains a buy signal following its third consecutive breakout at $120. FTC rallied up to a new all-time high at $124 before reversing down last week at $118 and falling to $116 on the chart. FTC maintains a fund score of 5.13, speaking to the fund’s resilience.
As can be seen from both charts, each fund has pulled back along with the broader market. But both pictures shed light on the broader size and style groups themselves as Small Cap Blend has pulled back to its prior trading range and Large Cap Growth has maintained its strong trending picture. On a relative basis, this has led to Large Cap Growth to gain signals while Small Cap Blend has lost signals in recent weeks.


The Santa Claus Rally refers to a historical tendency toward positive equity returns during the last week of the year as well as the first couple days in the New Year. The time period encompasses the last five trading days of the year and the first two trading days of the New Year, so seven trading days in all. As we touched on in yesterday's report, markets have historically seen outsized returns in the second half of December, but this is especially true when examining only the seven-day trading period after Mr. Kringle visits all the children lucky enough to make the "nice" list.
A number of theories have been offered to explain the Santa Rally including tax positioning, a general sense of happiness and optimism on Wall Street, and that many large institutional investors wrap up most of their business before the holidays to go on vacation, leaving most of the trading to retail investors who tend to be more optimistic.
The chart below shows the S&P 500 (SPX) Santa Claus Rally returns from 1957 through 2020, depicted from strongest to weakest.
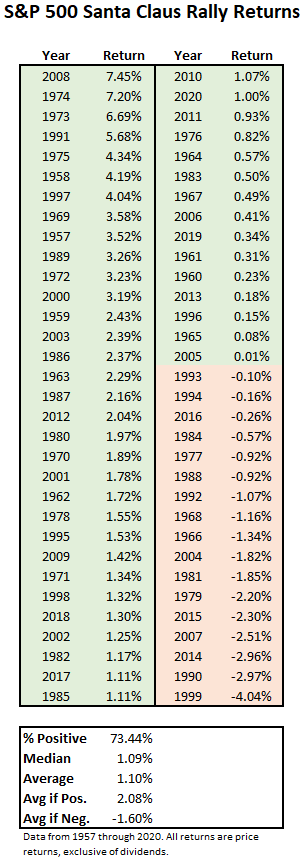
Whatever, the reason behind the tendency, the S&P (SPX) has posted an average gain of 1.10% during this period (from 1957 through 2020), which is not bad for a one-week return. Not only has the Santa Rally produced relatively strong 7-trading day returns, but it has also shown an impressive batting average – since 1957 the S&P has posted a gain during the period 73% of the time. During the years in which the Santa Claus rally produced a gain, the average improvement was 2.08%. The best Santa Clause rally came in 2008 as the SPX saw a gain of 7.45%. On the other hand, during the years that the Santa Claus Rally brought coal, the average loss was -1.6%, the worst performance coming in 1999 when the SPX posted a return of -4.04%. Last year, the S&P was near its historical average, producing a 1% gain during the Santa Rally.
The other major US benchmarks have had similar returns. Since 1972, the Nasdaq (NASD) has had an average Santa Rally gain of 1.5%, producing positive returns 71% of the time. Meanwhile, since 1900, the Dow (DJIA) has also gained a 1.5% on average, with 74% of the returns being positive.
Of course, 2021 has already been a very strong year for US equities. SPX, DJIA, and NASD are up 22.25%, 15.10%, and 18.13% year-to-date, respectively (through 12/6), so does that change the calculus at all? Should we expect a weaker Santa Rally given the run-up the market has already had this year? As it turns out, based on the historical trend, the answer is no.
The chart below plots the returns from past Santa Rallies for all three indexes, it also shows the average returns for all years and the returns for just the years when that index was up 10% or more.
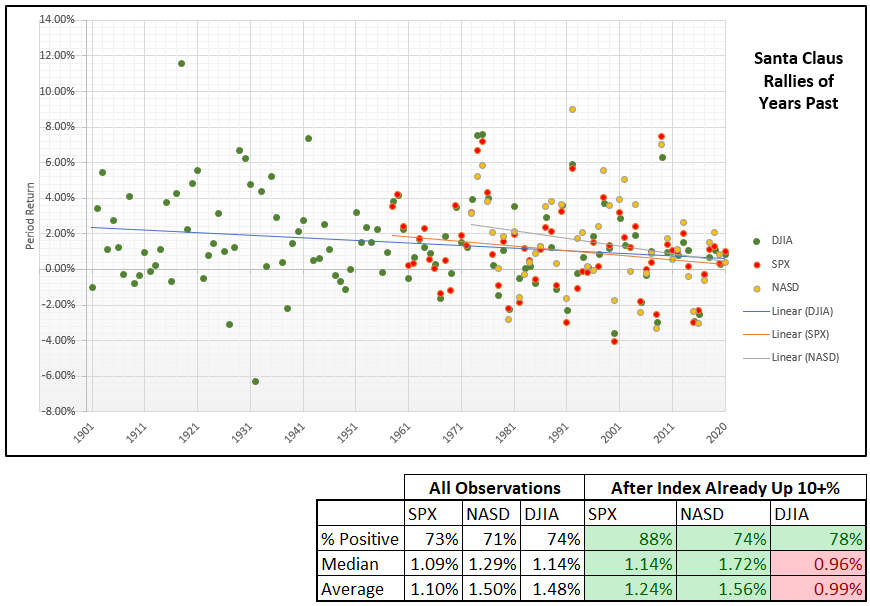
As you can see, the proportion of positive Santa Rallies for each index is higher in years with double-digit gains than across all years. Meanwhile, both the S&P and the Nasdaq show higher average gains during the Santa Rallies in years when they were already up 10% or more. The Dow is the only one of the three that shows a lower average Santa Rally gain in years where it has already risen 10%, but, it still shows a positive gain of just under 1%.
However, one point that runs contrary to the historical bias of the Santa Rally is the negative slope of the trend line seen on the chart, meaning that we have seen the magnitude of the Santa Claus Rally decrease over time.
Of course, there is no way to know for certain what this year has in store, whether the last week of the year will usher in another rally or if Santa will be leaving behind a lump of coal, but based on the historical data, we wouldn’t wager on the market petering out in the last few sessions of the year.
Average Level
-8.19
| AGG | iShares US Core Bond ETF |
| USO | United States Oil Fund |
| DIA | SPDR Dow Jones Industrial Average ETF |
| DVY | iShares Dow Jones Select Dividend Index ETF |
| DX/Y | NYCE U.S.Dollar Index Spot |
| EFA | iShares MSCI EAFE ETF |
| FXE | Invesco CurrencyShares Euro Trust |
| GLD | SPDR Gold Trust |
| GSG | iShares S&P GSCI Commodity-Indexed Trust |
| HYG | iShares iBoxx $ High Yield Corporate Bond ETF |
| ICF | iShares Cohen & Steers Realty ETF |
| IEF | iShares Barclays 7-10 Yr. Tres. Bond ETF |
| LQD | iShares iBoxx $ Investment Grade Corp. Bond ETF |
| IJH | iShares S&P 400 MidCap Index Fund |
| ONEQ | Fidelity Nasdaq Composite Index Track |
| QQQ | Invesco QQQ Trust |
| RSP | Invesco S&P 500 Equal Weight ETF |
| IWM | iShares Russell 2000 Index ETF |
| SHY | iShares Barclays 1-3 Year Tres. Bond ETF |
| IJR | iShares S&P 600 SmallCap Index Fund |
| SPY | SPDR S&P 500 Index ETF Trust |
| TLT | iShares Barclays 20+ Year Treasury Bond ETF |
| GCC | WisdomTree Continuous Commodity Index Fund |
| VOOG | Vanguard S&P 500 Growth ETF |
| VOOV | Vanguard S&P 500 Value ETF |
| EEM | iShares MSCI Emerging Markets ETF |
| XLG | Invesco S&P 500 Top 50 ETF |

| Symbol | Company | Sector | Current Price | Action Price | Target | Stop | Notes |
|---|---|---|---|---|---|---|---|
| AKR | Acadia Realty Trust | Real Estate | $21.85 | 20 - 22 | 28 | 18 | 4 for 5'er, #6 of 154 in REAL sector matrix, one box from RS buy signal, 2.7% yield, |
| STOR | Store Capital Corp. | Real Estate | $33.90 | mid-to-upper 30s | 47.50 | 30 | 5 for 5'er, multiple buy signals, one box from 52-week high, 4.1% yield, R-R>2.0 |
| FOE | Ferro Corp | Chemicals | $21.57 | high teens to low 20s | 35 | 16 | 4 for 5'er, 8 consec buy signals, pullback from recent high, pos trend, top of DWACHEM matrix |
| SC | Santander Consumer USA Holdings Inc. | Finance | $42.03 | high 30s to mid 40s | 57 | 34 | 5 for 5'er, top 10% of DWAFINA, 3 consec buy signals, all-time highs, 2.11% yield, |
| KR | The Kroger Co. | Retailing | $45.11 | hi 30s - low 40s | 50 | 35 | 4 for 5'er, #7 of 97 in RETA sector matrix, multiple buy signals, pullback from ATH, 18% yield |
| NEE | NextEra Energy, Inc. | Utilities/Electricity | $89.15 | low to high 80s | 102 | 68 | 4 for 5'er, 1 box from all-time high, 3 consec buy signals, LT market RS buy signal, pos trend, monthly & weekly momentum |
| GSL | Global Ship Lease Inc. | Transports/Non Air | $22.57 | mid to upper 20s | 40 | 20 | 5 for 5'er, top 10% DWATRAN, 3 consec buy signals, rally highs, 1box from 4th buy signal, 4.34% yield |
| LH | Laboratory Corp. of America Holdings | Healthcare | $289.26 | 280s - low 300s | 336 | 256 | 5 for 5'er, top half of HEAL sector matrix, LT pos mkt RS, pos wkly mom flip |
| ABT | Abbott Laboratories | Drugs | $132.47 | low 120s - low 130s | 174 | 104 | 4 for 5'er, top half of DRUG sector matrix, LT pos mkt RS, spread triple top, pos monthly mom flip, 1.4% yield |
| ESI | Element Solutions Inc. | Chemicals | $23.10 | mid to upper 20s | 37 | 20 | 5 for 5'er, multi-year high, 6 consec buy signals, top of DWACHEM |
| BAM | Brookfield Asset Management | Finance | $57.29 | mid to hi 50s | 70 | 47 | 5 for 5'er, top 20% of FINA sector matrix, LT pos mkt RS, multiple consecutive buy signals |
| BJ | BJ's Wholesale Club Holdings Inc | Retailing | $68.29 | mid-to-upper 60s | 78 | 56 | 4 for 5'er, #10 of 91 in RETA sector matrix, multiple consec buys, pullback from ATH |
| SMCI | Super Micro Computer, Inc. | Computers | $42.70 | low 40s | 52 | 34 | 4 for 5'er, top 20% of COMP sector matrix, multiple buy signals, pullback from ATH |
| TGT | Target Corporation | Retailing | $242.97 | 240s - 260s | 31 | 200 | 5 for 5'er, top half of RETA sector matrix, LT pos mkt RS, multiple consec buy signals, pull back from ATH, 1.5% yield. |
| UMC | United Microlectronics Corporation (Taiwan) ADR | Semiconductors | $12.04 | 11.50 - 12.50 | 19 | 10 | 4 for 5'er, top half of favored SEMI sector matrix, bullish catapult, 2.4% yield, R-R>3.0, pot. cov. write |
| ETN | Eaton Corporation | Machinery and Tools | $169.83 | mid 160s to high 170s | 184 | 138 | 4 for 5'er, one box from 4th consec buy signal, LT market RS buy signal, pos trend, 4 weeks pos momentum, 1.83% yield |
| Symbol | Company | Sector | Current Price | Action Price | Target | Stop | Notes |
|---|---|---|---|---|---|---|---|
| LUV | Southwest Airlines Co. | Aerospace Airline | $45.56 | mid 40s | 37 | 53 | 1 for 5'er, consec sell signals, negative trend, low in the unfavored DWAAERO matrix |
| GKOS | Glaukos Corp. | Healthcare | $41.45 | mid 40s | 34 | 50 | 1 for 5'er, market RS in Os this week, consec sell signals, bottom of DWAHEAL, controlled by supply |
| Comment | |||||||
|---|---|---|---|---|---|---|---|
|
|
|||||||
ETN Eaton Corporation R ($173.47) - Machinery and Tools - ETN is a solid 4 for 5’er within the machinery and tools sector stock matrix that has maintained a market RS buy signal since March 2020, confirming its long-term strength versus the broader market. ETN has given three consecutive buy signals and with today’s move to $174, sits one box from giving a fourth consecutive buy signal at $176. Overall, demand is in control and the technical outlook is bullish. Okay to add new exposure in the mid 160s to high 170s. We will set our initial stop at $138, which would violate multiple levels of support on the chart. We will use ETN’s bullish price objective of $184 as our near-term price target. Note ETN yields 1.83%.
| 21 | |||||||||||||||||||||||||||||||||||||||||||||||||||||
| 174.00 | X | x | 174.00 | ||||||||||||||||||||||||||||||||||||||||||||||||||
| 172.00 | X | O | x | 172.00 | |||||||||||||||||||||||||||||||||||||||||||||||||
| 170.00 | X | X | O | X | 170.00 | ||||||||||||||||||||||||||||||||||||||||||||||||
| 168.00 | X | O | X | O | C | 168.00 | |||||||||||||||||||||||||||||||||||||||||||||||
| 166.00 | X | O | B | O | X | 166.00 | |||||||||||||||||||||||||||||||||||||||||||||||
| 164.00 | X | 9 | X | O | X | 164.00 | |||||||||||||||||||||||||||||||||||||||||||||||
| 162.00 | X | O | X | O | Mid | 162.00 | |||||||||||||||||||||||||||||||||||||||||||||||
| 160.00 | 8 | O | X | 160.00 | |||||||||||||||||||||||||||||||||||||||||||||||||
| 158.00 | X | O | X | 158.00 | |||||||||||||||||||||||||||||||||||||||||||||||||
| 156.00 | X | O | X | 156.00 | |||||||||||||||||||||||||||||||||||||||||||||||||
| 154.00 | X | X | O | X | 154.00 | ||||||||||||||||||||||||||||||||||||||||||||||||
| 152.00 | X | O | X | O | X | 152.00 | |||||||||||||||||||||||||||||||||||||||||||||||
| 150.00 | 7 | O | X | O | X | 150.00 | |||||||||||||||||||||||||||||||||||||||||||||||
| 148.00 | X | 6 | X | O | A | 148.00 | |||||||||||||||||||||||||||||||||||||||||||||||
| 146.00 | 5 | O | X | O | X | 146.00 | |||||||||||||||||||||||||||||||||||||||||||||||
| 144.00 | X | O | X | O | X | Bot | 144.00 | ||||||||||||||||||||||||||||||||||||||||||||||
| 142.00 | 4 | O | O | X | 142.00 | ||||||||||||||||||||||||||||||||||||||||||||||||
| 140.00 | X | X | O | 140.00 | |||||||||||||||||||||||||||||||||||||||||||||||||
| 138.00 | X | X | O | X | 138.00 | ||||||||||||||||||||||||||||||||||||||||||||||||
| 136.00 | X | O | X | O | X | 136.00 | |||||||||||||||||||||||||||||||||||||||||||||||
| 134.00 | 3 | O | X | O | X | 134.00 | |||||||||||||||||||||||||||||||||||||||||||||||
| 132.00 | X | O | O | 132.00 | |||||||||||||||||||||||||||||||||||||||||||||||||
| 130.00 | X | X | 130.00 | ||||||||||||||||||||||||||||||||||||||||||||||||||
| 128.00 | X | O | X | 128.00 | |||||||||||||||||||||||||||||||||||||||||||||||||
| 126.00 | X | O | X | 126.00 | |||||||||||||||||||||||||||||||||||||||||||||||||
| 124.00 | X | O | X | 124.00 | |||||||||||||||||||||||||||||||||||||||||||||||||
| 122.00 | X | 1 | O | 2 | 122.00 | ||||||||||||||||||||||||||||||||||||||||||||||||
| 120.00 | X | O | X | O | X | 120.00 | |||||||||||||||||||||||||||||||||||||||||||||||
| 118.00 | X | O | X | O | X | 118.00 | |||||||||||||||||||||||||||||||||||||||||||||||
| 116.00 | X | C | X | O | 116.00 | ||||||||||||||||||||||||||||||||||||||||||||||||
| 114.00 | X | O | 114.00 | ||||||||||||||||||||||||||||||||||||||||||||||||||
| 112.00 | X | 112.00 | |||||||||||||||||||||||||||||||||||||||||||||||||||
| 110.00 | X | X | 110.00 | ||||||||||||||||||||||||||||||||||||||||||||||||||
| 108.00 | X | O | B | 108.00 | |||||||||||||||||||||||||||||||||||||||||||||||||
| 106.00 | X | X | O | X | • | 106.00 | |||||||||||||||||||||||||||||||||||||||||||||||
| 104.00 | 9 | O | A | O | X | • | 104.00 | ||||||||||||||||||||||||||||||||||||||||||||||
| 102.00 | X | O | X | O | • | 102.00 | |||||||||||||||||||||||||||||||||||||||||||||||
| 100.00 | X | O | X | • | 100.00 | ||||||||||||||||||||||||||||||||||||||||||||||||
| 99.00 | X | O | X | • | 99.00 | ||||||||||||||||||||||||||||||||||||||||||||||||
| 98.00 | X | X | O | X | • | 98.00 | |||||||||||||||||||||||||||||||||||||||||||||||
| 97.00 | X | O | X | X | O | • | 97.00 | ||||||||||||||||||||||||||||||||||||||||||||||
| 96.00 | X | O | X | O | X | • | 96.00 | ||||||||||||||||||||||||||||||||||||||||||||||
| 95.00 | X | O | X | O | 8 | • | 95.00 | ||||||||||||||||||||||||||||||||||||||||||||||
| 94.00 | X | O | X | O | X | • | 94.00 | ||||||||||||||||||||||||||||||||||||||||||||||
| 93.00 | • | X | O | X | O | X | • | 93.00 | |||||||||||||||||||||||||||||||||||||||||||||
| 92.00 | • | X | O | X | O | • | 92.00 | ||||||||||||||||||||||||||||||||||||||||||||||
| 91.00 | • | X | O | X | • | 91.00 | |||||||||||||||||||||||||||||||||||||||||||||||
| 90.00 | • | X | O | X | X | X | • | 90.00 | |||||||||||||||||||||||||||||||||||||||||||||
| 89.00 | • | X | O | X | O | X | O | X | • | 89.00 | |||||||||||||||||||||||||||||||||||||||||||
| 88.00 | • | X | O | X | O | 7 | O | X | • | 88.00 | |||||||||||||||||||||||||||||||||||||||||||
| 87.00 | • | • | X | 6 | O | X | O | X | O | X | • | 87.00 | |||||||||||||||||||||||||||||||||||||||||
| 86.00 | • | X | • | X | O | X | O | X | O | X | O | X | • | 86.00 | |||||||||||||||||||||||||||||||||||||||
| 85.00 | • | X | O | • | X | O | X | O | X | O | X | O | • | 85.00 | |||||||||||||||||||||||||||||||||||||||
| 84.00 | X | • | X | O | • | X | O | O | X | O | X | • | 84.00 | ||||||||||||||||||||||||||||||||||||||||
| 83.00 | X | O | • | X | O | X | O | O | • | 83.00 | |||||||||||||||||||||||||||||||||||||||||||
| 82.00 | X | X | O | • | X | 5 | X | X | • | 82.00 | |||||||||||||||||||||||||||||||||||||||||||
| 81.00 | X | O | X | O | X | • | X | O | X | O | X | • | 81.00 | ||||||||||||||||||||||||||||||||||||||||
| 80.00 | X | O | X | O | X | O | X | • | X | O | X | O | X | • | 80.00 | ||||||||||||||||||||||||||||||||||||||
| 79.00 | X | X | X | O | X | O | X | O | X | O | X | O | O | X | • | 79.00 | |||||||||||||||||||||||||||||||||||||
| 78.00 | X | O | X | O | X | O | X | O | X | O | X | O | X | O | X | • | 78.00 | ||||||||||||||||||||||||||||||||||||
| 77.00 | X | O | X | O | X | O | O | O | X | O | X | O | X | • | 77.00 | ||||||||||||||||||||||||||||||||||||||
| 76.00 | X | O | X | 4 | X | O | X | O | O | X | • | 76.00 | |||||||||||||||||||||||||||||||||||||||||
| 75.00 | X | O | X | O | X | X | O | O | X | • | 75.00 | ||||||||||||||||||||||||||||||||||||||||||
| 74.00 | X | O | X | O | X | O | X | O | X | • | 74.00 | ||||||||||||||||||||||||||||||||||||||||||
| 73.00 | X | O | X | O | X | O | X | • | O | X | • | 73.00 | |||||||||||||||||||||||||||||||||||||||||
| 72.00 | X | O | O | O | X | • | O | X | • | 72.00 | |||||||||||||||||||||||||||||||||||||||||||
| 71.00 | X | O | • | O | • | 71.00 | |||||||||||||||||||||||||||||||||||||||||||||||
| 70.00 | X | • | • | 70.00 | |||||||||||||||||||||||||||||||||||||||||||||||||
| 69.00 | X | • | 69.00 | ||||||||||||||||||||||||||||||||||||||||||||||||||
| 68.00 | X | • | 68.00 | ||||||||||||||||||||||||||||||||||||||||||||||||||
| 67.00 | X | • | 67.00 | ||||||||||||||||||||||||||||||||||||||||||||||||||
| 66.00 | X | • | 66.00 | ||||||||||||||||||||||||||||||||||||||||||||||||||
| 65.00 | X | • | 65.00 | ||||||||||||||||||||||||||||||||||||||||||||||||||
| 64.00 | X | • | 64.00 | ||||||||||||||||||||||||||||||||||||||||||||||||||
| 63.00 | X | • | 63.00 | ||||||||||||||||||||||||||||||||||||||||||||||||||
| 62.00 | X | • | 62.00 | ||||||||||||||||||||||||||||||||||||||||||||||||||
| 61.00 | X | • | 61.00 | ||||||||||||||||||||||||||||||||||||||||||||||||||
| 60.00 | X | • | 60.00 | ||||||||||||||||||||||||||||||||||||||||||||||||||
| 59.00 | X | • | 59.00 | ||||||||||||||||||||||||||||||||||||||||||||||||||
| 58.00 | X | • | 58.00 | ||||||||||||||||||||||||||||||||||||||||||||||||||
| 21 |
| AJG Arthur J. Gallagher & Co. ($170.07) - Insurance - AJG broke a double top at $170 for an eighth consecutive buy signal and a new all-time high. The stock is a 5 for 5'er that ranks 3rd (out of 64) in the Insurance sector matrix and is accompanied by a yield north of 1%. Okay to consider here on the breakout. Initial support lies at $160. |
| AZO Autozone, Inc. ($2,009.05) - Autos and Parts - AZO broke a double top at 1952 before moving higher to 1984 where the stock is now trading at new all-time highs following earnings on Tuesday. AZO is a 5 for 5’er that trades on three consecutive buy signals and sits well above the bullish support line. From here, support sits at 1824. Note AZO is heavily overbought here. |
| CARS Cars.com Inc ($17.69) - Autos and Parts - CARS broke a double top at $18, marking the stock’s third consecutive buy signal. CARS is a 4 for 5’er within the autos and parts sector that just experienced a flip to positive weekly momentum. Demand is in control and the weight of the evidence is positive. Support sits at $16. |
| CMA Comerica Incorporated ($85.74) - Banks - CMA shares moved higher today to break a double top at $86 to mark its first buy signal. This 4 for 5'er has been in a positive trend since August and on an RS buy signal versus the market since November of 2020. CMA is actionable at current levels with a weekly overbought/oversold reading of -18%. From here, support is offered at $81. |
| CMCSA Comcast Corporation ($49.58) - Media - CMCSA broke a triple bottom today at $49, flipping the overall trend negative. As a result, CMCSA is now a 2 for 5’er within the media sector. This is the first time CMCSA has been a weak attribute name since November 2020. The stock is testing additional support at current levels. |
| CSL Carlisle Cos Inc ($242.72) - Autos and Parts - CSL broke a double top at $244 for a fourth consecutive buy signal and a new all-time high on the chart. The stock is a 5 for 5'er that ranks 8th (out of 56) in the Autos and Parts sector matrix. Okay to consider here on the breakout. Initial support lies at $228 with additional support in the $196 to $198 range. |
| FANG Diamondback Energy Inc ($115.58) - Oil - FANG broke a triple top at $116, returning to a buy signal, amidst a broad rally in the energy sector. FANG is a 5 for 5'er that ranks in the top quintile of the favored oil sector matrix; the stock currently yields 1.9%. FANG now finds support at $100. |
| GMS GMS Inc. ($60.57) - Building - Shares of GMS returned to a buy signal on Tuesday with a double top break at $61 and the stock remains a 5 for 5'er in the top quartile of the building stock sector matrix. Demand is in control and investors may consider taking partial positions at these levels. Initial support is offered at around $56 - $57. |
| MCD McDonald's Corporation ($260.04) - Restaurants - MCD broke a double top at $260 for a second consecutive buy signal and a new all-time high. The stock is a 3 for 5'er that ranks 3rd (out of 26) in the Restaurants sector matrix and is accompanied by a yield north of 2%. Okay to consider here on the breakout. Initial support lies at $244. |
| MPC Marathon Petroleum Corp. ($64.51) - Oil - MPC returned to a buy signal on Tuesday amid a strong rally by oil. The move adds additional evidence to an already positive picture as MPC is a 5 for 5'er that ranks in the top half of the oil sector matrix. The stock also carries a 3.75% yield. From here, support sits at $60. |
| MRVL Marvell Technology Inc. ($91.20) - Semiconductors - MRVL moved higher Tuesday to break a double top at $89 before reaching a new all-time high at $92 intraday. This 5 for 5'er moved to a positive trend in May and ranks 8th out of the 64 names in the semiconductors sector RS matrix. While the technical picture is strong, MRVL now become heavily overbought. Those looking to add exposure may be best served to ease in at current levels or wait for a potential pullback/normalization in the trading band. Initial support can be found at $81, with further support offered at $70. |
| MTN Vail Resorts Inc ($342.33) - Leisure - MTN returned to a buy signal today at $348 just two days ahead of expected earnings. MTN is a 4 for 5’er that recently tested (and held) its bullish support line. Demand is in control. From here, support sits at $324. |
| MTSI MACOM Technology Solutions Holdings Inc. ($77.37) - Semiconductors - MTSI rose Tuesday to break a double top at $76 before hitting $78 intraday. This 5 for 5'er moved to a positive trend in May and ranks in the top half of the semiconductor sector RS matrix. Exposure may be considered on this breakout, with strong support offered at $72. Note that the stock is at overhead resistance from earlier this month, with the potential for further resistance at $79. |
| NOW Servicenow Inc ($661.79) - Software - NOW moved higher Tuesday to break a double top at $632 before reaching $664 intraday. This ends a streak of three consecutive sell signals and passes a test of its bullish support line. This 4 for 5'er moved to a positive trend in June and ranks in the top quintile of the software sector RS matrix. The weight of the evidence is positive and improving. Initial support can be found at $600. |
| PXD Pioneer Natural Resources ($185.95) - Oil - PXD returned to a buy signal on Tuesday with a double top breakout at $188 a oil was up nearly 3% for the day. PXD is a 5 for 5'er and ranks in the top third of the favored oil sector matrix. The stock now finds support at $172. |
| RS Reliance Steel & Aluminum Co ($157.67) - Steel/Iron - RS returned to a buy signal Tuesday with a double top breakout at $158. RS is a 3 for 5'er and ranks seventh out 17 names in the steel/iron sector matrix. From here, the next level of support now sits at $150. RS carries a 1.8% yield. |
| SKY Skyline Champion Corp ($83.40) - Building - SKY is a solid 5 for 5’er that ranks 2nd out of 73 names in the building sector stock matrix. SKY broke a spread triple top at $83 before moving higher to $85, marking a new all-time high. From here, support sits at $78. |
| TER Teradyne, Inc. ($158.61) - Semiconductors - TER rose Tuesday to break a double top at $156 before matching its all-time high at $158 intraday. This 5 for 5'er moved to a positive trend in October and gave an RS buy signal against the market last week. The technical evidence is positive here, however, TER is now in overbought territory so those looking to add exposure may consider easing in at current levels, or waiting for a potential pullback/normalization in the trading band. Initial support can be found at $146. |

| Name | Option Symbol | Action | Stop Loss |
|---|---|---|---|
| KLA Corp - $417.61 | KLAC2218C410 | Buy the March 410.00 calls at 39.00 | 388.00 |
| Name | Option | Action |
|---|---|---|
| Apple Inc. ( AAPL) | Mar. 165.00 Calls | Initiate an option stop loss of 11.75 (CP: 13.75) |
| Name | Option Symbol | Action | Stop Loss |
|---|---|---|---|
| First Solar, Inc. - $101.25 | FSLR2218N105 | Buy the February 105.00 puts at 10.80 | 116.00 |
| Name | Option | Action |
|---|---|---|
| The Boeing Company (BA) | Mar. 190.00 Puts | Stopped at 208.00 (CP: 208.73) |
| Name | Option Sym. | Call to Sell | Call Price | Investment for 500 Shares | Annual Called Rtn. | Annual Static Rtn. | Downside Protection |
|---|---|---|---|---|---|---|---|
| Ford Motor Company $19.22 | F2218C21 | Mar. 21.00 | 1.51 | $9,317.20 | 42.01% | 25.13% | 6.50% |
| Name | Action |
|---|---|
| Mosaic Company (MOS) - 34.47 | Sell the March 37.00 Calls. |
| Bath & Body Works Inc. (BBWI) - 74.16 | Sell the February 80.00 Calls. |
| EQT Corporation (EQT) - 19.73 | Sell the March 23.00 Calls. |
| Crocs, Inc. (CROX) - 158.90 | Sell the March 190.00 Calls. |
| Alcoa Inc. (AA) - 45.56 | Sell the February 48.00 Calls. |
| Apache Corporation (APA) - 25.85 | Sell the January 27.50 Calls. |
| General Motors (GM) - 59.84 | Sell the March 62.50 Calls. |
| Macy's Inc. (M) - 27.13 | Sell the February 31.00 Calls. |
| The Buckle, Inc. (BKE) - 48.07 | Sell the March 50.00 Calls. |
| Extreme Networks, Inc. (EXTR) - 13.54 | Sell the March 15.00 Calls. |
| Name | Covered Write |
|---|---|
| The Kroger Co. ( KR - 45.11 ) | March 46.00 covered write. |
Daily Equity & Market Analysis
NDW MORNING UPDATE
Dec 16, 2025
Loading, Please Wait...
