
With just 19 trading days left in the year, we review the historical performance dispersion between the first half and the second half of December.
As we enter the first full trading week of December, we are now in the final stretch of 2021 with just 19 trading days left in the year after Monday. Those who are regular readers of our reports know that there are several market tendencies or historical biases that we highlight throughout the year. One such study is the tendency for December to produce strong returns for major domestic equity market indices. We have seen this from the S&P 500 Index, as December has produced the third-best average returns of any month using data from 1950 through 2020 at a gain of 1.30%. This has also been demonstrated by the Russell 2000 Index, as December has produced the second-best returns of any month on average using data since 1979 at a 2.14% improvement.
The first few trading days of December 2021 have seen a sharp uptick in volatility that has led most major indices to post declines over the first three trading days of the month, bringing this historical bias into question as we look toward the final few weeks of the year. However, it is often believed that much of the positive returns in prior months of December come in the latter half of the month. The Stock Trader’s Almanac mentions the strong end of month performance as a part of the Santa Claus Rally Study, stating, “Santa Claus tends to come to Wall Street nearly every year, bringing a short, sweet, and respectable rally within the last five days of the year and the first two in January.” We will discuss the Santa Claus Rally in more detail later in the month, but today we wanted to address the historical performance dispersion between the first half and the second half of December.
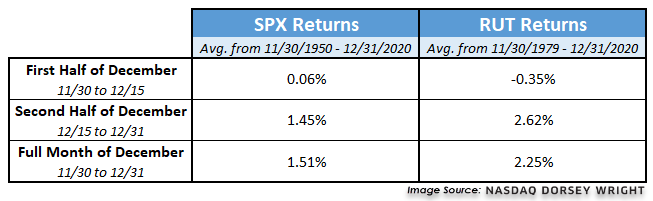
We have gathered data below for the SPX and RUT over three different segments: the first half of the month, the second half of the month, and the entire month. The performance comparison for each index confirms that almost the entirety of the average net gains for large-caps and small-caps occurs in the second half of the month. Some interesting observations from the yearly performance comparison are provided below, along with the average return summary.
Historical December Performance Observations:
- SPX has shown a positive return in December 75% of the time from 1950 forward. The index has shown a positive return in the first half of the month 58% of the time compared to being positive 79% of the time in the second half of the month.
- RUT has been positive 76% of the time from 1979 forward. The small-cap index has been positive only 48% of the time in the first half of the month, compared to being positive in 86% of the back half periods examined.
- SPX has seen the second half of the month outperform the first half in 63% of the instances.
- RUT has seen the second half of the month outpace the first half in 76% of the instances.
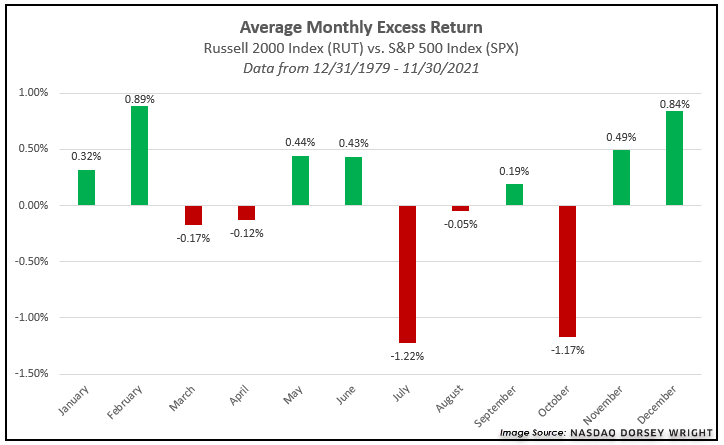
As we can see from the data above, the effect of outperformance in the second half of December is amplified for small-caps relative to large caps. We saw this in our “Modified January Effect” study, which looked at the outperformance of small-caps during holding periods from mid-December through mid-January of each new year. One explanation for this trend is that small stocks being sold for tax-loss purposes begin to rebound toward the end of December and into January as investors are willing to accept more risk in their portfolios. Regardless of the reasoning behind the theme, we see that December has had the second-highest average excess return between RUT and SPX of any month since 1979.
When we think about these December biases in context with the current market, the first half of the current month is certainly setting itself up nicely to demonstrate underperformance. We have seen an uptick in volatility over the past week that has led most major domestic equity indices to begin the month in the red. Despite this volatility, the broad domestic equities asset class has continued to demonstrate resilience across our long-term relative strength rankings such as DALI and the Asset Class Group Scores page. We have also seen some recent relative strength improvement from the small-cap space, as small-cap growth just moved back into the top-ranked position in the domestic equity size and style breakdown in DALI. We will continue to monitor the markets for any material changes in supply and demand relationships, however, keep these historical tendencies of late-December improvement in mind as we look toward the end of the year.
