
We examine the Santa Claus Rally - the historical tendency for the equity market to produce positive returns in the final days of the year through the first two trading sessions of the new year.
The Santa Claus Rally refers to a historical tendency toward positive equity returns during the last week of the year as well as the first couple days in the New Year. The time period encompasses the last five trading days of the year and the first two trading days of the New Year, so seven trading days in all. As we touched on in yesterday's report, markets have historically seen outsized returns in the second half of December, but this is especially true when examining only the seven-day trading period after Mr. Kringle visits all the children lucky enough to make the "nice" list.
A number of theories have been offered to explain the Santa Rally including tax positioning, a general sense of happiness and optimism on Wall Street, and that many large institutional investors wrap up most of their business before the holidays to go on vacation, leaving most of the trading to retail investors who tend to be more optimistic.
The chart below shows the S&P 500 (SPX) Santa Claus Rally returns from 1957 through 2020, depicted from strongest to weakest.
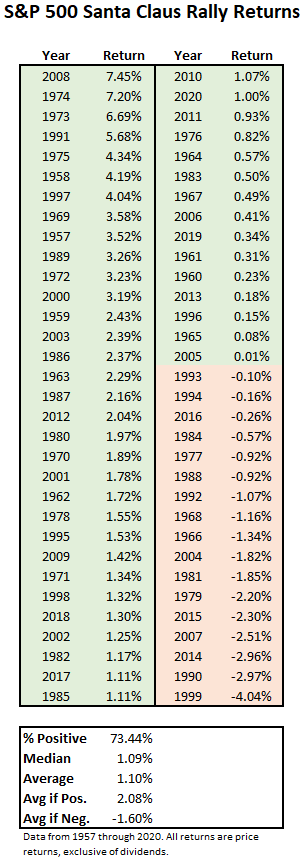
Whatever, the reason behind the tendency, the S&P (SPX) has posted an average gain of 1.10% during this period (from 1957 through 2020), which is not bad for a one-week return. Not only has the Santa Rally produced relatively strong 7-trading day returns, but it has also shown an impressive batting average – since 1957 the S&P has posted a gain during the period 73% of the time. During the years in which the Santa Claus rally produced a gain, the average improvement was 2.08%. The best Santa Clause rally came in 2008 as the SPX saw a gain of 7.45%. On the other hand, during the years that the Santa Claus Rally brought coal, the average loss was -1.6%, the worst performance coming in 1999 when the SPX posted a return of -4.04%. Last year, the S&P was near its historical average, producing a 1% gain during the Santa Rally.
The other major US benchmarks have had similar returns. Since 1972, the Nasdaq (NASD) has had an average Santa Rally gain of 1.5%, producing positive returns 71% of the time. Meanwhile, since 1900, the Dow (DJIA) has also gained a 1.5% on average, with 74% of the returns being positive.
Of course, 2021 has already been a very strong year for US equities. SPX, DJIA, and NASD are up 22.25%, 15.10%, and 18.13% year-to-date, respectively (through 12/6), so does that change the calculus at all? Should we expect a weaker Santa Rally given the run-up the market has already had this year? As it turns out, based on the historical trend, the answer is no.
The chart below plots the returns from past Santa Rallies for all three indexes, it also shows the average returns for all years and the returns for just the years when that index was up 10% or more.
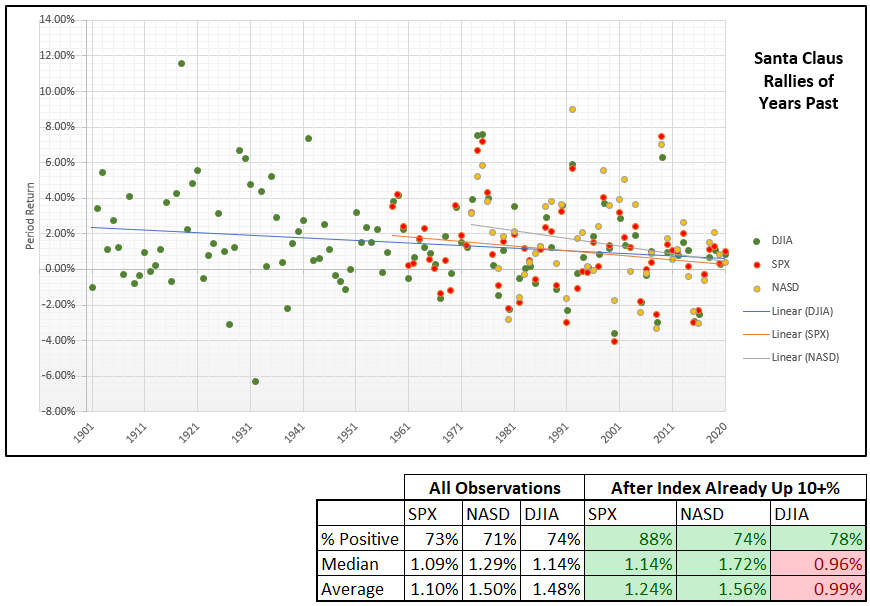
As you can see, the proportion of positive Santa Rallies for each index is higher in years with double-digit gains than across all years. Meanwhile, both the S&P and the Nasdaq show higher average gains during the Santa Rallies in years when they were already up 10% or more. The Dow is the only one of the three that shows a lower average Santa Rally gain in years where it has already risen 10%, but, it still shows a positive gain of just under 1%.
However, one point that runs contrary to the historical bias of the Santa Rally is the negative slope of the trend line seen on the chart, meaning that we have seen the magnitude of the Santa Claus Rally decrease over time.
Of course, there is no way to know for certain what this year has in store, whether the last week of the year will usher in another rally or if Santa will be leaving behind a lump of coal, but based on the historical data, we wouldn’t wager on the market petering out in the last few sessions of the year.
