Most Requested Symbols

As we do periodically, today we revisit the debate of active vs. passive management with updated rankings through the end of the second quarter.
The latest seasonal evaluation for the Fund Score Method (FSM) models took place earlier this week. Today, we review changes to some of the equity-focused models.
The average distribution reading is 20.61% overbought.
Today's featured stock is LKQ Corporation (LKQ)
ADNT, BOOT, CHWY, CLDX, CPS, DFIN, EA, GDDY, GOLF, HUBS, JAKK, LAMR, NRG, NTRA, ORMP, REGN, SEAS, TROW, WTRG
Call: Ameresco Inc. (AMRC), Put: Citrix Systems Inc. (CTXS), Covered Write: United States Steel Corporation (X)
Beginners Series Webinar: Join us on Friday, August 6th, at 2 PM (ET) for our NDW Beginners Series Webinar. This week's topic is Individual Stock Idea Generation. Register Here
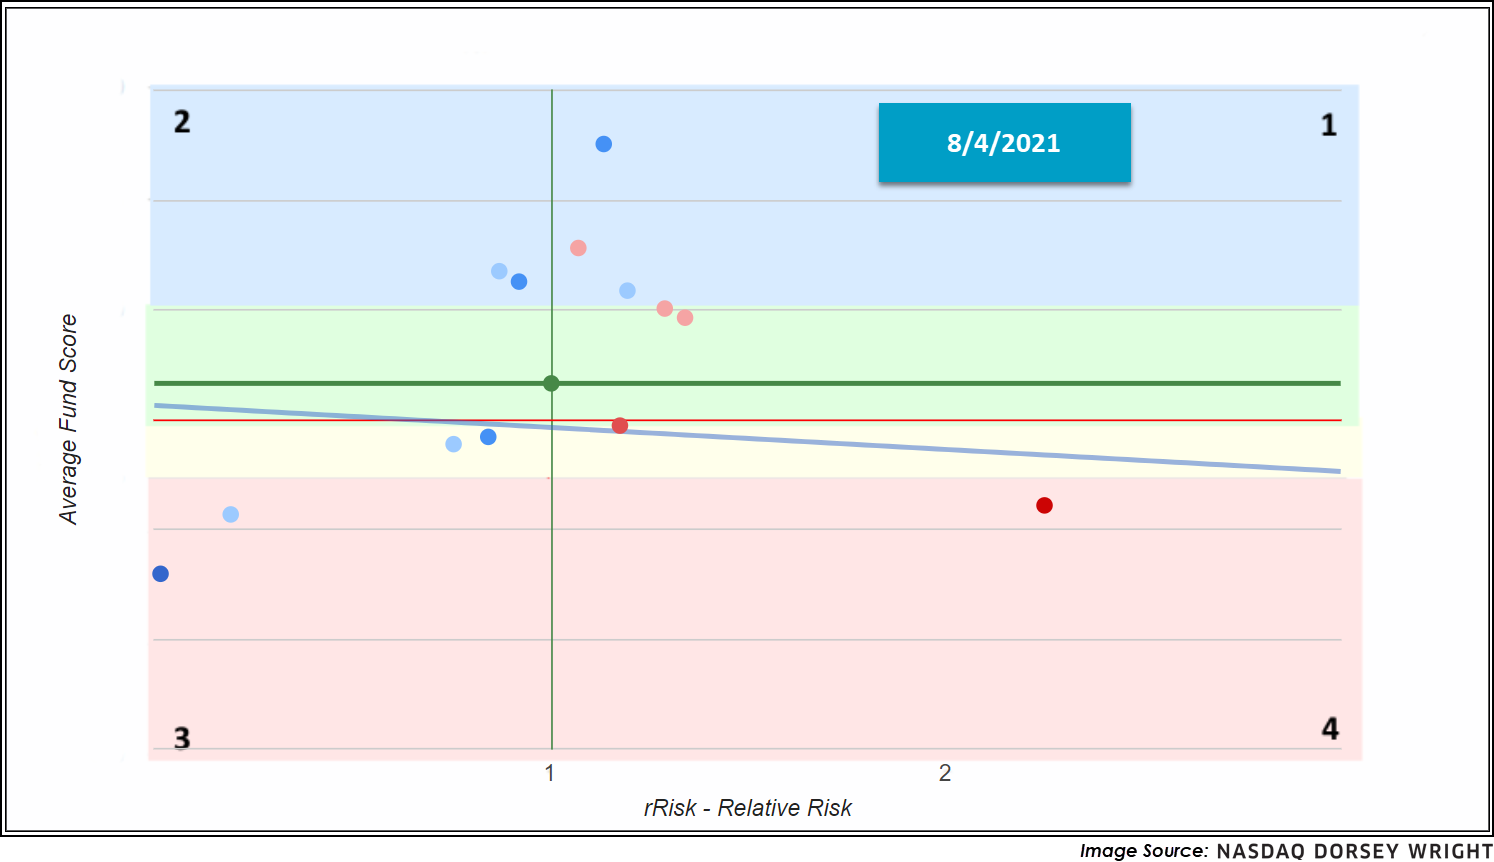
The S&P 500 Index Funds Group dropped from the top rank on the Asset Class Group Scores Page; however, it remains in the 97th percentile. This prolonged and historic strength from the domestic benchmark can easily mute the sector shifts taking place beneath the surface. So, to help pinpoint these trends more closely, we used the quadrant graph.
As a reminder, the quadrant graph is particularly useful for gaining a visual perspective on the relative strength/relative risk profile of a fund group. The two-dimensional graph, like any other, has an X and Y axis, with the former representing rRisk and the latter representing fund score - an rRisk of 1 matches the 3-year monthly standard deviation of the S&P 500, and a fund score of (3.00+) is considered technically acceptable. Keep in mind that fund scores will increase when the security performs well and decrease when the security performs poorly (like other momentum rankings). As a result, optimal quadrants include 2, which indicates low relative risk and high relative strength, as well as 1, which indicates high relative risk and high relative strength.
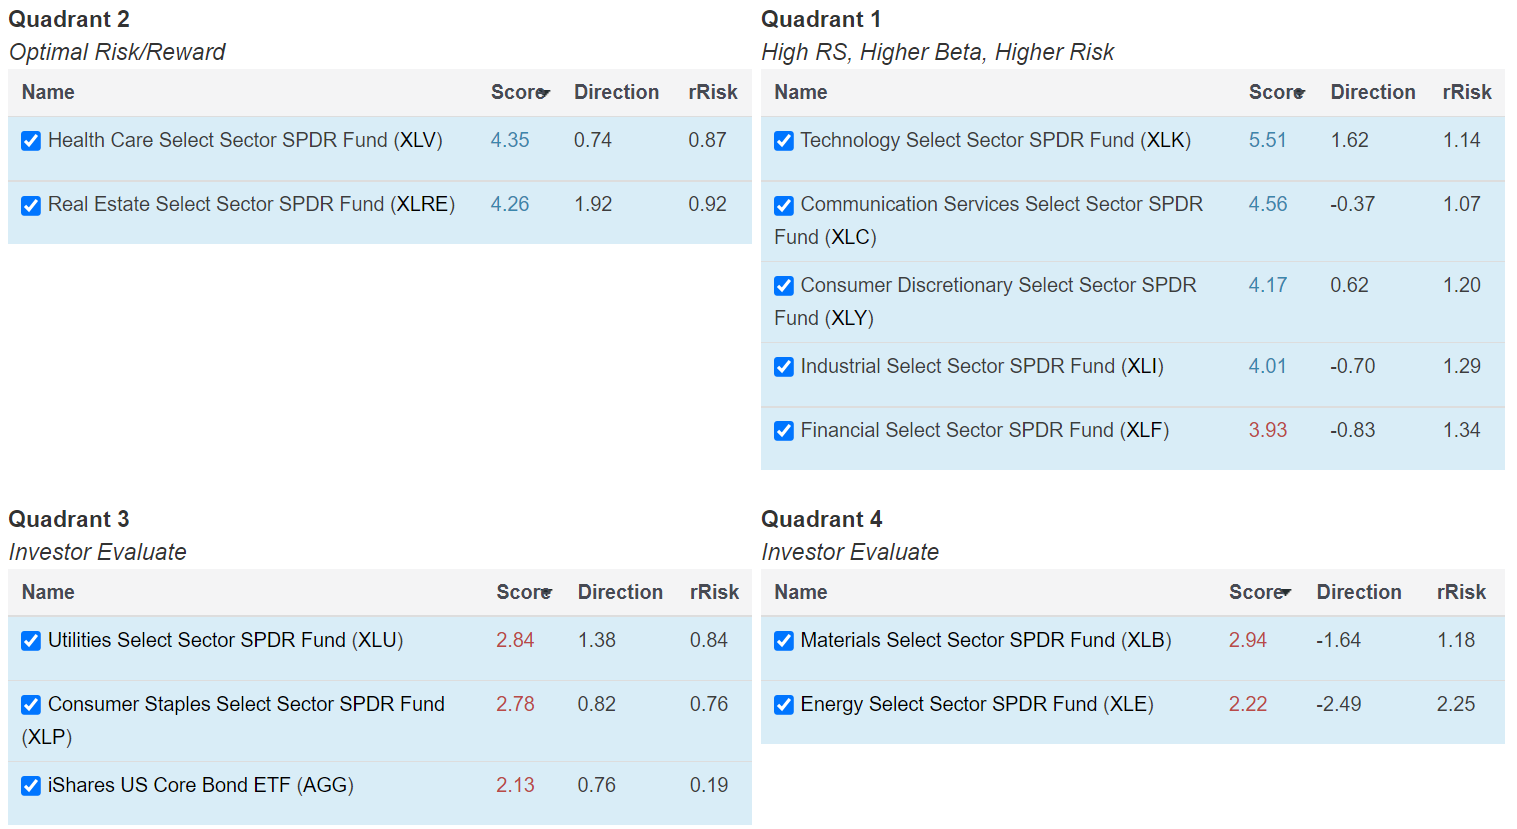
When grouping a set of funds, like we did below with the State Street SPDR Sector ETFs, we can summarize this trend, or demand sentiment, through the slope. A positive slope tells us that higher risk investments are being rewarded with higher returns (risk-on) while a negative slope says that lower risk investments are demonstrating greater price resilience (risk-off).

Perhaps of greater use is the ability to compare points in time. Shown above is the snapshot of the SPDR Sector quadrant graph from June (6/4) while the below snapshot is yesterday's (8/4) setup. Notice that we are also using the Doppler RS view, which tells us the intensity of the score directions/movements of the funds at the time. Two months ago, we had a positive slope and an environment where higher rRisk groups were being rewarded, but now (8/4) we have a negative slope, indicating that lower rRisk areas have held up better. Although the current slope is not strongly negative, it should tip us of shifts taking place in the underlying market environment, which can be masked by the major indices hitting all-time highs week after week.

As we do periodically, today we revisit the debate of active vs. passive management with updated rankings through the end of the second quarter.
Supporters of passive management assert that active managers cannot consistently outperform a passive benchmark and therefore investors are better off to invest in lower-cost index funds. Meanwhile, those in the active camp maintain that through their analysis and expertise active managers can produce persistent alpha.
The key determinate of which strategy, active or passive, is superior is market efficiency. Market efficiency describes the degree to which asset prices quickly and rationally adjust to reflect new information. In a highly efficient market, any new information is quickly incorporated into prices and therefore it is not possible to consistently achieve above average risk-adjusted returns in this type of market. Therefore, due to their lower cost, passive investment strategies are favored over active management in a highly-efficient market. In less efficient markets, on the other hand, the opportunity exists for skilled active managers to outperform passive strategies, thereby adding value for clients.
The question of active vs. passive is often framed with the premise that active or passive is always superior and often focuses on the U.S. large cap equity market, which is a natural starting point for the discussion – the large cap U.S. equity market is composed of the most well-known companies in the world and represents a large portion of many retirement portfolios. However, if we stop there we ignore what should be an obvious and fundamental element of the discussion – the various markets around the globe are not all equally efficient. The very fact that U.S. large cap companies are the most visible and researched firms in the world suggests that the U.S. large cap equity market is likely to be more efficient than its less-well-known counterparts!
Although it may appear largely academic, the active vs. passive debate has real-world implications for you as an advisor. First and foremost, you want to do what is in the best interest of your clients to help them achieve their financial goals. So, if active management really does not add value, and you will best serve your client by using passive funds to reduce expenses, then so be it. On the other hand, utilizing only passive funds eliminates one of your value propositions as an advisor – evaluating and selecting funds – and removes any possibility of outperformance. Therefore, we’ll examine several different markets individually to get a feel for which are the most efficient, and therefore likely favor passive management, and which are the least efficient, and therefore provide the greatest opportunity for active managers. The tables below show the rolling five-year return rankings of several well-known indices (representing passive management). If the index ranks in the top two quartiles, then it outperformed most managers within the peer group during that period. Conversely, if the index ranks below the 50th percentile, then most active managers in that universe outperformed the benchmark.
US Large Cap Equity
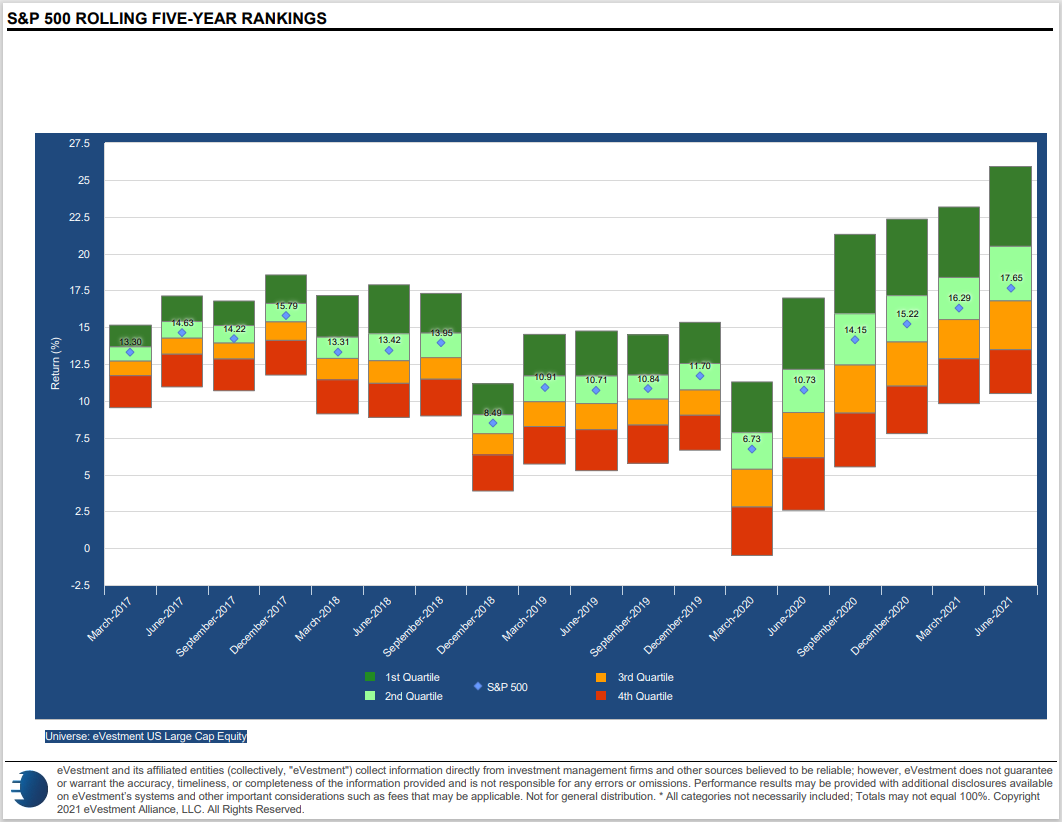
While there have been short periods, like the first quarter of 2021, during which the S&P 500 SPX has underperformed the average active manager, over longer periods, active managers have clearly struggled to outpace the passive benchmark. Over every rolling five-year period in our lookback window, the S&P has ranked above the 50th percentile. This does not rule out the possibility that individual mangers have consistently outperformed the index, but, in each time period the S&P has outperformed the majority of active managers. Put another way, if we had two hypothetical portfolios, one that held the S&P and one that randomly selected an active manager each period, we would expect the S&P portfolio to outperform.
US Small Cap Equity
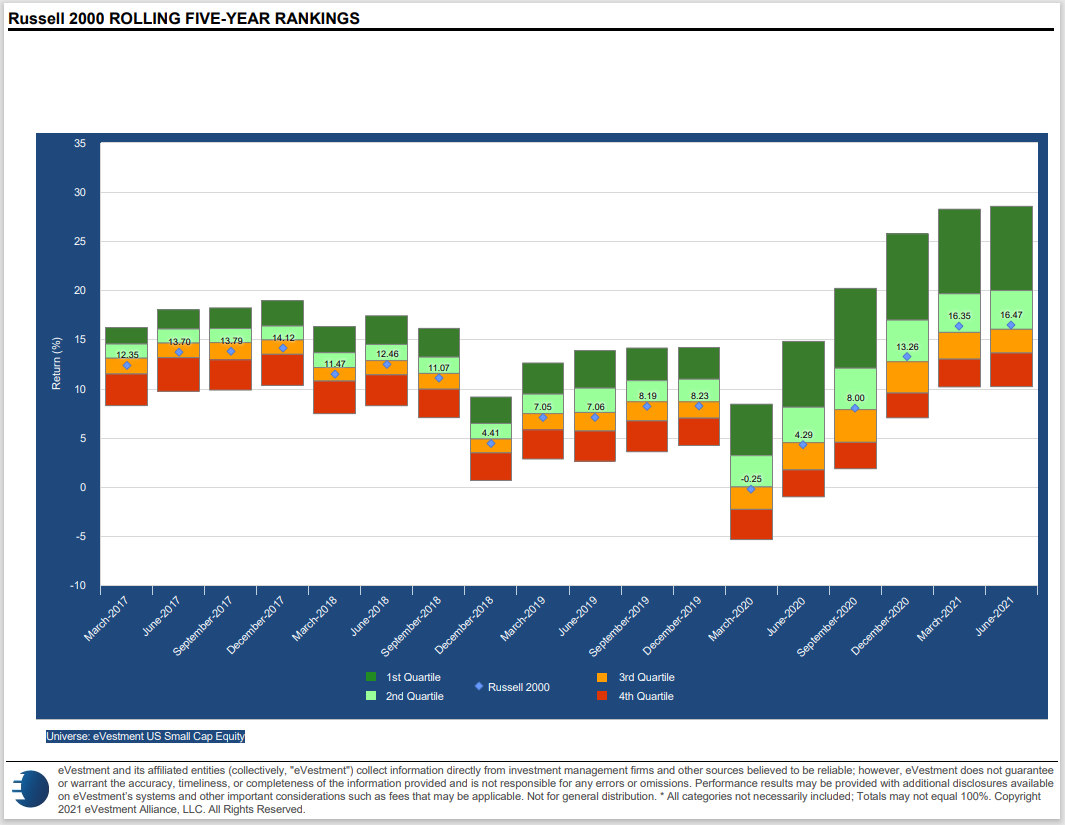
Anecdotally, we have heard that 2021 has been challenging for active small cap managers amid the rallies by Gamestop GME, American Entertainment Holdings AMC, and other stocks with weak fundamentals that were generally eschewed by professional managers. This may, at least partially, explain why we have seen the benchmark climb above the 50th percentile in the most recent time periods, while it had ranked in the third quartile during most periods ending before 2020. At this juncture, it would be hard to say whether active or passive management is clearly favored. The recent underperformance by active managers is something to keep an eye to see if it is merely a short-term trend confined to an unusual market environment or if develops into something more long-term.
Developed International Equity

The passive EAFE index finished below the 50th percentile in almost every five-year period shown indicating that on average active management has been able to add value. Based on the historical evidence, we would expect to benefit by utilizing active management in the space as opposed the passive benchmark.
Emerging Market Equity

Similar to what we saw in the small cap space, the MSCI emerging markets index has finished above the 50th percentile over the last several time periods after ranking in the bottom two quartiles in many periods prior to 2020. Once again, this is a development worth keeping an eye on to see if it is short-term in nature or persists to become a long-term trend.
US Core Fixed Income

The US aggregate index ranks squarely in the bottom quartile across most time periods in our lookback period leaving little doubt that most active managers outperform the benchmark. It is worth noting that there are number of ways that active fixed income managers can subtly alter their portfolios – e.g. reducing Treasury exposure and increasing corporate exposure – to gain a return advantage over the index. But doing so also increases the risk (credit risk in this example) of the portfolio. The point being that while most US core fixed income managers are outperforming the benchmark, many may be doing so by marginally increasing risk.
Global Fixed Income

As with domestic fixed income, the rolling five-year rankings also show consistent outperformance by active managers.
Ultimately, whether active or passive management is better comes down the individual market in question. There are several markets in which active managers show consistent outperformance. There are also more efficient markets, like US large cap, in which active managers have struggled to outperform the index. Making a market-by-market assessment when deciding whether to employ an active or passive strategy provides us the opportunity to save money on fees by utilizing passive strategies in highly-efficient markets and add value by identifying inefficient markets and selecting skilled active managers who can generate superior returns.
The latest seasonal evaluation for the Fund Score Method (FSM) models on the NDW platform took place after market close on Tuesday, August 3, and any corresponding trades were sent out the morning of Wednesday, August 4. As a refresher, the FSM seasonal models are evaluated four times a year at the beginning of each seasonal quarter, so at the beginning of February, May, August, and November. At each evaluation, the models will sort their respective inventories by fund score, seeking to only hold those funds that possess the highest scores. The number of securities held is dependent on the model, but will typically be two or five names. For more information on the construction of the FSM models, please visit our FSM model guide.
This week’s evaluation saw several changes to the models, but perhaps not as many as might be anticipated given the recent market movement. None of the separate cash triggers that are tied to the models were triggered, as the core US equity market continues to rank among the top asset classes by average score, and money market continues to sit at the bottom of the rankings. Many of the models that saw changes shifted back toward overweight positions in large-cap growth, with high exposure also seen in the technology sector. Today, we will review the recent changes to some of the equity-focused models available on the platform, with the remaining models being covered in Friday’s Fund Score Overview.
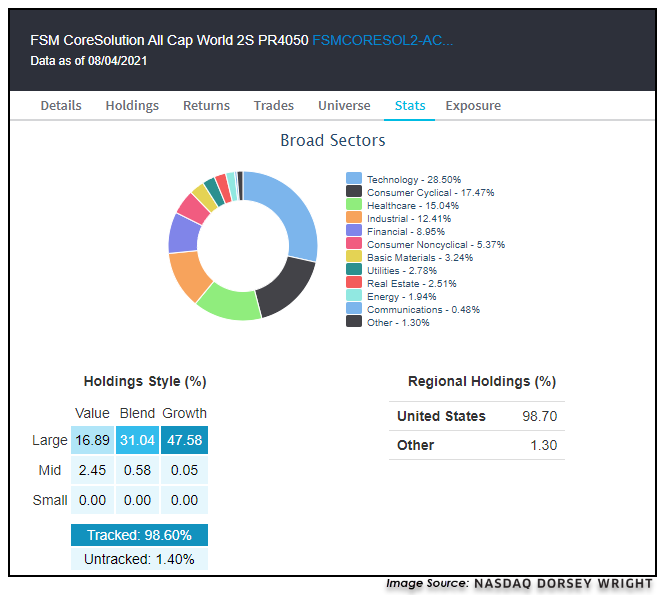
CoreSolution Models
The FSM CoreSolution All Cap World 2S Model saw a change in the latest evaluation, with the Invesco S&P 500 Pure Value ETF RPV being sold from the model and replaced by the Invesco S&P 500 Pure Growth ETF RPG. The growth representative joins the Invesco S&P 500 Equal Weight ETF RSP in an equal-weighted fashion, leaving the portfolio at a substantial overweight toward large-cap growth. Technology is now the most overweight sector in the portfolio at just over 28%, followed by consumer cyclical at about 17% and healthcare at 15%.
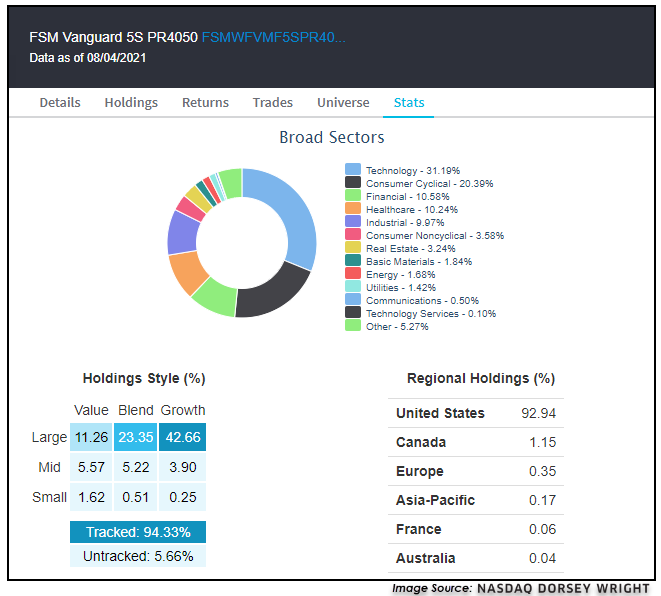
Flexible Allocation Models
The FSM Vanguard 5S Model saw two changes in the most recent evaluation, with the Vanguard Small-Cap Index Fund NAESX and the Vanguard Tax-Managed Capital Appreciation Fund VTCLX each being sold from the portfolio. In their place, the model purchased the Vanguard Growth Index Fund VIGRX and the Vanguard US Growth Fund VWUSX. This leaves the fund at an overweight toward large-cap growth, a theme reflected across many of the most recent model changes. The most overweight sector is again technology at 31% with a high allocation also seen in consumer cyclicals at 20%, followed by financials and healthcare, which each make up about 10%, 20% total, of the portfolio.
Other Equity Focused Models
The FSM First Trust SelfDirect 5S Model saw 100% turnover in the latest evaluation, with five positions being sold and five new positions added. The model moved away from value, financials, and dividend achievers representatives. In their place, the model purchased representatives for growth, consumer cyclicals, technology, and even the First Trust Water ETF FIW. Similar to the other equity-focused models, this strategy is now overweight technology at 31% with high exposure seen in consumer cyclicals at almost 25% and industrials at almost 19% of the portfolio.
The FSM Schwab Macro Blend 5S Model saw two changes this week, with the portfolio removing the Schwab US Broad Market ETF SCHB and the Schwab US Small-Cap ETF SCHA. The model gained exposure toward the Schwab US Large-Cap Growth ETF SCHG and the Schwab US REIT ETF SCHH. Interestingly enough, this leaves the portfolio with an overweight position toward real estate at roughly 23% of the model, with high exposure also seen in technology (21%) and consumer cyclicals (16%).


Average Level
20.61
| AGG | iShares US Core Bond ETF |
| USO | United States Oil Fund |
| DIA | SPDR Dow Jones Industrial Average ETF |
| DVY | iShares Dow Jones Select Dividend Index ETF |
| DX/Y | NYCE U.S.Dollar Index Spot |
| EFA | iShares MSCI EAFE ETF |
| FXE | Invesco CurrencyShares Euro Trust |
| GLD | SPDR Gold Trust |
| GSG | iShares S&P GSCI Commodity-Indexed Trust |
| HYG | iShares iBoxx $ High Yield Corporate Bond ETF |
| ICF | iShares Cohen & Steers Realty ETF |
| IEF | iShares Barclays 7-10 Yr. Tres. Bond ETF |
| LQD | iShares iBoxx $ Investment Grade Corp. Bond ETF |
| IJH | iShares S&P 400 MidCap Index Fund |
| ONEQ | Fidelity Nasdaq Composite Index Track |
| QQQ | Invesco QQQ Trust |
| RSP | Invesco S&P 500 Equal Weight ETF |
| IWM | iShares Russell 2000 Index ETF |
| SHY | iShares Barclays 1-3 Year Tres. Bond ETF |
| IJR | iShares S&P 600 SmallCap Index Fund |
| SPY | SPDR S&P 500 Index ETF Trust |
| TLT | iShares Barclays 20+ Year Treasury Bond ETF |
| GCC | WisdomTree Continuous Commodity Index Fund |
| VOOG | Vanguard S&P 500 Growth ETF |
| VOOV | Vanguard S&P 500 Value ETF |
| EEM | iShares MSCI Emerging Markets ETF |
| XLG | Invesco S&P 500 Top 50 ETF |
| Symbol | Company | Sector | Current Price | Action Price | Target | Stop | Notes |
|---|---|---|---|---|---|---|---|
| GFL | GFL Environmental Inc | Waste Management | $35.23 | low to upper 30s | 38 | 26 | 5 for 5'er, 5 consec buy signals, pullback from ATH |
| AKR | Acadia Realty Trust | Real Estate | $20.62 | 20 - 22 | 28 | 18 | 4 for 5'er, #6 of 154 in REAL sector matrix, one box from RS buy signal, 2.7% yield |
| STOR | Store Capital Corp. | Real Estate | $35.62 | mid-to-upper 30s | 47.50 | 30 | 5 for 5'er, multiple buy signals, one box from 52-week high, 4.1% yield, R-R>2.0 |
| RVNC | Revance Therapeutics, Inc | Biomedics/Genetics | $29.32 | hi 20s - low 30s | 40 | 26 | 5 for 5'er, top 25% of BIOM sector matrix, quad top breakout, positive trend change, pos monthly mom flip |
| NDLS | Noodles & Company | Restaurants | $12.64 | 11.50 - 13.50 | 20 | 10 | 5 for 5'er, #1 of 28 in REST sector matrix, triple top, pullback to mid of trading band, R-R>2.5 |
| SEM | Select Medical Holdings Corporation | Healthcare | $38.47 | hi 30s - low 40s | 58 | 35 | 5 for 5'er, #8 of 116 names in favored HEAL sector matrix, multiple buy signals, good R-R |
| JBL | Jabil Circuit, Inc. | Electronics | $58.93 | low to high 50s | 73 | $47 | 4 for 5'er, multi-year highs, consecutive buy signals, top 10% of DWAELEC Earnings 9/22 |
| OXY | Occidental Petroleum Corporation | Oil | $25.69 | upper 20s - lower 30s | 33.50 | 22 | 3 for 5'er, top half of favored OIL sector matrix, bullish triangle, pullback from 52-week high |
| TW | Tradeweb Markets, Inc. Class A | Business Products | $87.84 | 80s | 100 | 71 | 4 for 5'er, top 20% of BUSI sector matrix, triple top, pullback from ATH |
| UNH | UnitedHealth Group Incorporated | Healthcare | $421.54 | 390-420 | 496 | 340 | 4 for 5'er, top half of favored DWAHEAL matrix, consec buy signals, pullback from ATH, pos weekly mom flip, 1.38% yield |
| MS | Morgan Stanley | Wall Street | $96.29 | 90s | 109 | 83 | 5 for 5'er, top 10% of WALL sector matrix, spread triple top, LT pos mkt RS, 3.1% yield |
| ENTG | Entegris Inc. | Semiconductors | $124.21 | 110s to high 120s | 170 | 95 | 5 for 5'er, pullback from ATH, long-term market RS buy signal, top 25% of DWASEMI |
| GGG | Graco Inc | Machinery and Tools | $79.60 | mid 70s to low 80s | 108 | 64 | 4 for 5'er, consec buy signals, pullback from ATH, 1 box from bullish triangle, pos weekly momentum, long-term market & peer RS buy signals |
| DHI | D.R. Horton, Inc. | Building | $95.85 | 90s | 109 | 79 | 4 for 5'er, top 25% of BUIL sector matrix, LT pos mkt RS, spread quad top breakout, pos. trend change |
| AA | Alcoa Inc. | Metals Non Ferrous | $38.75 | mid to upper 30s to mid 40s | 56 | 30 | 5 for 5'er, bearish signal reversal pattern, pullback from multi-year highs, pos weekly mom flip, long-term market RS buy signal |
| ODFL | Old Dominion Freight Line, Inc. | Transports/Non Air | $270.36 | 250s to 280s | 324 | 216 | 5 for 5'er, pullback from ATH, 5 consec buy signals, LT market RS, pos weekly momentum, top 1/3 DWATRANS |
| ARCH | Arch Resources Inc | Oil | $66.08 | mid-to-upper 60s | 85 | 56 | 5 for 5'er, top 10% of oil sector matrix, bullish catapult, pullback from 52-wk high, R-R~2.0 |
| FB | Facebook Inc. | Internet | $358.92 | 340s - 360s | 460 | 304 | 4 for 5'er, top third of INET sector matrix, triple top breakout, pullback from ATH, R-R>2.0 |
| CMC | Commercial Metals Corporation | Steel/Iron | $31.80 | low to mid 30s | 36 | 26 | 5 for 5er, 2 weeks pos weekly mom, 4 consec buy signals, pullback from multi-year high, 1.46% yield |
| AFG | American Financial Group Inc | Insurance | $129.47 | high 120s - high 130s | 152 | 106 | 5 for 5'er, #5 of 65 names in INSU sector matrix, multiple consec buy signals, triple top breakout |
| LKQ | LKQ Corporation | Autos and Parts | $50.91 | high 40s to mid 50s | 63 | 40 | 4 for 5'er, top 10% of DWAAUTO, 10 consec buy signals & sitting at ATH |
| Symbol | Company | Sector | Current Price | Action Price | Target | Stop | Notes |
|---|---|---|---|---|---|---|---|
| OPEN | Opendoor Technologies Inc. | Wall Street | $14.51 | low to mid 10s | 2 | 19.50 | 0 for 5'er, 4 consecutive sell signals, negative trend, bottom of DWAWALL matrix, negative monthly momentum, Earn. 8/11 |
| RAMP | Liveramp Holdings Inc. | Business Products | $38.66 | high 40s to high 30s | 36 | 51 | 0 for 5'er, 10 consec sell signals, 52 week lows, negative monthly mom flip, negative trend |
| Comment | |||||||
|---|---|---|---|---|---|---|---|
|
|
|||||||
LKQ LKQ Corporation R ($50.23) - Autos and Parts - LKQ is a solid 4 for 5’er that ranks within the top decile of the autos and parts sector stock matrix. Last week, LKQ gave its 10th consecutive buy signal with a move to $52, which also marked a new all-time high. Overall, the weight of the evidence is positive. Okay to add new exposure in the high 40s to mid-50s. We will set our initial stop at $40, which would violate multiple levels of support on the chart. We calculated a modified bullish price objective of $63 using LKQ’s most recent buy signal, which will serve as our near-term price target.
| 15 | 16 | 17 | 18 | 19 | 20 | 21 | |||||||||||||||||||||||||||||||||||||||||||||||
| 52.00 | X | 52.00 | |||||||||||||||||||||||||||||||||||||||||||||||||||
| 51.00 | X | 7 | 51.00 | ||||||||||||||||||||||||||||||||||||||||||||||||||
| 50.00 | 5 | O | X | 50.00 | |||||||||||||||||||||||||||||||||||||||||||||||||
| 49.00 | X | O | X | Mid | 49.00 | ||||||||||||||||||||||||||||||||||||||||||||||||
| 48.00 | X | 6 | X | 48.00 | |||||||||||||||||||||||||||||||||||||||||||||||||
| 47.00 | X | O | 47.00 | ||||||||||||||||||||||||||||||||||||||||||||||||||
| 46.00 | X | 46.00 | |||||||||||||||||||||||||||||||||||||||||||||||||||
| 45.00 | X | 45.00 | |||||||||||||||||||||||||||||||||||||||||||||||||||
| 44.00 | • | X | 4 | 44.00 | |||||||||||||||||||||||||||||||||||||||||||||||||
| 43.00 | X | • | • | X | O | X | Bot | 43.00 | |||||||||||||||||||||||||||||||||||||||||||||
| 42.00 | 1 | O | X | • | X | O | X | 42.00 | |||||||||||||||||||||||||||||||||||||||||||||
| 41.00 | X | O | X | O | • | 3 | O | 41.00 | |||||||||||||||||||||||||||||||||||||||||||||
| 40.00 | C | 2 | X | O | • | X | X | 40.00 | |||||||||||||||||||||||||||||||||||||||||||||
| 39.00 | X | O | X | 3 | • | X | O | X | 39.00 | ||||||||||||||||||||||||||||||||||||||||||||
| 38.00 | B | O | O | • | X | 1 | O | 2 | 38.00 | ||||||||||||||||||||||||||||||||||||||||||||
| 37.00 | A | 4 | • | • | X | O | X | O | X | 37.00 | |||||||||||||||||||||||||||||||||||||||||||
| 36.00 | X | X | O | X | • | X | • | X | O | X | O | X | 36.00 | ||||||||||||||||||||||||||||||||||||||||
| 35.00 | 8 | O | 9 | O | X | O | • | B | O | • | X | O | O | 35.00 | |||||||||||||||||||||||||||||||||||||||
| 34.00 | X | X | O | C | 7 | O | 7 | O | • | X | O | • | X | 34.00 | |||||||||||||||||||||||||||||||||||||||
| 33.00 | 4 | O | 7 | A | B | O | 6 | O | 6 | 8 | X | X | 1 | • | 9 | B | 33.00 | ||||||||||||||||||||||||||||||||||||
| 32.00 | X | X | O | X | O | X | O | X | O | X | 9 | X | O | X | 2 | • | X | X | O | X | 32.00 | ||||||||||||||||||||||||||||||||
| 31.00 | 7 | O | 9 | X | 6 | X | O | X | O | X | O | X | A | X | X | O | X | O | • | X | O | X | O | X | 31.00 | ||||||||||||||||||||||||||||
| 30.00 | 6 | O | X | O | 3 | O | O | 3 | X | O | • | O | 4 | O | X | A | O | • | 6 | O | 8 | O | A | 30.00 | |||||||||||||||||||||||||||||
| 29.00 | 9 | B | X | 8 | X | O | X | 4 | X | • | O | 3 | O | X | O | • | X | O | X | O | X | 29.00 | |||||||||||||||||||||||||||||||
| 28.00 | 8 | O | X | O | 5 | O | X | O | X | O | • | O | 2 | 5 | X | 9 | 3 | • | X | O | X | 7 | O | X | 28.00 | ||||||||||||||||||||||||||||
| 27.00 | X | O | X | O | X | O | 1 | X | • | O | X | O | X | O | X | • | O | X | X | O | X | O | X | O | • | 27.00 | |||||||||||||||||||||||||||
| 26.00 | X | A | 1 | 4 | O | X | • | O | X | O | X | O | X | • | O | X | O | X | O | X | O | X | • | 26.00 | |||||||||||||||||||||||||||||
| 25.00 | 2 | X | 2 | X | • | C | X | 7 | • | 8 | • | O | X | O | X | O | O | • | 25.00 | ||||||||||||||||||||||||||||||||||
| 24.00 | O | X | O | • | O | X | • | • | O | X | 5 | X | • | 24.00 | |||||||||||||||||||||||||||||||||||||||
| 23.00 | O | • | 1 | • | O | X | X | O | X | • | 23.00 | ||||||||||||||||||||||||||||||||||||||||||
| 22.00 | • | • | O | X | X | O | X | O | • | 22.00 | |||||||||||||||||||||||||||||||||||||||||||
| 21.00 | • | O | X | O | X | O | X | • | 21.00 | ||||||||||||||||||||||||||||||||||||||||||||
| 20.00 | • | O | X | O | X | O | X | • | 20.00 | ||||||||||||||||||||||||||||||||||||||||||||
| 19.50 | • | O | X | 4 | X | O | • | 19.50 | |||||||||||||||||||||||||||||||||||||||||||||
| 19.00 | • | O | X | O | X | • | 19.00 | ||||||||||||||||||||||||||||||||||||||||||||||
| 18.50 | • | O | X | O | X | • | 18.50 | ||||||||||||||||||||||||||||||||||||||||||||||
| 18.00 | • | O | X | X | O | X | • | 18.00 | |||||||||||||||||||||||||||||||||||||||||||||
| 17.50 | • | O | X | O | X | O | • | 17.50 | |||||||||||||||||||||||||||||||||||||||||||||
| 17.00 | • | O | X | O | X | • | 17.00 | ||||||||||||||||||||||||||||||||||||||||||||||
| 16.50 | • | O | X | O | X | • | 16.50 | ||||||||||||||||||||||||||||||||||||||||||||||
| 16.00 | • | O | X | O | X | • | 16.00 | ||||||||||||||||||||||||||||||||||||||||||||||
| 15.50 | O | X | O | X | • | 15.50 | |||||||||||||||||||||||||||||||||||||||||||||||
| 15.00 | O | X | O | X | • | 15.00 | |||||||||||||||||||||||||||||||||||||||||||||||
| 14.50 | O | X | O | X | • | 14.50 | |||||||||||||||||||||||||||||||||||||||||||||||
| 14.00 | O | O | X | • | 14.00 | ||||||||||||||||||||||||||||||||||||||||||||||||
| 13.50 | O | • | 13.50 | ||||||||||||||||||||||||||||||||||||||||||||||||||
| 15 | 16 | 17 | 18 | 19 | 20 | 21 |

| ADNT Adient plc ($37.41) - Autos and Parts - ADNT moved to a sell signal on Thursday with a double bottom break at 38 before moving lower to 35 following negative reaction to earnings. This move also violated the stock’s bullish support line, which demotes the stock to an unacceptable 1 for 5’er within the unfavored autos and parts sector. Avoid as supply is in control and the trend is now negative. ADNT is testing another level of support here at 35. |
| BOOT Boot Barn Holdings Inc ($89.73) - Retailing - BOOT broke a double top at $90 on Thursday before moving higher to $93, marking a new all-time and the third consecutive buy signal on the chart. BOOT is a perfect 5 for 5’er that ranks within the top decile of the retailing sector stock matrix. BOOT has maintained a long-term peer RS buy signal since August 2016 and is trading well above the bullish support line. From here, support sits at $83. |
| CHWY Chewy, Inc. Class A ($91.09) - Retailing - CHWY is a 3 for 5’er within the retailing sector that broke a triple top today at 91 before moving higher to 92. From here, support sits at 82 and 80, the bullish support line. At current levels, CHWY is testing overhead resistance that dates to March. |
| CLDX Celldex Therapeutics Inc. ($47.99) - Biomedics/Genetics - CLDX shares moved higher today to break a double top at $47 to return to a buy signal. This 5 for 5'er has been in a positive trend since April and on an RS buy signal versus the market since February of 2020. Recent price action has put CLDX into heavily overbought territory with a weekly overbought/oversold reading of 87%, so those wishing to initiate a long position may be best served to wait for a pullback. From here, support is offered at $38. |
| CPS Cooper-Standard Holdings Inc. ($20.66) - Autos and Parts - CPS is an unacceptable 0 for 5’er that ranks 56th out of 57 names in the autos and parts sector stock matrix, signaling that it is one of the weakest names in this unfavored group. Today, CPS broke a double bottom at 22 before moving lower to 21 which marked the third consecutive sell signal on the chart. From here, additional support resides at 15.50 from October. Avoid. |
| DFIN Donnelley Financial Solutions Inc ($34.75) - Software - DFIN broke a double top at $34, completing a bullish catapult, before rallying up to $35, a new high. DFIN is a 5 for 5'er that ranks in the top half of the Software sector matrix. Okay to consider here on the breakout or on a pullback to $32 on the chart. Initial support lies at $30, while longer-term support lies at $25. |
| EA Electronic Arts Inc. ($136.30) - Software - EA broke a double bottom at 136 today, which violated the bullish support line. As a result, EA is now a 1 for 5’er within the software sector. Weekly momentum just flipped negative, suggesting the potential for lower prices. Avoid. EA is testing support at current levels and has more support at 128. |
| GDDY GoDaddy Inc. ($73.16) - Internet - GDDY moved lower Thursday after their earnings release to break a spread quintuple bottom at $78 before falling over 12% intraday to $72. This violated the bullish support line, placing the stock back in a negative trend and demoting it to a 1 for 5'er from a technical attribute perspective. Avoid long exposure. GDDY is at support from March, with further support seen at $69. |
| GOLF Acushnet Holdings Corp ($53.21) - Leisure - GOLF is a strong 4 for 5’er within the leisure sector that ranks 5th out of 55 names in the sector stock matrix. Following earnings today, GOLF broke a double top at 55 before moving higher to 56, returning the chart to a Point & Figure buy signal and a new all-time high. Weekly momentum has been positive for two weeks, and GOLF has maintained a long-term market RS buy signal since May 2018. Demand is in control, and the technical picture is positive. From here, support sits at 47. |
| HUBS Hubspot Inc ($656.68) - Software - HUBS moved higher Thursday to break a double top at $608 before advancing over 11% and reaching a new all-time high at $656 intraday. This 5 for 5'er has maintained a positive trend since April of 2020 and ranks in the top quintile of the software sector RS matrix. The technical picture is strong here, however, HUBS is now in heavily overbought territory so those looking to add exposure may look to wait for a pullback or normalization in the trading band. Initial support can be found at $576 with further support offered at $544. |
| JAKK Jakks Pacific ($14.96) - Leisure - Today, JAKK broke a triple top at 15.50, which returned to the chart to buy signal, an overall positive trend, and a new 52 week high. As a result, JAKK is now a perfect 5 for 5’er that ranks highly in the leisure sector stock matrix. Furthermore, JAKK just experienced a flip to positive weekly momentum, suggesting the potential for higher prices. From here, support sits at 12.50. |
| LAMR Lamar Advertising Company ($107.94) - Media - LAMR responded favorably to earnings today and broke a double top at 110 before moving higher to 112. As a result, LAMR is now trading at new all-time highs with 3 attributes in its favor. From here, support sits at 98. LAMR yields 2.8%. |
| NRG NRG Energy, Inc. ($41.91) - Utilities/Electricity - Following earnings this morning, NRG broke a double top at $43 on Thursday and is now trading on two consecutive buy signals. NRG is a 3 for 5’er that moved into a positive trend earlier last month. Furthermore, monthly momentum has been positive for two months, adding to the overall weight of the evidence. From here, NRG faces overhead resistance at $44, while initial support is available at $39. NRG yields 3.12%. |
| NTRA Natera Inc ($119.51) - Healthcare - NTRA shares moved higher today to break a double top at $118 to complete a bullish triangle and mark its second consecutive buy signal. This 5 for 5'er has been in a positive trend since June and on an RS buy signal versus the market since April of 2020. NTRA is actionable at current levels with a weekly overbought/oversold reading of 19%. From here, support is offered at $110. |
| ORMP Oramed Pharmaceuticals Inc. (Israel) ADR ($17.31) - Drugs - ORMP shares moved higher today to break a double top at $17 to mark its third consecutive buy signal. This 5 for 5'er has been in a positive trend since November and on an RS buy signal versus the market since January. ORMP is actionable at current levels with a weekly overbought/oversold reading of 31%. From here, support is offered at $13. |
| REGN Regeneron Pharmaceuticals, Inc. ($599.69) - Biomedics/Genetics - REGN shares moved higher today to break a double top at $600 to mark its fifth consecutive buy signal. This 4 for 5'er has been in a positive trend since May and on an RS buys signal versus the market since March of 2020. REGN is actionable at current levels with a weekly overbought/oversold reading of 45%. From here, support is offered at $568. |
| SEAS SeaWorld Entertainment, Inc. ($49.89) - Leisure - SEAS broke a quadruple top at $50 today following earnings. This move flipped the trend back to positive, which promotes the stock to a 4 for 5’er. From here, support sits at $44 while SEAS faces resistance at $51 and $58, the stock’s all-time high from June. |
| TROW T. Rowe Price Group, Inc. ($211.44) - Wall Street - TROW shares moved higher today to break a double top at $212 to mark its fourteenth straight buy signal. This 4 for 5'er has been in a positive trend since April of 2020 and on an RS buy signal versus the market since March of 2020. TROW is actionable at current levels with a weekly overbought/oversold reading of 54%. From here, support is offered at $198. |
| WTRG Essential Utilities Inc. ($50.64) - Waste Management - WTRG broke a double top at $50, marking the stock’s second consecutive buy signal and a new 52 week high. WTRG is a 3 for 5’er within the waste management sector that has maintained a long-term market RS buy signal since February 2016, confirming the stock’s superior strength versus the broader market. From here, support sits at $46 while WTRG faces resistance at $54, the stock’s all-time high printed just before the COVID-19 sell-off in February 2020. WTRG yields 2.16%. |
| Name | Option Symbol | Action | Stop Loss |
|---|---|---|---|
| Ameresco Inc. - $65.35 | AMRC2115J65 | Buy the October 65.00 calls at 5.60 | 59.00 |
| Name | Option | Action |
|---|---|---|
| Centene Corporation ( CNC) | Dec. 72.50 Calls | Stopped at 67.00 (CP: 66.85) |
| Home Depot, Inc. ( HD) | Oct. 320.00 Calls | Raise the option stop loss to 17.65 (CP: 19.65) |
| Name | Option Symbol | Action | Stop Loss |
|---|---|---|---|
| Citrix Systems, Inc. - $101.01 | CTXS2117X100 | Buy the December 100.00 puts at 6.30 | 114.00 |
| Name | Option | Action |
|---|---|---|
| Fastly, Inc. Class A (FSLY) | Dec. 55.00 Puts | Raise the option stop loss to 15.25 (CP: 17.25) |
| Name | Option Sym. | Call to Sell | Call Price | Investment for 500 Shares | Annual Called Rtn. | Annual Static Rtn. | Downside Protection |
|---|---|---|---|---|---|---|---|
| United States Steel Corporation $25.24 | X2115J26 | Oct. 26.00 | 2.16 | $11,727.50 | 50.23% | 41.32% | 7.44% |
| Name | Action |
|---|---|
| Cleveland-Cliffs Inc. (CLF) - 23.70 | Sell the October 22.00 Calls. |
| Antero Resources Corp (AR) - 13.27 | Sell the November 15.00 Calls. |
| United States Steel Corporation (X) - 25.24 | Sell the October 25.00 Calls. |
| Cloudflare Inc Class A (NET) - 120.00 | Sell the November 115.00 Calls. |
| Mosaic Company (MOS) - 30.61 | Sell the December 32.00 Calls. |
| Dick's Sporting Goods, Inc. (DKS) - 104.69 | Sell the December 110.00 Calls. |
| Halliburton Company (HAL) - 19.20 | Sell the October 21.00 Calls. |
| The Trade Desk Inc (TTD) - 86.44 | Sell the November 90.00 Calls. |
| Green Plains Inc. (GPRE) - 35.04 | Sell the December 36.00 Calls. |
| Alcoa Inc. (AA) - 38.75 | Sell the November 42.00 Calls. |
| Nucor Corporation (NUE) - 104.90 | Sell the October 105.00 Calls. |
| Biocryst Pharmaceuticals Inc (BCRX) - 16.26 | Sell the December 18.00 Calls. |
| Ford Motor Company (F) - 13.32 | Sell the November 14.00 Calls. |
| Name | Covered Write |
|---|---|
| CommScope Holding Company, Inc. ( COMM - 20.69 ) | November 21.00 covered write. |
Daily Equity & Market Analysis
LISTEN TO PODCAST
Apr 02, 2026
Loading, Please Wait...
