Most Requested Symbols

Today marks the first trading day in the second quarter. As we do at the end of each quarter, we will recap the changes that we have seen throughout the various asset classes.
Reviewing factor performance for Q1 2026
As we do each quarter, we will take today’s report to look across different asset classes and focus in on the best and worst performing funds for the first quarter.
Weekly Rundown Video – April 1, 2026
Weekly rundown with NDW analyst team covering all major asset classes.
Weekly rundown with NDW analyst team covering all major asset classes.
Today marks the first trading day in the second quarter. As we do at the end of each quarter, we will recap the changes that we have seen throughout the various asset classes. Financial markets delivered mixed results across the board, driven by conflict in the Middle East, inflation uncertainty, and concerns regarding the US economy. These trends set the stage for an intriguing second quarter, as we continue looking for areas of strength.
Domestic Equities
Large cap-weighted indices struggled in the first quarter as the S&P 500 ETF Trust (SPY) and the Invesco QQQ Trust (QQQ) fell 4.37% and 5.93%, respectively. However, the Invesco S&P 500 Equal Weight ETF (RSP) was able to finish the quarter in the black with a small gain of 0.61%. Small and mid-caps also shook off the weakness in exhibited in the large cap space. The iShares Russell Midcap ETF (IWR) was the best-performing ETF out of the five US equity ETFs observed with a gain of 1.27%. Large caps still hold a lead on a long-term basis, but this past quarter has raised concerns over softening leadership.
International Equities
International equities moved into the top spot in our DALI asset class rankings in March. While the asset class wasn’t insulated from broader market volatility, both developed and emerging market representatives ended the first quarter with gains above 1%. The iShares MSCI EAFE ETF (EFA) was up a respectable 1.15% while the emerging market representative, iShares MSCI Emerging Markets ETF (EEM), won the quarter with a 3.80% gain.
Commodities
Commodities had a wild quarter as oil prices flew higher while precious metals aggressively pulled back from highs. The iShares S&P GSCI Commodity Indexed Trust (GSG) gained nearly 40% in the first quarter. While gold pulled from highs established during the first quarter, the SPDR Gold Trust (GLD) still gained 8.57%. It’s yet to be seen if the recent run in commodities is a flash in the pan or a long-term development, but action in Q2 should give us some more answers.
Fixed Income
Fixed Income struggled as rates roared higher on inflation fears before backing off to opening year levels. The iShares 7-10 Year Treasury Bond ETF (IEF) was essentially flat for the quarter with a loss of 0.13%. The outlook for rates cuts for the rest of the year has swung wildly over the last few weeks and further muddying the waters for the asset class.


US Equity Smart Beta
Other factors commonly accessible through ETFs today are momentum, low volatility, quality, dividend achiever, and buyback strategies. All these factors are designed to pinpoint a certain investment theme within the marketplace, and systematically allocate to that theme. For instance, the “low volatility” factor is represented by the Invesco S&P 500 Low Volatility ETF (SPLV), a fund that seeks exposure to the 100 stocks with the lowest volatility in the S&P 500. Most of the factors examined offer better performance than the benchmark, the SPDR S&P 500 ETF (SPY), through certain durations. However, no single factor ETF has been the best performer every year, or even most of the years...nor has any single factor ETF been the worst performing every year or most of the years.
Factor Return Observations (US Equities)

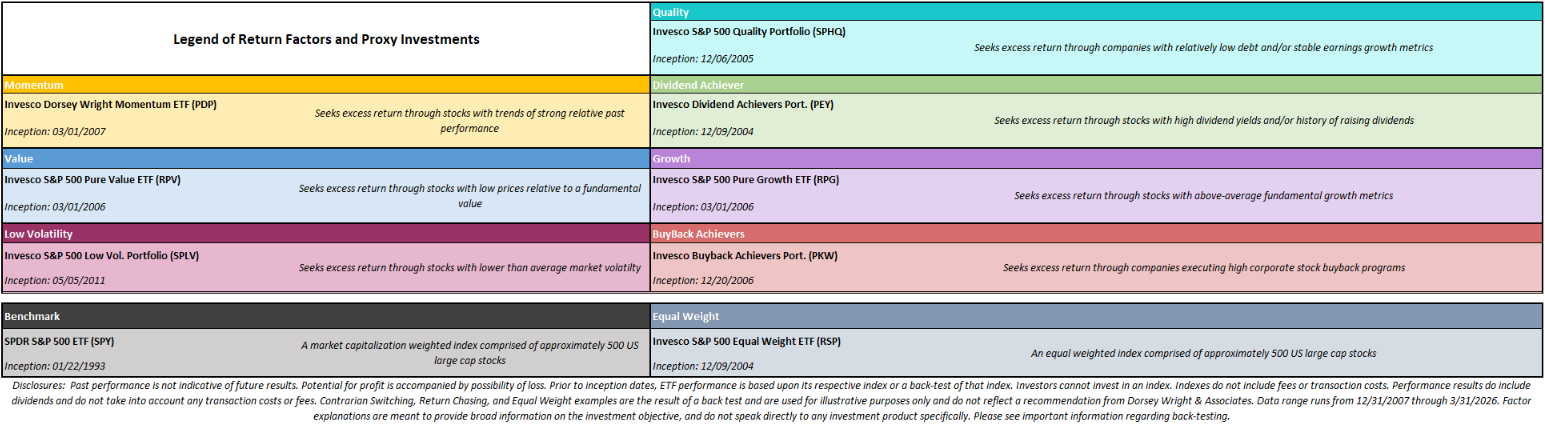
It is About Time in the Factor, Not Trying to Time the Factor
Our goal with the research above is to illustrate the range of available factors and the necessity of discipline in applying these factors over time. We want to promote “good behavior,” as it relates to any investment process or product. This is perhaps the most important observation from the data above; we illustrated the outcomes generated by a few common behaviors using the same investment universe, and the outcomes vary dramatically.
There are the “buy and hold” outcomes, which show buyback and growth as the best performers throughout the entire timeframe, but we also know inherently what comes with a buy and hold commitment to only one group. 2026 has showcased this issue most recently as these factors struggled throughout Q1. Other examples include 2022 or 2000-2002- all tough spans for growth, tougher than many could endure. While buyback has turned it around over the last decade, there was a five year stretch from 2014-2018 where the factor didn’t crack the top half of performance rankings. This can be tough to stomach as other areas continue to excel.
Another approach is to equal weight all seven factors in a portfolio and rebalance that portfolio once a year. This gives you a baseline that notably underperforms the benchmarks over the last 10+ years. We also looked at the hypothetical behavior of buying the best-performing factor from the previous year and holding that factor for the entire next calendar year; we called this “Return Chasing,” and while no portfolio manager markets themselves this way exactly, it is an emotional bias that creeps into many investors’ psyches.
This “Return Chasing” portfolio tracks a hypothetical investor who sees that no strategy could beat the benchmark last year, so they just buy that factor for the next year. As mentioned previously, this has only “worked” in back-to-back full calendar years from 2012-2013… and while growth did well in 2025, return chasing still hasn’t worked quite well over our back test. On a cumulative basis, return chasing has massively underperformed not only the other “strategies,” but also what buying-and-holding almost any other factor would have provided. The factors themselves are not the problem, as many create substantial alpha relative to the market. Bad behavior can create bad returns out of good products, and constantly chasing last year’s best-performing factor often exemplifies that reality.
The opposite of return chasing is the contrarian approach, which buys the worst-performing factor from the previous year and holds it for the subsequent calendar year. The “Contrarian Switching” portfolio illustrates what is missed when an investor dumps a factor for having a bad year. A good stock can become a bad stock and remain such for a long time, so a good factor is less likely to stay perennially out of favor because it should have a process of systematically eliminating bad stocks – this is evidenced by the outperformance of the “Contrarian Switching” strategy, which has beaten the "average" portfolio of equally weighted factors despite a poor stretch the last few years. It is working so far for dividend names.
International Equity Smart Beta
These strategies can also be applied to factor representatives from international equities, which, as we can see below, demonstrate similar tendencies to their domestic counterparts. Note that the representatives below are only for developed market equities, as there has not been enough historical representation of factor exposure in emerging markets to represent a robust examination.
Factor Return Observations (Intl Equities):


As we do each quarter, we will take today’s report to look across different asset classes and focus in on the best and worst performing funds for the first quarter as a whole. Note, during our screen we filtered out leveraged and inverse funds & put in minimum volume and AUM requirements to focus solely on those funds you are most likely to see come across your desk. We also did our best to avoid similar kinds of funds when possible, (to avoid the entirety of our tables being taken up by oil, for example…) but there will likely be similar themes during our analysis.
We will start broadly by peering across all of the different asset groups at once. As you might expect, our top ten performers were littered with energy and commodity options. Outside of those groups, other international names (South Korea and Latin America) found place as top performers. On the flip side, many cryptocurrency founds found their place near the bottom of this quarter's performers once again. However, some emerging market names also found their way to the bottom.
Speaking of international options, our second table dives underneath the hood of that group specifically. Several global options flexed their muscles, with a few countries putting in very constructive quarters. Points of interest come from a another solid performance from Latin American names after a scorching hot 2025. China and India were major detractors from a pure performance perspective, with the two regions becoming some of the biggest laggards within international equities.


The following tables focus on individual sectors and commodities, respectively. Of interest in terms of Q1 upside, energy was be far the biggest bright spot for both the commodity space and sector performances. Oil funds gained 80%, lifting the vast majority of energy ETFs higher. Several basic materials groups also put together a solid three months. Towards the downside, software led the way to the downside, while other technology-focused areas also declined, with the big exception of semiconductors. On the commodities front, laggards came from several precious and industrial metal representatives after what was an extremely strong 2025.


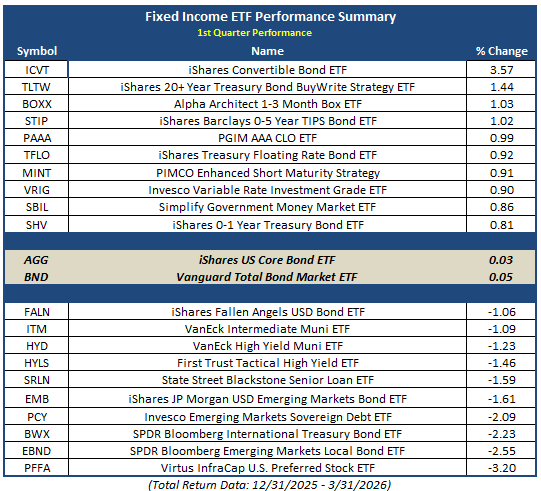
Our last set of tables below detail performance trends for the broader fixed income and currencies space. While fixed income as a whole remains a laggard within our longer-term rankings, there were points of strength within the asset class. Convertibles continue to be the relatively strongest area of fixed income, remaining at the top in terms of performance. Meanwhile, international bond funds has a rough quarter as the dollar and interest rates both rose. Across the currency space, crypto continue to see some of the most downside among any areas of the market. In terms of more traditional currencies, the US Dollar rose 1.7%, causing other currencies to depreciate against the greenback.


Each week the analysts at NDW review and comment on all major asset classes in the global markets. Shown below is the summary or snapshot of the primary technical indicators we follow for multiple areas. Should there be changes mid-week we will certainly bring these to your attention via the report.
| Universe | BP Col & Level (actual) | BP Rev Level | PT Col & Level (actual) | PT Rev Level | HiLo Col & Level (actual) | HiLo Rev Level | 10 Week Col & Level (actual) | 10 Week Rev Level | 30 Week Col & Level (actual) | 30 Week Rev Level |
|---|---|---|---|---|---|---|---|---|---|---|
| ALL |
|
40% |
|
42% |
|
30% |
|
30% |
|
40% |
| NYSE |
|
46% |
|
52% |
|
40% |
|
30% |
|
40% |
| OTC |
|
36% |
|
38% |
|
26% |
|
30% |
|
38% |
| World |
|
38% |
|
44% |
|
|
|
30% |
|
42% |
Remember, these are technical comments only. Just as you must be aware of fundamental data for the stocks we recommend based on technical criteria in the report, so too must you be aware of important data regarding delivery, market moving government releases, and other factors that may influence commodity pricing. We try to limit our technical comments to the most actively traded contracts in advance of delivery, but some contracts trade actively right up to delivery while others taper off well in advance. Be sure you check your dates before trading these contracts. For questions regarding this section or additional coverage of commodities email james.west@nasdaq.com.
Data represented in the table below is through 3/31/2026:
| Symbol | Name | Price | PnF Trend | RS Signal | RS Col. | 200 Day MA | Weekly Mom |
|---|---|---|---|---|---|---|---|
| CL/ | Crude Oil Continuous | 101.38 | Positive | Sell | X | 65.63 | + 14W |
| DBLCIX | Deutsche Bank Liquid Commodities Index | 468.52 | Positive | Sell | O | 460.74 | - 38W |
| DWACOMMOD | NDW Continuous Commodity Index | 1162.79 | Positive | Buy | X | 1042.90 | + 5W |
| GC/ | Gold Continuous | 4647.60 | Positive | Buy | O | 4104.49 | - 4W |
| HG/ | Copper Continuous | 5.59 | Negative | Sell | O | 5.24 | - 10W |
| ZG/ | Corn (Electronic Day Session) Continuous | 457.75 | Positive | Sell | O | 424.44 | + 6W |


Average Level
-22.81
| < - -100 | -100 - -80 | -80 - -60 | -60 - -40 | -40 - -20 | -20 - 0 | 0 - 20 | 20 - 40 | 40 - 60 | 60 - 80 | 80 - 100 | 100 - > |
|---|---|---|---|---|---|---|---|---|---|---|---|
|
Sell signaldia
|
|||||||||||
|
Buy signalSPY
|
|||||||||||
|
Sell signalVOOG
|
|||||||||||
|
Sell signalXLG
|
|||||||||||
|
Sell signalONEQ
|
Buy signaliwm
|
||||||||||
|
Buy signalhyg
|
Buy signalshy
|
||||||||||
|
Buy signalrsp
|
Buy signalEEM
|
||||||||||
|
Sell signalQQQ
|
Sell signalief
|
||||||||||
|
Buy signalfxe
|
Buy signalIJH
|
||||||||||
|
Buy signalVOOV
|
Buy signaltlt
|
||||||||||
|
Sell signalagg
|
Buy signalgld
|
||||||||||
|
Sell signalefa
|
Buy signalijr
|
Buy signalGSG
|
|||||||||
|
Sell signallqd
|
Buy signalicf
|
Buy signaldvy
|
Buy signalGCC
|
Buy signaldx/y
|
Buy signalUSO
|
||||||
| < - -100 | -100 - -80 | -80 - -60 | -60 - -40 | -40 - -20 | -20 - 0 | 0 - 20 | 20 - 40 | 40 - 60 | 60 - 80 | 80 - 100 | 100 - > |
| AGG | iShares US Core Bond ETF |
| USO | United States Oil Fund |
| DIA | SPDR Dow Jones Industrial Average ETF |
| DVY | iShares Dow Jones Select Dividend Index ETF |
| DX/Y | NYCE U.S.Dollar Index Spot |
| EFA | iShares MSCI EAFE ETF |
| FXE | Invesco CurrencyShares Euro Trust |
| GLD | SPDR Gold Trust |
| GSG | iShares S&P GSCI Commodity-Indexed Trust |
| HYG | iShares iBoxx $ High Yield Corporate Bond ETF |
| ICF | iShares Cohen & Steers Realty ETF |
| IEF | iShares Barclays 7-10 Yr. Tres. Bond ETF |
| LQD | iShares iBoxx $ Investment Grade Corp. Bond ETF |
| IJH | iShares S&P 400 MidCap Index Fund |
| ONEQ | Fidelity Nasdaq Composite Index Track |
| QQQ | Invesco QQQ Trust |
| RSP | Invesco S&P 500 Equal Weight ETF |
| IWM | iShares Russell 2000 Index ETF |
| SHY | iShares Barclays 1-3 Year Tres. Bond ETF |
| IJR | iShares S&P 600 SmallCap Index Fund |
| SPY | SPDR S&P 500 Index ETF Trust |
| TLT | iShares Barclays 20+ Year Treasury Bond ETF |
| GCC | WisdomTree Continuous Commodity Index Fund |
| VOOG | Vanguard S&P 500 Growth ETF |
| VOOV | Vanguard S&P 500 Value ETF |
| EEM | iShares MSCI Emerging Markets ETF |
| XLG | Invesco S&P 500 Top 50 ETF |
| Symbol | Company | Sector | Current Price | Action Price | Target | Stop | Notes |
|---|---|---|---|---|---|---|---|
| WBS | Webster Financial Corporation | Banks | $69.42 | hi 60s - low 70s | 91 | 58 | 4 for 5'er, top 25% of BANK sector matrix, one box from peer RS buy, buy on pullback, 2.2% yield |
| CGON | CG Oncology, Inc. | Biomedics/Genetics | $67.69 | hi 50s - low 60s | 80 | 50 | 5 for 5'er, 18 of 162 in BIOM sector matrix, bullish catapult, good R-R |
| BRX | Brixmor Property Group Inc | Real Estate | $28.80 | hi 20s - lo 30s | 38 | 24 | 4 for 5'er, top third of REAL sector matrix, LT pos peer & mkt RS, LT pos trend, bullish triangle, 4% yield, Earn. 4/27 |
| CNX | CNX Resources Corp | Oil | $38.55 | hi 30s - mid 40s | 71 | 33 | 5 TA rating, top 50% of OIL sector matrix, LT RS buy and pos trend, consec buy signals |
| FFIV | F5 Inc. | Internet | $289.31 | 280s - 290s | 344 | 256 | 4 for 5'er, top third of INET sector matrix, LT pos peer RS, spread quad top, Earn. 4/27 |
| INVA | Innoviva, Inc | Drugs | $23.30 | lo-mid 20s | 32.50 | 18.50 | 5 TA rating, top half of drugs sector RS matrix, LT pos trend, LT RS buy, buy-on-pullback |
| ARCB | ArcBest Corp. | Transports/Non Air | $98.36 | low-to-mid 90s | 113 | 79 | 4 for 5'er, one box from market RS buy, top half of favored TRAN sector matrix, good R-R |
| GSK | GlaxoSmithKline Plc. (United Kingdom) ADR | Drugs | $55.19 | hi 40s - mid 50s | 67 | 42 | 5 TA rating, top 25% of DRUG sector matrix, LT pos trend, yield > 3%, buy-on-pullback |
| ADI | Analog Devices, Inc. | Semiconductors | $318.14 | 310s - 330s | 380 | 268 | 4 for 5'er, top half of favored SEMI sector matrix, LT pos market RS, return to buy signal |
| CSCO | Cisco Systems, Inc. | Computers | $77.59 | Upper 70s to lower 80s | 96 | 70 | 5 for 5'er; top quintile of Computers matrix; Pos. Trend since Sept. '24; Bull Triangle on 3/25. |
| CAT | Caterpillar, Inc. | Machinery and Tools | $708.46 | 680s - 720s | 848 | 592 | 5 for 5'er, #1 of 67 in favored MACH sector matrix, LT pos peer & mkt RS, buy on pullback |
| DBD | Diebold Nixdorf Inc | Finance | $75.44 | low-to-mid 70s | 99 | 63 | 5 for 5'er, #3 of 77 in FINA sector matrix, LT pos peer RS, bearish signal reversal, R-R>2.0 |
| NI | Nisource, Inc. | Gas Utilities | $46.66 | mid-hi 40s | 78 | 38 | 5 TA rating, LT pos trend, LT mkt RS buy, consec buy signals |
| GLW | Corning Incorporated | Electronics | $135.97 | hi 130s - 140s | 196 | 120 | 5 for 5'er, #2 of 66 in ELEC sector matrix, quad top breakout, R-R>2.5, Earn. 4/28 |
| Symbol | Company | Sector | Current Price | Action Price | Target | Stop | Notes |
|---|---|---|---|---|---|---|---|
| CPRT | Copart Incorporated | Autos and Parts | $33.20 | hi 30s | 28 | 42 | 1 TA rating, bottom 50% of AUTO sector matrix, NT and mkt RS sell last month, consec sell signals |
| Comment | |||||||
|---|---|---|---|---|---|---|---|
|
|
|||||||
GLW Corning Incorporated R ($141.43) - Electronics - GLW is a 5 for 5'er that ranks second out 66 names in the electronics sector matrix. After giving four consecutive sell signals, GLW returned to a buy signal late last month when it broke a quadruple top at $136 and continued higher to $150. The stock subsequently pulled back to prior support at $128 and reversed up in Tuesday's trading. Long exposure may be added in upper $130s to $140s and we will et our initial stop at $120. We will use the bullish price objective, $196, as our target price, giving us a reward-to-risk ratio north of 2.5. GLW is expected to report earnings on 4/28.
| 162.00 | X | 162.00 | |||||||||||||||||||||||||||
| 160.00 | X | O | X | 160.00 | |||||||||||||||||||||||||
| 158.00 | X | O | X | O | 158.00 | ||||||||||||||||||||||||
| 156.00 | X | O | X | O | 156.00 | ||||||||||||||||||||||||
| 154.00 | X | O | 3 | O | 154.00 | ||||||||||||||||||||||||
| 152.00 | X | O | X | O | X | 152.00 | |||||||||||||||||||||||
| 150.00 | X | O | X | O | X | O | X | 150.00 | |||||||||||||||||||||
| 148.00 | X | O | O | X | O | X | O | 148.00 | |||||||||||||||||||||
| 146.00 | X | O | X | O | X | O | 146.00 | ||||||||||||||||||||||
| 144.00 | X | O | X | O | X | O | 144.00 | ||||||||||||||||||||||
| 142.00 | X | O | O | X | O | 142.00 | |||||||||||||||||||||||
| 140.00 | X | O | X | O | 140.00 | ||||||||||||||||||||||||
| 138.00 | X | O | X | X | O | 138.00 | |||||||||||||||||||||||
| 136.00 | X | X | O | X | O | X | O | 136.00 | |||||||||||||||||||||
| 134.00 | X | O | X | O | X | O | X | X | X | X | O | X | 134.00 | ||||||||||||||||
| 132.00 | X | O | X | O | X | O | X | O | X | O | X | O | X | O | X | 132.00 | |||||||||||||
| 130.00 | X | O | X | O | X | O | X | O | X | O | X | O | X | O | X | 130.00 | |||||||||||||
| 128.00 | X | O | X | O | X | O | O | X | O | X | O | O | Mid | 128.00 | |||||||||||||||
| 126.00 | X | O | O | X | O | O | X | 126.00 | |||||||||||||||||||||
| 124.00 | X | O | X | O | 124.00 | ||||||||||||||||||||||||
| 122.00 | X | O | 122.00 | ||||||||||||||||||||||||||
| 120.00 | X | 120.00 | |||||||||||||||||||||||||||
| 118.00 | X | 118.00 | |||||||||||||||||||||||||||
| 116.00 | X | X | 116.00 | ||||||||||||||||||||||||||
| 114.00 | X | O | X | 114.00 | |||||||||||||||||||||||||
| 112.00 | X | X | O | X | 112.00 | ||||||||||||||||||||||||
| 110.00 | X | O | X | O | X | 110.00 | |||||||||||||||||||||||
| 108.00 | X | O | 2 | O | X | 108.00 | |||||||||||||||||||||||
| 106.00 | X | O | X | O | 106.00 | ||||||||||||||||||||||||
| 104.00 | X | O | X | 104.00 | |||||||||||||||||||||||||
| 102.00 | X | O | X | 102.00 | |||||||||||||||||||||||||
| 100.00 | X | O | 100.00 | ||||||||||||||||||||||||||
| 99.00 | X | 99.00 | |||||||||||||||||||||||||||
| 98.00 | X | 98.00 | |||||||||||||||||||||||||||
| 97.00 | X | 97.00 | |||||||||||||||||||||||||||
| 96.00 | X | 96.00 | |||||||||||||||||||||||||||
| 95.00 | X | X | 95.00 | ||||||||||||||||||||||||||
| 94.00 | X | O | X | 94.00 | |||||||||||||||||||||||||
| 93.00 | X | O | X | 93.00 | |||||||||||||||||||||||||
| 92.00 | X | O | 92.00 | ||||||||||||||||||||||||||
| 91.00 | X | 91.00 | |||||||||||||||||||||||||||
| 90.00 | X | • | 90.00 | ||||||||||||||||||||||||||
| 89.00 | X | • | 89.00 | ||||||||||||||||||||||||||
| 88.00 | X | • | 88.00 | ||||||||||||||||||||||||||
| 87.00 | O | X | • | 87.00 | |||||||||||||||||||||||||
| 86.00 | O | X | • | 86.00 | |||||||||||||||||||||||||
| 85.00 | O | X | • | 85.00 | |||||||||||||||||||||||||
| 84.00 | O | • | 84.00 |
| BA The Boeing Company ($207.32) - Aerospace Airline - BA returned to a buy signal with intraday action to open up Q2. Despite this, the name remains a poor attribute stock at the time of this writing. With that in mind, continue to limit exposure where possible. Support is found at the bottom of the trading band at $188. Resistance is seen first at the 2025 highs around $250. |
| GS Goldman Sachs Group, Inc. ($860.55) - Wall Street - GS shares moved higher today to break a double top at $864 to mark its first buy signal. This 5 for 5'er has been in a positive trend since May 2025 and on an RS buy signal versus the market since May 2024. GS shares are actionable at current levels with a weekly overbought/oversold reading of -26%. From here, support is offered at $800 and $784. |
| MRVL Marvell Technology Inc. ($106.71) - Semiconductors - MRVL rose Wednesday to break a double top at $102 before reaching $106 intraday. This 4 for 5'er moved to a positive trend in March and sits in the top half of the semiconductors sector RS matrix. The weight of the technical evidence is favorable and improving. However, MRVL is in overbought territory. Initial support is seen at $87 and $86. |
| SNX TD SYNNEX Corporation ($186.29) - Computers - SNX pushed higher Wednesday to break a double top at $166, marking a second consecutive buy signal before climbing over 10% intraday to a new all-time high at $186. The stock also saw weekly momentum recently flip positive, suggesting the potential for further upside from here. However, SNX is now in a heavily overbought position. Exposure may best be served waiting for a pullback or normalization in the trading band. Initial support is seen at $150. |
| Name | Option Symbol | Action | Stop Loss |
|---|---|---|---|
| General Motors - $75.04 | O: 26I75.00D18 | Buy the September 75.00 calls at 8.45 | 68.00 |
| Name | Option | Action |
|---|---|---|
| Target Corporation ( TGT) | May. 115.00 Calls | Raise the option stop loss to 6.95 (CP: 8.95) |
| Philip Morris International Inc. ( PM) | Sep. 165.00 Calls | Stopped at 152.00 (CP: 157.22) |
| Name | Option Symbol | Action | Stop Loss |
|---|---|---|---|
| Zoom Communications Inc. - $80.70 | O: 26T82.50D21 | Buy the August 82.50 puts at 9.05 | 88.00 |
| Name | Option | Action |
|---|---|---|
| General Mills, Inc. ( GIS) | Jun. 47.50 Puts | Stopped at 9.50 (CP: 9.20) |
| Wells Fargo & Company ( WFC) | Jul. 80.00 Puts | Stopped at 5.80 (CP: 5.30) |
| T-Mobile US Inc. ( TMUS) | Jun. 210.00 Puts | Initiate an option stop loss of 12.20 (CP: 14.20) |
| Freeport-McMoRan Inc. ( FCX) | Jul. 55.00 Puts | Stopped at 59.00 (CP: 61.23) |
| Name | Option Sym. | Call to Sell | Call Price | Investment for 500 Shares | Annual Called Rtn. | Annual Static Rtn. | Downside Protection |
|---|---|---|---|---|---|---|---|
| Dell Technologies Inc Class C $ 164.13 | O: 26E170.00D15 | May. 170.00 | 11.85 | $ 79,868.10 | 44.49% | 52.11% | 5.91% |
| Name | Action |
|---|---|
| Fortinet Inc. ( FTNT) - 81.72 | Sell the May 85.00 Calls. |
| Invesco PLC ( IVZ) - 24.29 | Sell the May 24.00 Calls. |
| Palantir Technologies Inc. Class A ( PLTR) - 146.28 | Sell the July 150.00 Calls. |
| Name | Covered Write |
|---|---|
| Halliburton Company ( HAL - 38.99 ) | May 40.00 covered write. |
Daily Equity & Market Analysis
LISTEN TO PODCAST
Mar 26, 2026
Loading, Please Wait...
