Most Requested Symbols

Friday’s trading marked a fifth consecutive week of negative action for the majority of US equity indices.
The second year in a presidential term is typically of particular importance to the stock market, and 2026 has already exhibited themes typical of an average midterm election year, suggesting that historical patterns may offer guidance for what the rest of the year has in store.
Weekly Rundown Video – Mar 26, 2026
Weekly rundown with NDW analyst team covering all major asset classes.
Weekly rundown with NDW analyst team covering all major asset classes.
Friday’s trading marked a fifth consecutive week of negative action for the majority of US equity indices. The exceptions were the Russell 2000 Index (RUT), which rose 46 basis points last week, and the S&P 500 Equal Weight Index (SPXEWI), which experienced its fourth consecutive week of negative action. Alongside the negative weekly performance, U.S. index charts either returned to a column of Os or generated additional sell signals on their default point-and-figure trend charts. Following reversals into Os during Thursday’s trading, the S&P 500 Index (SPX) and the Dow Jones Industrial Average (.DJIA) registered their third and fifth consecutive sell signals, respectively. While the Dow now trades at its lowest level since September, the S&P 500 remains at its lowest chart position since August. Near-term support for the Dow is found at 45,000 and 44,600, while support for the S&P 500 lies at 6,250 and 6,100.
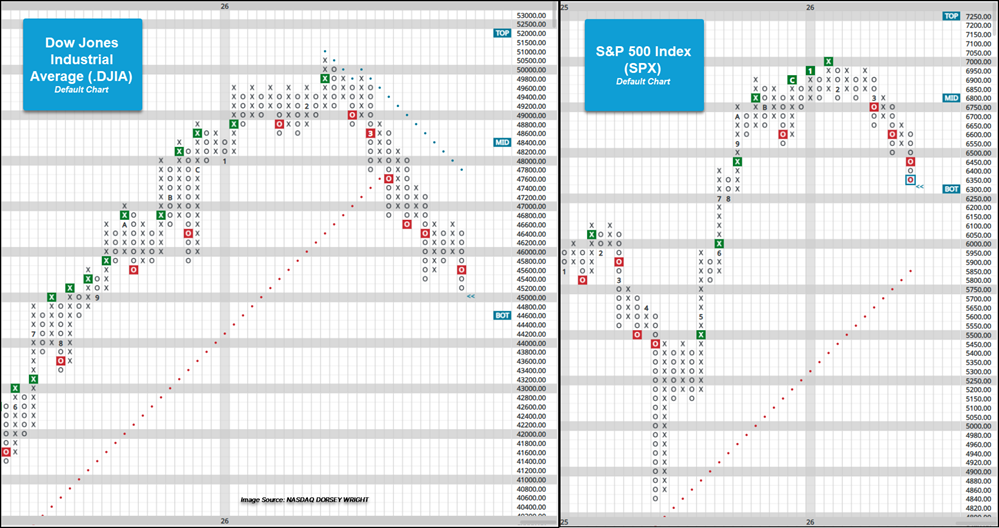
In both cases, the S&P 500 and the Dow have not experienced five or more consecutive weeks of negative action since 2022. That year saw the indices decline for seven and eight weeks, respectively, spanning the latter half of April through the first third of May. Dating back to 1957 for the S&P 500 Index and 1900 for the Dow, the indices have recorded 27 (SPX) and 65 (.DJIA) instances of five or more consecutive weeks of negative performance.
The tables below examine the forward performance of both indices following five or more weeks of negative action. On average, returns immediately following such streaks are mixed to negative in the short- to intermediate-term. It is worth noting that the data does encompass five week streaks that continue on to six, seven, and eight weeks (the longest period of negative weekly action), impacting short-term returns. Intermediate-term returns don’t overwhelmingly improve, suggesting periods of consolidation or additional negative action in the months after seeing five weeks of negative action. Long-term returns improve, but suggest periods of turbulence have been seen as well.
With the first quarter nearing a close and the current streak of weekly negative performance ongoing, investors are increasingly focused on whether equity indices can establish a foundation as the second quarter begins. Should domestic equity indices end their streak of weekly losses early in Q2, investors will see if sustained improvement can return or if the market is ready for another bout of volatility.


The second year in a presidential term is typically of particular importance to the stock market, as early policy optimism may fade while midterm elections introduce additional uncertainty. There have been plenty of reasons for downside over the last quarter, but many of them have been indirectly tied to politics. While investors are still months away from the midterm elections in November, 2026 has already exhibited themes typical of an average midterm election year, suggesting that historical patterns may offer guidance for what the rest of 2026 has in store.
The second year of a presidential term is most notable for coinciding with the weakest domestic equity returns among the four years in the presidential cycle. Specifically, the market has averaged roughly a 12% return in non‑midterm years since 1960. In contrast, during midterm election years, the S&P 500 has historically averaged a 1% decline, underscoring the significant underperformance seen in second‑year periods. Furthermore, some of the worst market performances on record have occurred during midterm years, including three of the four worst years for the S&P 500.

However, there are signs that support optimism for the later part of the year. To begin with, midterm election years often see markets bottom before rallying in the back half of the year. From the start of October through the rest of the year, SPX has averaged a return of more than 5% in the fourth quarter alone. If the market continues to decline or enters a bear market, October appears to be the most likely point for a bottom, especially given the month’s reputation as the “bear killer.” Additionally, the third year of a presidential term is easily the strongest, averaging a full-year gain of 17.2%. If the market can hold on until the last quarter, it could see seasonal tailwinds that push it higher over the following months and year ahead.

Another major theme in 2026 has been the underperformance of large‑cap stocks relative to small caps. While small caps and the Russell 2000 are down roughly 1% in 2026, they are still outperforming the S&P 500 by more than 5%, which would mark the largest advantage for the Russell 2000 since 2016. Interestingly, previous midterm election years have also tended to show small‑cap outperformance in the first quarter. Specifically, the Russell 2000 has averaged a 2.4% return in the first quarter of midterm years, compared with a 0.2% decline for the S&P 500. However, from the end of the first quarter onward, the S&P 500 averages a rest-of-year return that’s 3% higher than the Russell 2000 in midterm years, offering some optimism for large caps.

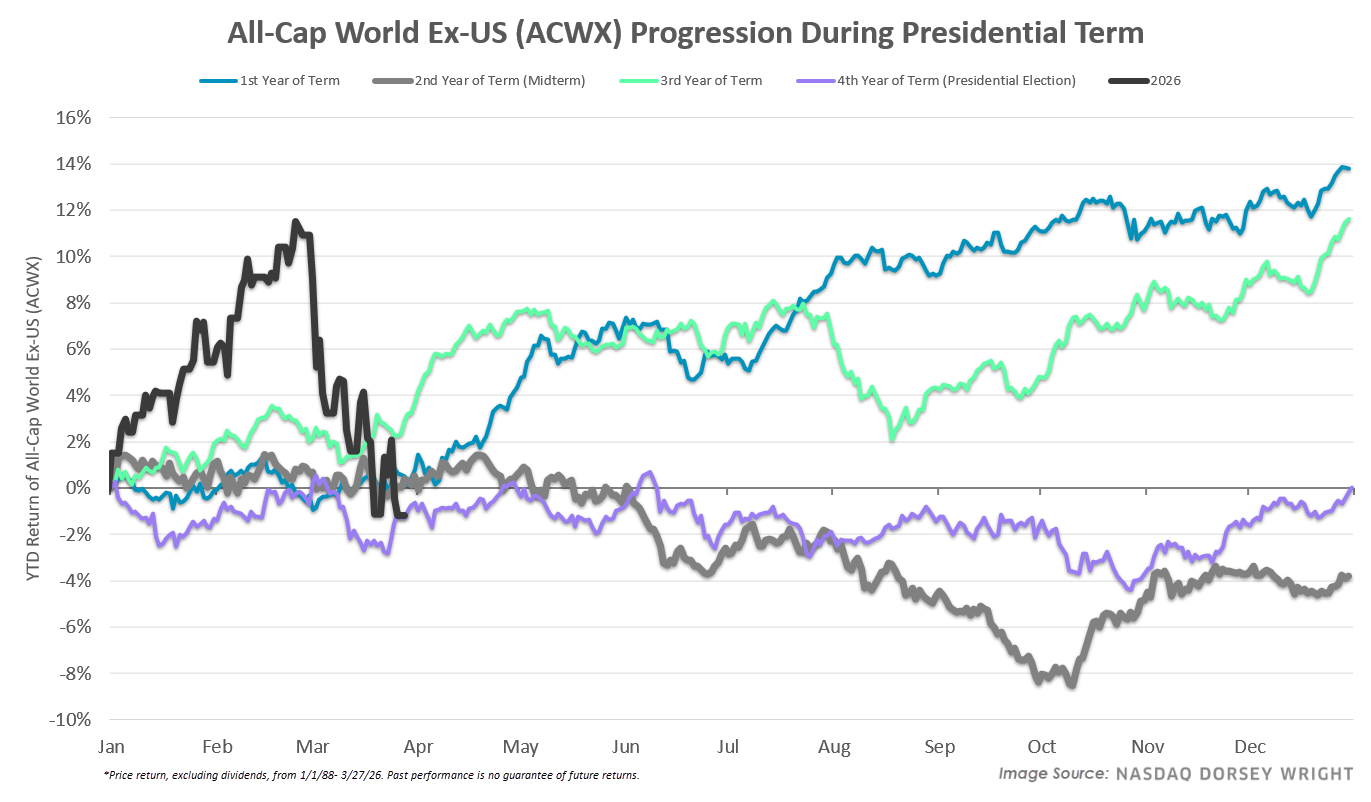
Although international equities operate on entirely different continents than the US, the asset class is not insulated from the effects of US policy, with the conflict involving Iran serving as a recent example. The All-Cap World Ex-US ETF (ACWX) was up by almost 12% in the back half of February, but following US military action in Iran and the resulting surge in energy prices, the fund has since erased its prior gains. Previous US midterm election years have also been challenging for international equities, with the group averaging a full‑year decline of 4%, which is the worst performance of any presidential‑cycle year since 1988, even though they typically recoup some losses in the final quarter.
Overall, midterm election years have historically offered more volatility than any other part of the presidential cycle, so investors should brace for continued uncertainty, particularly as global unrest and conflict persist. The one silver lining is that a potential resolution of uncertainty, whether that be the conflict in Iran or midterm elections, could create an opportunity for the market to rebound, even if stocks sell off further in the near term.
Average Level
-46.88
| < - -100 | -100 - -80 | -80 - -60 | -60 - -40 | -40 - -20 | -20 - 0 | 0 - 20 | 20 - 40 | 40 - 60 | 60 - 80 | 80 - 100 | 100 - > |
|---|---|---|---|---|---|---|---|---|---|---|---|
|
Buy signalSPY
|
Sell signalONEQ
|
Buy signalEEM
|
|||||||||
|
Sell signaldia
|
Buy signalVOOV
|
Buy signaliwm
|
|||||||||
|
Sell signalXLG
|
Sell signalQQQ
|
Sell signaltlt
|
|||||||||
|
Sell signallqd
|
Buy signalrsp
|
Buy signalIJH
|
|||||||||
|
Sell signalVOOG
|
Buy signalshy
|
Buy signalicf
|
|||||||||
|
Sell signalagg
|
Sell signalief
|
Buy signalijr
|
Buy signalUSO
|
||||||||
|
Buy signalhyg
|
Sell signalefa
|
Buy signalfxe
|
Sell signalgld
|
Buy signaldvy
|
Buy signalGCC
|
Buy signaldx/y
|
Buy signalGSG
|
||||
| < - -100 | -100 - -80 | -80 - -60 | -60 - -40 | -40 - -20 | -20 - 0 | 0 - 20 | 20 - 40 | 40 - 60 | 60 - 80 | 80 - 100 | 100 - > |
| AGG | iShares US Core Bond ETF |
| USO | United States Oil Fund |
| DIA | SPDR Dow Jones Industrial Average ETF |
| DVY | iShares Dow Jones Select Dividend Index ETF |
| DX/Y | NYCE U.S.Dollar Index Spot |
| EFA | iShares MSCI EAFE ETF |
| FXE | Invesco CurrencyShares Euro Trust |
| GLD | SPDR Gold Trust |
| GSG | iShares S&P GSCI Commodity-Indexed Trust |
| HYG | iShares iBoxx $ High Yield Corporate Bond ETF |
| ICF | iShares Cohen & Steers Realty ETF |
| IEF | iShares Barclays 7-10 Yr. Tres. Bond ETF |
| LQD | iShares iBoxx $ Investment Grade Corp. Bond ETF |
| IJH | iShares S&P 400 MidCap Index Fund |
| ONEQ | Fidelity Nasdaq Composite Index Track |
| QQQ | Invesco QQQ Trust |
| RSP | Invesco S&P 500 Equal Weight ETF |
| IWM | iShares Russell 2000 Index ETF |
| SHY | iShares Barclays 1-3 Year Tres. Bond ETF |
| IJR | iShares S&P 600 SmallCap Index Fund |
| SPY | SPDR S&P 500 Index ETF Trust |
| TLT | iShares Barclays 20+ Year Treasury Bond ETF |
| GCC | WisdomTree Continuous Commodity Index Fund |
| VOOG | Vanguard S&P 500 Growth ETF |
| VOOV | Vanguard S&P 500 Value ETF |
| EEM | iShares MSCI Emerging Markets ETF |
| XLG | Invesco S&P 500 Top 50 ETF |

| Symbol | Company | Sector | Current Price | Action Price | Target | Stop | Notes |
|---|---|---|---|---|---|---|---|
| WBS | Webster Financial Corporation | Banks | $68.07 | hi 60s - low 70s | 91 | 58 | 4 for 5'er, top 25% of BANK sector matrix, one box from peer RS buy, buy on pullback, 2.2% yield |
| CGON | CG Oncology, Inc. | Biomedics/Genetics | $64.66 | hi 50s - low 60s | 80 | 50 | 5 for 5'er, 18 of 162 in BIOM sector matrix, bullish catapult, good R-R, Earn. 3/26 |
| BRX | Brixmor Property Group Inc | Real Estate | $28.38 | hi 20s - lo 30s | 38 | 24 | 4 for 5'er, top third of REAL sector matrix, LT pos peer & mkt RS, LT pos trend, bullish triangle, 4% yield |
| CNX | CNX Resources Corp | Oil | $40.58 | hi 30s - mid 40s | 71 | 33 | 5 TA rating, top 50% of OIL sector matrix, LT RS buy and pos trend, consec buy signals |
| FFIV | F5 Inc. | Internet | $282.03 | 280s - 290s | 344 | 256 | 4 for 5'er, top third of INET sector matrix, LT pos peer RS, spread quad top |
| INVA | Innoviva, Inc | Drugs | $22.66 | lo-mid 20s | 32.50 | 18.50 | 5 TA rating, top half of drugs sector RS matrix, LT pos trend, LT RS buy, buy-on-pullback |
| ARCB | ArcBest Corp. | Transports/Non Air | $92.59 | low-to-mid 90s | 113 | 79 | 4 for 5'er, one box from market RS buy, top half of favored TRAN sector matrix, good R-R |
| GSK | GlaxoSmithKline Plc. (United Kingdom) ADR | Drugs | $53.84 | hi 40s - mid 50s | 67 | 42 | 5 TA rating, top 25% of DRUG sector matrix, LT pos trend, yield > 3%, buy-on-pullback |
| ADI | Analog Devices, Inc. | Semiconductors | $307.44 | 310s - 330s | 380 | 268 | 4 for 5'er, top half of favored SEMI sector matrix, LT pos market RS, return to buy signal |
| CSCO | Cisco Systems, Inc. | Computers | $79.92 | Upper 70s to lower 80s | 96 | 70 | 5 for 5'er; top quintile of Computers matrix; Pos. Trend since Sept. '24; Bull Triangle on 3/25. |
| CAT | Caterpillar, Inc. | Machinery and Tools | $695.40 | 680s - 720s | 848 | 592 | 5 for 5'er, #1 of 67 in favored MACH sector matrix, LT pos peer & mkt RS, buy on pullback |
| DBD | Diebold Nixdorf Inc | Finance | $75.01 | low-to-mid 70s | 99 | 63 | 5 for 5'er, #3 of 77 in FINA sector matrix, LT pos peer RS, bearish signal reversal, R-R>2.0 |
| Symbol | Company | Sector | Current Price | Action Price | Target | Stop | Notes |
|---|---|---|---|---|---|---|---|
| CPRT | Copart Incorporated | Autos and Parts | $32.43 | hi 30s | 28 | 42 | 1 TA rating, bottom 50% of AUTO sector matrix, NT and mkt RS sell last month, consec sell signals |
| Symbol | Company | Sector | Current Price | Action Price | Target | Stop | Notes |
|---|---|---|---|---|---|---|---|
| DGII | Digi International Inc | Telephone | $47.48 | upper 40s to lower 50s | 61 | 40 | DGII has fallen to a sell signal. OK to hold here. Maintain $40 stop. |
| Comment | |||||||
|---|---|---|---|---|---|---|---|
|
|
|||||||
DBD Diebold Nixdorf Inc R ($74.42) - Finance - DBD is a 5 for 5'er that ranks third of 77 names in the finance sector matrix and has been on a peer RS buy signal since 2023. After giving three consecutive sell signals, DBD rallied from a previous consolidation range, and returned to a buy signal last week when it completed a bearish signal reversal at $78. Long exposure may be added in the low-to-mid $70s and we will set our initial stop at $63, which would take out DBD's 2026 low. We will use the bullish price objective, $99, as our target price, giving us a reward-to-risk ratio north of 2.0.
| 26 | |||||||||||||||||||||||||||||
| 84.00 | X | X | 84.00 | ||||||||||||||||||||||||||
| 83.00 | X | O | X | O | 83.00 | ||||||||||||||||||||||||
| 82.00 | X | O | X | O | 82.00 | ||||||||||||||||||||||||
| 81.00 | X | O | X | O | 3 | 81.00 | |||||||||||||||||||||||
| 80.00 | X | O | X | O | X | O | X | 80.00 | |||||||||||||||||||||
| 79.00 | X | O | O | X | O | X | O | 79.00 | |||||||||||||||||||||
| 78.00 | X | O | O | X | O | 78.00 | |||||||||||||||||||||||
| 77.00 | X | O | X | X | O | 77.00 | |||||||||||||||||||||||
| 76.00 | X | O | X | O | X | O | 76.00 | ||||||||||||||||||||||
| 75.00 | X | O | X | O | X | O | Mid | 75.00 | |||||||||||||||||||||
| 74.00 | X | O | X | O | X | 74.00 | |||||||||||||||||||||||
| 73.00 | X | O | O | X | 73.00 | ||||||||||||||||||||||||
| 72.00 | X | X | X | X | X | O | X | 72.00 | |||||||||||||||||||||
| 71.00 | X | O | X | O | X | O | 2 | O | X | O | 71.00 | ||||||||||||||||||
| 70.00 | X | O | X | O | X | O | X | O | X | 70.00 | |||||||||||||||||||
| 69.00 | X | X | O | O | O | X | O | 69.00 | |||||||||||||||||||||
| 68.00 | X | O | X | O | X | 68.00 | |||||||||||||||||||||||
| 67.00 | X | O | X | O | 67.00 | ||||||||||||||||||||||||
| 66.00 | X | C | 1 | X | • | 66.00 | |||||||||||||||||||||||
| 65.00 | X | O | X | O | X | • | 65.00 | ||||||||||||||||||||||
| 64.00 | X | O | X | X | O | • | 64.00 | ||||||||||||||||||||||
| 63.00 | X | O | X | O | X | • | 63.00 | ||||||||||||||||||||||
| 62.00 | X | O | X | O | X | • | 62.00 | ||||||||||||||||||||||
| 61.00 | X | O | O | X | • | 61.00 | |||||||||||||||||||||||
| 60.00 | B | X | O | • | Bot | 60.00 | |||||||||||||||||||||||
| 59.00 | X | O | X | • | 59.00 | ||||||||||||||||||||||||
| 58.00 | X | O | X | • | 58.00 | ||||||||||||||||||||||||
| 57.00 | X | O | X | • | 57.00 | ||||||||||||||||||||||||
| 56.00 | X | O | X | • | 56.00 | ||||||||||||||||||||||||
| 55.00 | O | • | 55.00 | ||||||||||||||||||||||||||
| 26 |
| AA Alcoa Inc. ($62.46) - Metals Non Ferrous - AA returned to a buy signal Monday when it broke a double top at $60 and continued higher, returning to a positive trend with a move to $66. The positive trend change will promote AA to a 4 for 5'er and the stock ranks first out of 21 names in the non-ferrous metals sector matrix. From here, AA faces overhead resistance at $68, a level from which is has reversed down three times since the beginning of March. Meanwhile, support can be found at $56. |
| BSX Boston Scientific Corporation ($62.86) - Healthcare - BSX reversed into Os and completed a double bottom break at $67, marking its fifth consecutive sell signal and an intraday low below $62. The 2 for 5'er moved down from a 3 in January after moving into a negative trend. Additionally, the stock ranks near the bottom of the healthcare sector matrix. The weekly OBOS indicates that the stock is in heavily oversold territory, so wait for the 10-week trading band to normalize before selling your position. Initial resistance can be seen at $71, with additional resistance at $76. |
| CENX Century Aluminum Co ($52.65) - Metals Non Ferrous - CENX returned to a buy signal Monday when it broke a double top at $52 and continued higher to $59, where it now sits against resistance. Monday's move adds to a favorable technical outlook as CENX is a 4 for 5'er that ranks in the top decile of the non-ferrous metals sector matrix. From here, the first level of support sits at $48. |
| FSLR First Solar, Inc. ($184.39) - Electronics - FSLR declined Monday to break a double bottom at $184, marking a seventh consecutive sell signal. This 1 for 5'er has been in a negative trend since February and sits in the bottom quintile of the electronics sector RS matrix. The weight of the technical evidence is weak and deteriorating. Further support may be seen at $178 from last August. Overhead resistance may be seen at $194. |
| NRG NRG Energy, Inc. ($140.29) - Utilities/Electricity - NRG broke a double bottom at $144 for a second sell signal as shares fell down to $140. The move violates support that dates to September of last year and brings the chart to its lowest level since May of last year. Support for the 2 for 5'er now resides at prior resistace in the $110 and $100 range. |
| RGLD Royal Gold Inc ($237.01) - Precious Metals - RGLD returned to a buy signal Monday when it broke a double top at $240. The outlook for the stock remains, negative, however, as RGLD is a 1 for 5'er and ranks in the bottom half of the precious metals sector matrix. From here, the first level of support sits at $224; meanwhile, the first level of resistance is RGLD's bearish resistance line at $276. |
| TOL Toll Brothers, Inc. ($131.09) - Building - TOL broke a double bottom at $130 for a fifth sell signal since peaking at $168 in February. The stock has witnessed its peer RS chart return to Os and its default trend chart move into a negative trend, dropping the stock down to a 3 for 5'er. Support lies at current chart levels, while additional can be found at $124 and $118. |

| Name | Option Symbol | Action | Stop Loss |
|---|---|---|---|
| Corteva Inc - $82.92 | O: 26E80.00D15 | Buy the May 80.00 calls at 6.05 | 76.00 |
| Name | Option | Action |
|---|---|---|
| Cisco Systems, Inc. ( CSCO) | Jun. 80.00 Calls | Stopped at 4.65 (CP: 3.50) |
| Name | Option Symbol | Action | Stop Loss |
|---|---|---|---|
| Salesforce Inc. - $183.47 | O: 26Q185.00D15 | Buy the May 185.00 puts at 12.35 | 200.00 |
| Name | Option | Action |
|---|---|---|
| Abbott Laboratories ( ABT) | Aug. 115.00 Puts | Raise the option stop loss to 12.00 (CP: 14.00) |
| PepsiCo, Inc. ( PEP) | Jul. 160.00 Puts | Stopped at 11.45 (CP: 10.55) |
| Wells Fargo & Company ( WFC) | Jul. 80.00 Puts | Raise the option stop loss to 5.80 (CP: 7.80) |
| PDD Holdings Inc. ( PDD) | Jul. 105.00 Puts | Initiate an option stop loss of 9.75 (CP: 11.75) |
| Name | Option Sym. | Call to Sell | Call Price | Investment for 500 Shares | Annual Called Rtn. | Annual Static Rtn. | Downside Protection |
|---|---|---|---|---|---|---|---|
| Merck & Co., Inc. $ 119.63 | O: 26G120.00D17 | Jul. 120.00 | 7.45 | $ 55,907.30 | 20.98% | 18.55% | 5.25% |
| Name | Action |
|---|---|
| Fortinet Inc. ( FTNT) - 78.20 | Sell the May 85.00 Calls. |
| Invesco PLC ( IVZ) - 23.20 | Sell the May 24.00 Calls. |
| DuPont de Nemours Inc. ( DD) - 45.26 | Sell the May 45.00 Calls. |
| Palantir Technologies Inc. Class A ( PLTR) - 143.06 | Sell the July 150.00 Calls. |
| Citizens Financial Group Inc ( CFG) - 57.78 | Sell the July 60.00 Calls. |
| Name | Covered Write |
|---|---|
| Intel Corporation ( INTC - 43.13 ) | May 49.00 covered write. |
| Micron Technology, Inc. ( MU - 357.22 ) | June 420.00 covered write. |
Daily Equity & Market Analysis
LISTEN TO PODCAST
Mar 26, 2026
Loading, Please Wait...
