We take a look at how active managers fared across various markets in the first quarter.
While the first quarter of 2021 was not particularly volatile, especially when compared with the prior year, there was quite a bit of shuffling nonetheless. After leading the DALI domestic equity sector rankings almost continuously for three-plus years (except for a few short weeks in June ’20 when it fell to second) technology ceded its leadership and fell to fifth. Meanwhile, financials and energy climbed from near the bottom of the rankings all the way to their current positions in the top three. After underperforming for much the last several years, value came back into favor, significantly outperforming growth in both the large and small cap categories. After steadily rising in 4Q20, US Treasury yields accelerated dramatically. The US Treasury 10-year Yield Index TNX topped out at 1.75% after starting the quarter at under 1%, resulting in large declines for long-duration bonds, which had been among the best fixed income performers in 2020.
The shifting market landscape of the first quarter offered an opportunity for active managers to outperform their passive benchmarks. For example, large cap equity managers could have gained an advantage over the S&P 500 SPX by underweighting technology, the largest sector in the index by weight, and overweighting areas like financials and energy, while active fixed managers would have benefited from reducing the duration of their portfolios to reduce the impact of rising rates.
Of course, just because there was an opportunity for outperformance does not mean that managers were able to capitalize on it. Moreover, outperformance (or lack thereof) by active managers in one market does not mean that active management outperformed across the board. As we have discussed previously, the key determinate of which is superior, active or passive, is the level of market efficiency. The level of efficiency varies across markets, so when comparing passive vs. active management we need to do so on a market-by-market basis. Today, we’ll take a look at the performance rankings of several passive benchmarks to see how active management fared in the first quarter of 2020; if the passive benchmark ranked in the bottom two quartiles (below the 50th percentile) then a majority of the active managers in that market were able to outperform. Conversely, if the benchmark was below the 50th percentile, then most active managers in the space underperformed. Today we are looking only at how active management fared during the last quarter, so if you would like to see how it’s done over longer time periods, you can find that information in this piece from last year that examined rolling five-year rankings.
Large Cap Domestic Equity
The S&P 500 generated a total return of just under 6.2% in 1Q21, however, the index finished in the third quartile of the eVestment US large cap equity universe. This may be one of the more surprising results - over the past several years domestic large cap equity has been one of the most difficult markets for active managers. In our longer-term piece last year, which looked at rolling-five year returns, there was not a single period in which the S&P 500 finished below the 50th percentile. While one quarter's results are certainly not enough to say that active is back in favor in large cap, the fact that most active managers were able to outperform the benchmark in a quarter with generally strong returns, may mean that active management still has something to offer in the large cap space, which has seen large asset flows into passive strategies.

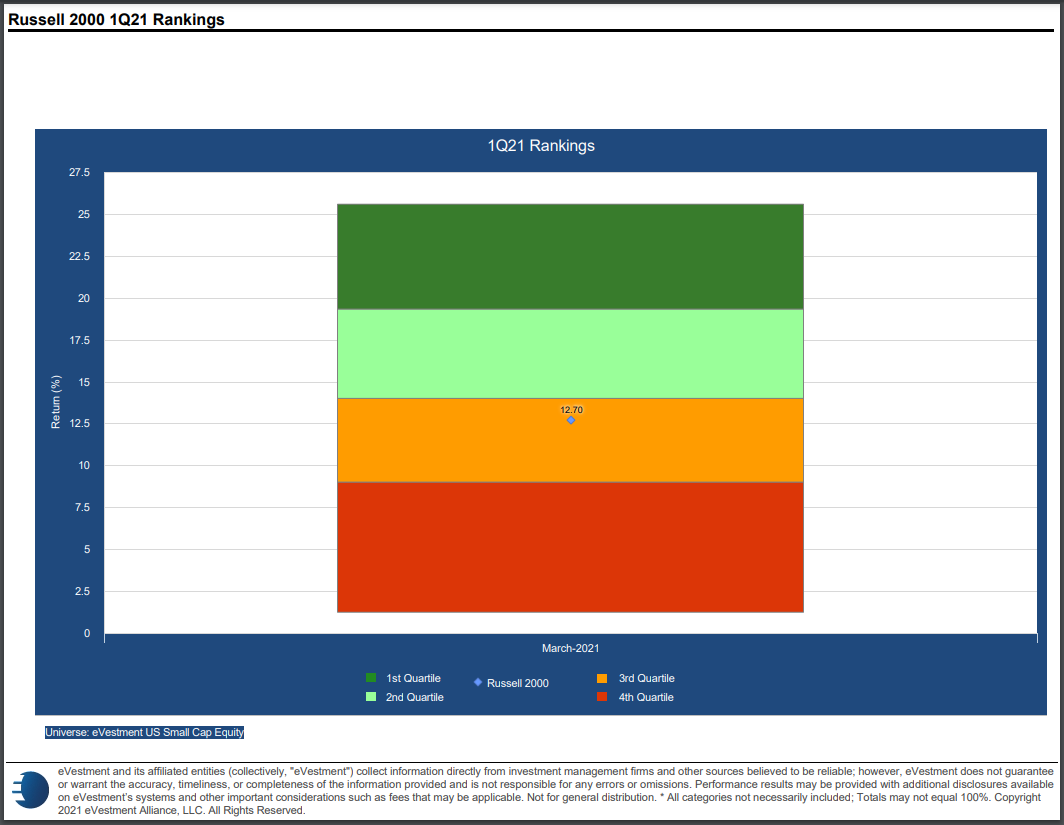
Small Cap Domestic Equity
The Russell 2000 also delivered strong absolute numbers in the third quarter and finished below the 50th percentile. This is perhaps less surprising than the result in large cap as small cap has generally been more favorable to active managers over the long-term.
International Developed Equity
Developed international managers also generally outperformed their benchmark as the MSCI EAFE Index finished in the third quartile. As with small cap equity, this is mostly in line with what we've seen over the longer-term as the passive index has often finished at or below the halfway mark.

Emerging Market Equity
Except for a lower absolute performance number the emerging market chart looks much like the developed international as the MSCI Emerging Markets also finished in the third quartile. This is also in line with the general longer-term trend

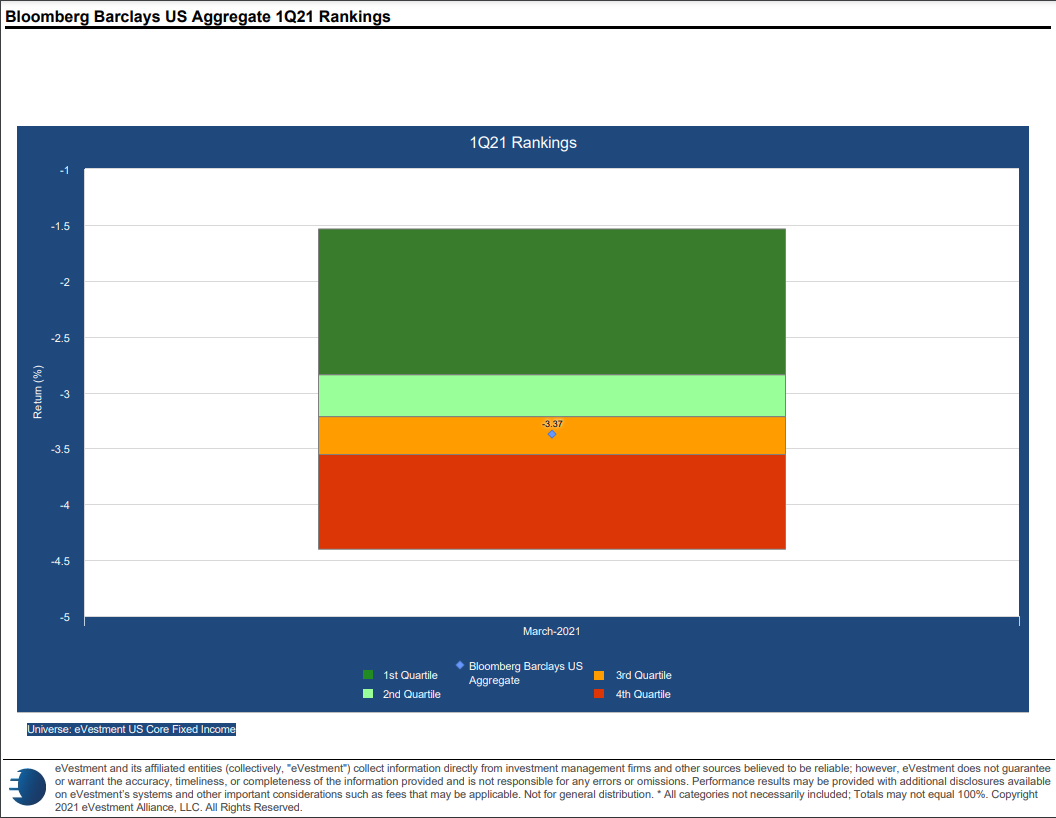
Domestic Fixed Income
The Bloomberg Barclays US Aggregate was down nearly -3.4% in Q1 and finished in the third quartile of the eVestment Core Fixed Income Universe. The surprise here may be that the index didn't rank lower as it has quite often been in the bottom quartile over longer periods. One possibility may be that active managers were caught off guard by the velocity of rising yields during the quarter.