Most Requested Symbols

The start of 2026 has been volatile for U.S. equities, with major indices struggling out of the gate. Elevated implied volatility—evidenced by the recent uptick in the CBOE Volatility Index ([VIX])—has emerged as a dominant theme. In this environment, investors may benefit from shifting focus toward more defensive areas of the market, such as low-volatility strategies.
The positive performance divergence for mid- and small cap stocks throughout the week has provided enough positive action to increase the bullish percents (BP) for the S&P Mid Cap 400 (BPSPMID) and the S&P Small Cap 600 (BPSPSML), reversing both charts back into a column of Xs following Wednesday’s (3/25) action.
Weekly Rundown Video – Mar 26, 2026
Weekly rundown with NDW analyst team covering all major asset classes.
Weekly rundown with NDW analyst team covering all major asset classes.
The start of 2026 has been volatile for U.S. equities, with major indices struggling out of the gate. Elevated implied volatility—evidenced by the recent uptick in the CBOE Volatility Index (VIX)—has emerged as a dominant theme. In this environment, investors may benefit from shifting focus toward more defensive areas of the market, such as low-volatility strategies. Pairing core equity exposure with low-volatility allocations can meaningfully reduce portfolio risk, often with a smaller tradeoff in expected return than many anticipate.
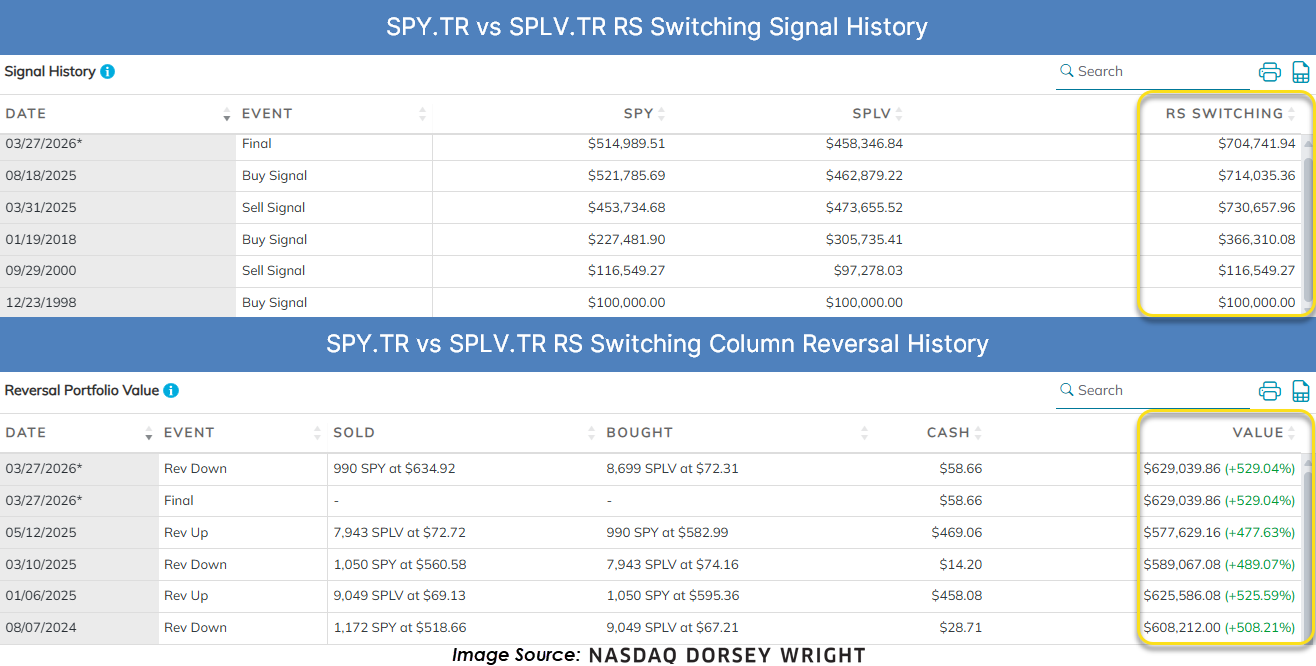
The chart below highlights the relative strength (RS) relationship between the SPDR S&P 500 ETF Trust (SPY) and the Invesco S&P 500 Low Volatility ETF (SPLV), displayed using a 3.25% reversal scale. In August 2025, SPY generated a buy signal against SPLV, reflecting sustained long-term relative strength. However, as of March 27, the RS relationship has reversed into O’s versus SPLV, indicating emerging near-term weakness in SPY relative to low-volatility equities.

Examining the signal history of the RS switching strategy reveals only five instances since 1998 where the relationship has shifted between buy and sell signals. The RS switching strategy column illustrates the hypothetical results of rotating between SPY and SPLV based on which asset is favored at each signal. Starting with $100,000 in 1998, this approach would have grown to approximately $704,000—outperforming a buy-and-hold allocation to SPY ($514,000) or SPLV ($458,000). This underscores the long-term benefit of maintaining exposure to areas of strength.
Further analysis of periods immediately following RS reversals shows a similar pattern. Portfolios that adjusted holdings at these inflection points achieved a higher ending value, with the strategy resulting in a current value of approximately $629,000—again exceeding the outcome of holding either fund in isolation.
Lastly, we evaluated a static allocation model consisting of 60% SPLV and 40% SPY, rebalanced monthly. While capital protection rather than return maximization is the primary objective, the long-term results remain compelling. The model delivered a compound annual growth rate of 9.11% for price returns, compared to 7.18% for the S&P 500. More notably, the portfolio exhibited a materially lower standard deviation and a higher Sharpe ratio (0.57 versus 0.33). The maximum six-month drawdown was also significantly reduced. While this allocation has lagged during recent risk-on periods, the inclusion of SPLV has historically provided disproportionate benefits on the risk-adjusted side of the equation.

In an environment marked by rising volatility and weakening equity participation, incorporating relative strength and low-volatility frameworks can materially improve portfolio resilience. Whether through tactical RS switching or a strategic allocation to defensive exposures, these approaches emphasize capital preservation while maintaining exposure to long-term upside. As market leadership narrows and uncertainty remains elevated, focusing on areas of relative strength becomes increasingly critical for navigating the path forward.

Through Thursday’s (3/26) close, U.S. equity indices have been mixed, with some—like the S&P 500 Index (SPX)—eyeing a potential fifth negative week, while the Russell 2000 Index (RUT) has rallied more than 2%. The positive performance divergence for mid- and small cap stocks throughout the week has provided enough positive action to increase the bullish percents (BP) for the S&P Mid Cap 400 (^BPSPMID) and the S&P Small Cap 600 (^BPSPSML), reversing both charts back into a column of Xs following Wednesday’s (3/25) action. The current reading for the mid‑cap bullish percent is 42%, after the indicator had fallen to 34% following last Friday’s (3/20) action. Unlike the mid‑cap BP, the small cap BP settled above its November 2025 chart low before reversing back into Xs to 44%.

Given the reversals in these bullish percents, the tables below break down the index constituents by NDW sector that have returned to buy signals since both indicators’ chart low on 3/20. Monitoring sectors and subsectors contributing to increasing participation in large indicator universes, like the index-related ones discussed here, can provide insight into those areas poised to contribute to a rebound.
Encompassing mostly stocks that have returned to buy signals during this week’s action, notable NDW sectors showing near‑term increases—and contributing to the index BP reversals—include semiconductors, electronics, and machinery and tools. The mid‑cap space also saw increases from leisure and retailing, while banks, chemicals, and healthcare were notable contributors to the small cap BP reversal.
While highlighting those sectors and subsectors potentially positioned for increased participation, the lack of contributors in other areas can also be informative. For example, insurance currently shows 0% of its index constituents contributing to the BP reversal, while index constituents from oil already have nearly 100% of the stocks on buy signals.

Among the stocks contributing to the index BP reversals by returning to buy signals are Casey’s General Stores (CASY) and The Timken Company (TKR).
Casey’s (CASY) has been a “5‑for‑5’er” since November of last year and has maintained a higher TA rating of 3 or greater since May 2023. The stock has held a long‑term relative strength buy signal against the market since March 2020 and against its peer group since September 2023. It currently ranks within the top decile of the Retailing sector matrix and has maintained a positive trend on the default point‑and‑figure chart since March of last year. Wednesday’s (3/25) trading returned the stock to a buy signal by breaking a double top at $696 as shares rallied to a new all‑time chart high at $720. The stock is okay to consider here on the breakout or on a pullback into the upper‑$600 range. Initial support lies at $656, with additional support at $632 and $608.
Timken (TKR) increased to a “4‑for‑5’er” following Tuesday’s trading and after the peer relative strength chart returned to a column of Xs. Prior to this attribute increase, TKR had been an acceptable 3 TA‑rated stock since January, and the market relative strength chart had also returned to a column of Xs. On the default trend chart, TKR has been in a positive trend since October of last year and returned to a buy signal during Tuesday’s (3/24) trading before reversing back into Os during Friday’s (3/27) intraday action. The stock is okay to consider in the upper‑$90 to lower‑$100 range. Initial support lies at $95, with additional support in the lower‑$90s and upper‑$80s.


| Symbol | Name | Price | Yield | PnF Trend | RS Signal | RS Col. | Fund Score | 200 Day MA | Weekly Mom |
|---|---|---|---|---|---|---|---|---|---|
| DIA | State Street SPDR Dow Jones Industrial Average ETF Trust | 459.31 | 1.40 | Positive | Sell | X | 3.34 | 466.55 | - 7W |
| EEM | iShares MSCI Emerging Markets ETF | 55.47 | 1.94 | Positive | Buy | X | 5.17 | 53.90 | - 4W |
| EFA | iShares MSCI EAFE ETF | 94.66 | 3.08 | Positive | Sell | X | 3.67 | 94.72 | - 4W |
| IJH | iShares S&P MidCap 400 Index Fund | 67.21 | 1.25 | Positive | Buy | O | 4.27 | 65.96 | - 5W |
| IJR | iShares S&P SmallCap 600 Index Fund | 123.67 | 1.33 | Positive | Sell | O | 3.34 | 119.53 | - 6W |
| QQQ | Invesco QQQ Trust | 573.79 | 0.46 | Positive | Buy | O | 3.95 | 593.93 | - 13W |
| RSP | Invesco S&P 500 Equal Weight ETF | 191.08 | 1.53 | Positive | Sell | O | 2.85 | 190.51 | - 4W |
| SPY | State Street SPDR S&P 500 ETF Trust | 645.09 | 1.06 | Positive | Buy | X | 4.44 | 661.48 | - 13W |
| XLG | Invesco S&P 500 Top 50 ETF | 53.97 | 0.67 | Positive | Buy | O | 3.75 | 56.58 | - 13W |

Average Level
-47.20
| < - -100 | -100 - -80 | -80 - -60 | -60 - -40 | -40 - -20 | -20 - 0 | 0 - 20 | 20 - 40 | 40 - 60 | 60 - 80 | 80 - 100 | 100 - > |
|---|---|---|---|---|---|---|---|---|---|---|---|
|
Sell signalagg
|
|||||||||||
|
Sell signallqd
|
|||||||||||
|
Buy signalSPY
|
Sell signalONEQ
|
||||||||||
|
Sell signaldia
|
Sell signalQQQ
|
Buy signalEEM
|
|||||||||
|
Sell signalXLG
|
Sell signalgld
|
Sell signaltlt
|
|||||||||
|
Sell signalefa
|
Buy signalfxe
|
Buy signaliwm
|
|||||||||
|
Buy signalshy
|
Sell signalVOOG
|
Buy signalVOOV
|
Buy signalIJH
|
Buy signalUSO
|
|||||||
|
Buy signalhyg
|
Sell signalief
|
Buy signalrsp
|
Buy signalicf
|
Buy signalijr
|
Buy signaldvy
|
Buy signalGCC
|
Buy signaldx/y
|
Buy signalGSG
|
|||
| < - -100 | -100 - -80 | -80 - -60 | -60 - -40 | -40 - -20 | -20 - 0 | 0 - 20 | 20 - 40 | 40 - 60 | 60 - 80 | 80 - 100 | 100 - > |
| AGG | iShares US Core Bond ETF |
| USO | United States Oil Fund |
| DIA | SPDR Dow Jones Industrial Average ETF |
| DVY | iShares Dow Jones Select Dividend Index ETF |
| DX/Y | NYCE U.S.Dollar Index Spot |
| EFA | iShares MSCI EAFE ETF |
| FXE | Invesco CurrencyShares Euro Trust |
| GLD | SPDR Gold Trust |
| GSG | iShares S&P GSCI Commodity-Indexed Trust |
| HYG | iShares iBoxx $ High Yield Corporate Bond ETF |
| ICF | iShares Cohen & Steers Realty ETF |
| IEF | iShares Barclays 7-10 Yr. Tres. Bond ETF |
| LQD | iShares iBoxx $ Investment Grade Corp. Bond ETF |
| IJH | iShares S&P 400 MidCap Index Fund |
| ONEQ | Fidelity Nasdaq Composite Index Track |
| QQQ | Invesco QQQ Trust |
| RSP | Invesco S&P 500 Equal Weight ETF |
| IWM | iShares Russell 2000 Index ETF |
| SHY | iShares Barclays 1-3 Year Tres. Bond ETF |
| IJR | iShares S&P 600 SmallCap Index Fund |
| SPY | SPDR S&P 500 Index ETF Trust |
| TLT | iShares Barclays 20+ Year Treasury Bond ETF |
| GCC | WisdomTree Continuous Commodity Index Fund |
| VOOG | Vanguard S&P 500 Growth ETF |
| VOOV | Vanguard S&P 500 Value ETF |
| EEM | iShares MSCI Emerging Markets ETF |
| XLG | Invesco S&P 500 Top 50 ETF |
| Symbol | Company | Sector | Current Price | Action Price | Target | Stop | Notes |
|---|---|---|---|---|---|---|---|
| WBS | Webster Financial Corporation | Banks | $68.45 | hi 60s - low 70s | 91 | 58 | 4 for 5'er, top 25% of BANK sector matrix, one box from peer RS buy, buy on pullback, 2.2% yield |
| CGON | CG Oncology, Inc. | Biomedics/Genetics | $66.61 | hi 50s - low 60s | 80 | 50 | 5 for 5'er, 18 of 162 in BIOM sector matrix, bullish catapult, good R-R, Earn. 3/26 |
| DGII | Digi International Inc | Telephone | $48.64 | upper 40s to lower 50s | 61 | 40 | 5 for 5'er; top quartile of Telephone matrix; buy signal since May '25, pos. trend since June '25. |
| BRX | Brixmor Property Group Inc | Real Estate | $28.64 | hi 20s - lo 30s | 38 | 24 | 4 for 5'er, top third of REAL sector matrix, LT pos peer & mkt RS, LT pos trend, bullish triangle, 4% yield |
| CNX | CNX Resources Corp | Oil | $40.01 | hi 30s - mid 40s | 71 | 33 | 5 TA rating, top 50% of OIL sector matrix, LT RS buy and pos trend, consec buy signals |
| FFIV | F5 Inc. | Internet | $293.15 | 280s - 290s | 344 | 256 | 4 for 5'er, top third of INET sector matrix, LT pos peer RS, spread quad top |
| INVA | Innoviva, Inc | Drugs | $22.67 | lo-mid 20s | 32.50 | 18.50 | 5 TA rating, top half of drugs sector RS matrix, LT pos trend, LT RS buy, buy-on-pullback |
| ARCB | ArcBest Corp. | Transports/Non Air | $95.31 | low-to-mid 90s | 113 | 79 | 4 for 5'er, one box from market RS buy, top half of favored TRAN sector matrix, good R-R |
| GSK | GlaxoSmithKline Plc. (United Kingdom) ADR | Drugs | $53.94 | hi 40s - mid 50s | 67 | 42 | 5 TA rating, top 25% of DRUG sector matrix, LT pos trend, yield > 3%, buy-on-pullback |
| ADI | Analog Devices, Inc. | Semiconductors | $313.42 | 310s - 330s | 380 | 268 | 4 for 5'er, top half of favored SEMI sector matrix, LT pos market RS, return to buy signal |
| CSCO | Cisco Systems, Inc. | Computers | $82.16 | Upper 70s to lower 80s | 96 | 70 | 5 for 5'er; top quintile of Computers matrix; Pos. Trend since Sept. '24; Bull Triangle on 3/25. |
| CAT | Caterpillar, Inc. | Machinery and Tools | $703.19 | 680s - 720s | 848 | 592 | 5 for 5'er, #1 of 67 in favored MACH sector matrix, LT pos peer & mkt RS, buy on pullback |
| Symbol | Company | Sector | Current Price | Action Price | Target | Stop | Notes |
|---|---|---|---|---|---|---|---|
| CPRT | Copart Incorporated | Autos and Parts | $33.03 | hi 30s | 28 | 42 | 1 TA rating, bottom 50% of AUTO sector matrix, NT and mkt RS sell last month, consec sell signals |
| Comment | |||||||
|---|---|---|---|---|---|---|---|
|
|
|||||||
CAT Caterpillar, Inc. R ($697.47) - Machinery and Tools - CAT is a 5 for 5'er that ranks first out of 67 names in the favored machinery and tools sector matrix and has been on market and peer RS buy signals since 2021 and 2023, respectively. After giving three consecutive sell signals, CAT returned to a buy signal this week when it broke a double top at $712. The stock has subsequently pulled back near prior support near the middle of its trading band, offering an entry point for long exposure. Positions may be added in the $680s to $720s and we will set our initial stop at $592, which would violate multiple levels of support on CAT's chart. We will use the bullish price objective, $848, as our target price.
| 26 | |||||||||||||||||||||||||||||
| 784.00 | X | 784.00 | |||||||||||||||||||||||||||
| 776.00 | X | O | X | 776.00 | |||||||||||||||||||||||||
| 768.00 | X | O | X | O | 768.00 | ||||||||||||||||||||||||
| 760.00 | X | O | X | O | 760.00 | ||||||||||||||||||||||||
| 752.00 | X | O | O | 752.00 | |||||||||||||||||||||||||
| 744.00 | X | O | X | 744.00 | |||||||||||||||||||||||||
| 736.00 | X | O | X | O | 736.00 | ||||||||||||||||||||||||
| 728.00 | X | 3 | X | O | X | X | 728.00 | ||||||||||||||||||||||
| 720.00 | X | X | O | X | O | X | O | X | O | 720.00 | |||||||||||||||||||
| 712.00 | X | O | X | O | O | X | O | X | O | 712.00 | |||||||||||||||||||
| 704.00 | X | O | X | O | X | O | X | X | O | 704.00 | |||||||||||||||||||
| 696.00 | X | O | X | O | X | O | X | O | X | Mid | 696.00 | ||||||||||||||||||
| 688.00 | X | O | X | O | X | O | X | O | X | 688.00 | |||||||||||||||||||
| 680.00 | 2 | O | X | O | X | O | O | X | 680.00 | ||||||||||||||||||||
| 672.00 | X | O | O | X | O | 672.00 | |||||||||||||||||||||||
| 664.00 | X | O | 664.00 | ||||||||||||||||||||||||||
| 656.00 | X | 656.00 | |||||||||||||||||||||||||||
| 648.00 | X | X | 648.00 | ||||||||||||||||||||||||||
| 640.00 | X | O | X | 640.00 | |||||||||||||||||||||||||
| 632.00 | X | O | X | 632.00 | |||||||||||||||||||||||||
| 624.00 | X | X | X | O | 624.00 | ||||||||||||||||||||||||
| 616.00 | X | O | X | O | X | 616.00 | |||||||||||||||||||||||
| 608.00 | X | O | X | O | X | 608.00 | |||||||||||||||||||||||
| 600.00 | X | O | X | O | 600.00 | ||||||||||||||||||||||||
| 592.00 | X | O | 1 | 592.00 | |||||||||||||||||||||||||
| 584.00 | C | O | X | 584.00 | |||||||||||||||||||||||||
| 576.00 | X | X | X | O | X | 576.00 | |||||||||||||||||||||||
| 568.00 | X | O | X | O | X | X | O | X | 568.00 | ||||||||||||||||||||
| 560.00 | X | O | X | O | X | O | X | O | Bot | 560.00 | |||||||||||||||||||
| 552.00 | O | O | X | O | X | 552.00 | |||||||||||||||||||||||
| 544.00 | O | O | 544.00 | ||||||||||||||||||||||||||
| 26 |

| AVGO Broadcom Ltd ($301.70) - Semiconductors - AVGO fell Friday to break a spread triple bottom before dropping to $300 intraday. This also moved the stock into a negative trend, demoting it to a 2 for 5 TA rating. The weight of the technical evidence is now weak. Avoid long exposure. Further support may be seen at $296. Overhead resistance is seen at $324. |
| CAKE The Cheesecake Factory Incorporated ($53.64) - Restaurants - CAKE broke a double bottom at $55 for the fourth sell signal since reaching its near-term peak at $66 in February. The break follows the stock shifting into a negative trend, which dropped the stock down to a 4 for 5'er. With shares ulitmately falling to $53, the chart now lies at its lowest level since the beginning of the year. From here support lies in the $43 to $44 range. |
| COF Capital One Financial Corporation ($176.44) - Finance - COF shares moved lower today to break a double bottom at $180 to mark its first sell signal. This 2 for 5'er has been in a negative trend since February but on an RS buy signal versus the market since December 2020. COF shares are trading in heavily oversold territory with a weekly overbought/oversold reading of -70%. From here, support is offered at $176. |
| COR Cencora Inc. ($312.45) - Drugs - Cor completed a double bottom break at $316, marking its second consecutive sell signal. The 3 for 5'er lost two points this month after moving back into a negative trend and reversing back into Os against its peers. Additionally, the stock ranks in the bottom half of the drugs sector matrix. The stock is still rated a hold, but continue to monitor for further weakness. Initial resistance can be seen at $332, with additional resistance at $376. |
| ETR Entergy Corporation ($109.92) - Utilities/Electricity - ETR reversed into Xs and broke a double top at $108 for a fourth buy signal as shares rallied to $110, marking a new all-time chart high. The stock has been a 5 for 5'er since January of 2025 and currently ranks within the top quintile of the Electric Utilities sector matrix. Okay to consider here on the breakout or on a pullback to the lower $100 range. Initial support lies at $100, while additional can be found in the lower to mid $90s. |
| INTC Intel Corporation ($43.04) - Semiconductors - INTC moved lower Friday to break a triple bottom at $43. This also moved the stock to a negative trend and demotes it to a 2 for 5 TA rating. The weight of the technical evidence is now negative. Further support may be seen at $42. Overhead resistance is seen at $47. Earnings are expected on 4/23. |
| ISRG Intuitive Surgical, Inc. ($452.66) - Healthcare - ISRG reversed back down and completed a double bottom break at $456, marking its fourth consecutive sell signal. The 3 for 5'er lost two signals last month after moving back into a negative trend and reversing back into Os against the market. The stock is still rated a hold but continue to monitor for further weakness. Initial resistance can be seen at $488, with additional resistance at $504. |
| LUV Southwest Airlines Co. ($37.29) - Aerospace Airline - LUV broke a double bottom at $38 for a second sell signal since the stock rallied to the mid $50s in February. This brings the stock within one box of the bullish support line, while would be violated with a move below $36. The stock continues to maintain a 3 technical attribute rating and ranks within the top half of the Aerospace Airline sector matrix. From here, support beyond the bullish support line lies in the $29 to $30 range. |
| Name | Option Symbol | Action | Stop Loss |
|---|---|---|---|
| DuPont de Nemours Inc. - $45.26 | O: 26G45.00D17 | Buy the July 45.00 calls at 4.50 | 42.00 |
| Name | Option | Action |
|---|---|---|
| Broadcom Ltd ( AVGO) | May. 330.00 Calls | Stopped at 304.00 (CP: 302.12) |
| Merck & Co., Inc. ( MRK) | Jun. 115.00 Calls | Raise the option stop loss to 8.50 (CP: 10.50) |
| Archer-Daniels-Midland Company ( ADM) | May. 65.00 Calls | Raise the option stop loss to 6.50 (CP: 8.50) |
| Align Technology, Inc. ( ALGN) | May. 180.00 Calls | Stopped at 170.00 (CP: 166.14) |
| Name | Option Symbol | Action | Stop Loss |
|---|---|---|---|
| Freeport-McMoRan Inc. - $56.24 | O: 26S55.00D17 | Buy the July 55.00 puts at 6.00 | 59.00 |
| Name | Option | Action |
|---|---|---|
| Airbnb, Inc. Class A ( ABNB) | May. 130.00 Puts | Initiate an option stop loss of 9.85 (CP: 11.85) |
| Dutch Bros Inc. Class A ( BROS) | Jul. 52.50 Puts | Initiate an option stop loss of 7.20 (CP: 9.20) |
| Uber Technologies, Inc. ( UBER) | Jun. 75.00 Puts | Raise the option stop loss to 6.55 (CP: 8.55) |
| Wells Fargo & Company ( WFC) | Jul. 80.00 Puts | Initiate an option stop loss of 5.55 (CP: 7.55) |
| Name | Option Sym. | Call to Sell | Call Price | Investment for 500 Shares | Annual Called Rtn. | Annual Static Rtn. | Downside Protection |
|---|---|---|---|---|---|---|---|
| Citizens Financial Group Inc $ 58.56 | O: 26G60.00D17 | Jul. 60.00 | 3.30 | $ 27,530.26 | 25.82% | 15.92% | 4.66% |
| Name | Action |
|---|---|
| Intel Corporation ( INTC) - 44.10 | Sell the May 49.00 Calls. |
| Micron Technology, Inc. ( MU) - 355.46 | Sell the June 420.00 Calls. |
| Fortinet Inc. ( FTNT) - 81.03 | Sell the May 85.00 Calls. |
| Invesco PLC ( IVZ) - 24.10 | Sell the May 24.00 Calls. |
| DuPont de Nemours Inc. ( DD) - 46.02 | Sell the May 45.00 Calls. |
| Palantir Technologies Inc. Class A ( PLTR) - 147.56 | Sell the July 150.00 Calls. |
| Name | Covered Write |
|---|---|
| Moderna, Inc. ( MRNA - 53.57 ) | April 55.00 covered write. |
| CF Industries Holdings, Inc. ( CF - 132.56 ) | April 127.00 covered write. |
Daily Equity & Market Analysis
LISTEN TO PODCAST
Mar 26, 2026
Loading, Please Wait...
