
The latest seasonal evaluation for the Fund Score Method (FSM) models took place earlier this week. Today, we review changes to some of the equity-focused models.
The latest seasonal evaluation for the Fund Score Method (FSM) models on the NDW platform took place after market close on Tuesday, August 3, and any corresponding trades were sent out the morning of Wednesday, August 4. As a refresher, the FSM seasonal models are evaluated four times a year at the beginning of each seasonal quarter, so at the beginning of February, May, August, and November. At each evaluation, the models will sort their respective inventories by fund score, seeking to only hold those funds that possess the highest scores. The number of securities held is dependent on the model, but will typically be two or five names. For more information on the construction of the FSM models, please visit our FSM model guide.
This week’s evaluation saw several changes to the models, but perhaps not as many as might be anticipated given the recent market movement. None of the separate cash triggers that are tied to the models were triggered, as the core US equity market continues to rank among the top asset classes by average score, and money market continues to sit at the bottom of the rankings. Many of the models that saw changes shifted back toward overweight positions in large-cap growth, with high exposure also seen in the technology sector. Today, we will review the recent changes to some of the equity-focused models available on the platform, with the remaining models being covered in Friday’s Fund Score Overview.
CoreSolution Models
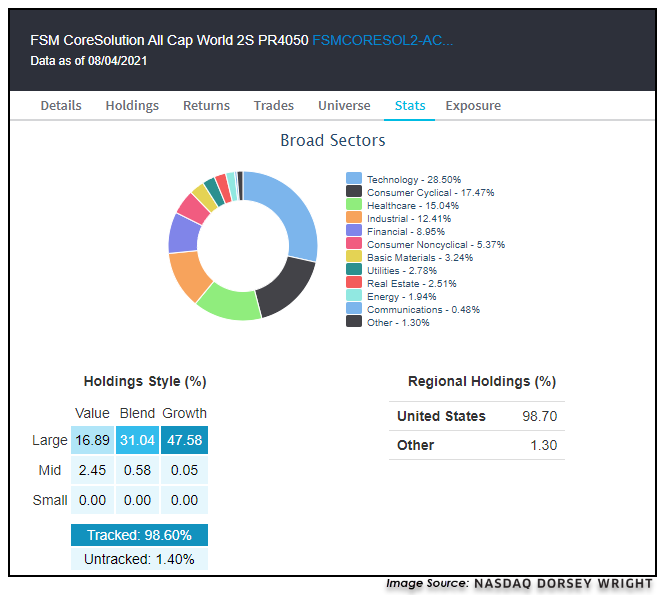
The FSM CoreSolution All Cap World 2S Model saw a change in the latest evaluation, with the Invesco S&P 500 Pure Value ETF RPV being sold from the model and replaced by the Invesco S&P 500 Pure Growth ETF RPG. The growth representative joins the Invesco S&P 500 Equal Weight ETF RSP in an equal-weighted fashion, leaving the portfolio at a substantial overweight toward large-cap growth. Technology is now the most overweight sector in the portfolio at just over 28%, followed by consumer cyclical at about 17% and healthcare at 15%.
Flexible Allocation Models
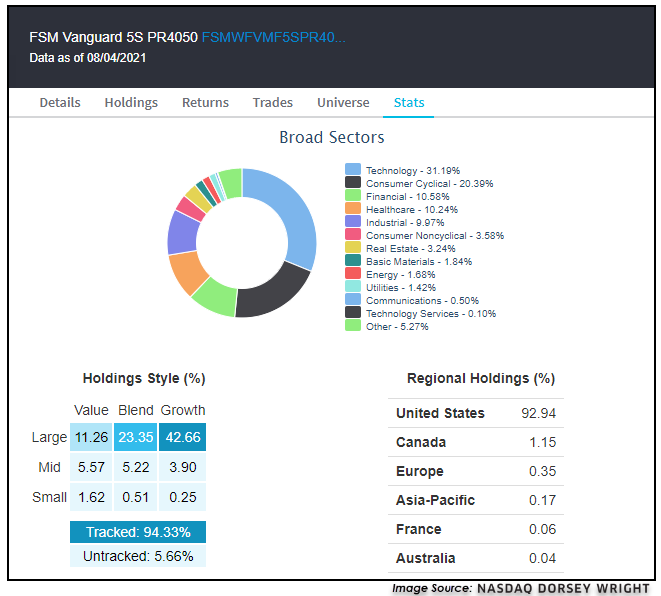
The FSM Vanguard 5S Model saw two changes in the most recent evaluation, with the Vanguard Small-Cap Index Fund NAESX and the Vanguard Tax-Managed Capital Appreciation Fund VTCLX each being sold from the portfolio. In their place, the model purchased the Vanguard Growth Index Fund VIGRX and the Vanguard US Growth Fund VWUSX. This leaves the fund at an overweight toward large-cap growth, a theme reflected across many of the most recent model changes. The most overweight sector is again technology at 31% with a high allocation also seen in consumer cyclicals at 20%, followed by financials and healthcare, which each make up about 10%, 20% total, of the portfolio.
Other Equity Focused Models
The FSM First Trust SelfDirect 5S Model saw 100% turnover in the latest evaluation, with five positions being sold and five new positions added. The model moved away from value, financials, and dividend achievers representatives. In their place, the model purchased representatives for growth, consumer cyclicals, technology, and even the First Trust Water ETF FIW. Similar to the other equity-focused models, this strategy is now overweight technology at 31% with high exposure seen in consumer cyclicals at almost 25% and industrials at almost 19% of the portfolio.
The FSM Schwab Macro Blend 5S Model saw two changes this week, with the portfolio removing the Schwab US Broad Market ETF SCHB and the Schwab US Small-Cap ETF SCHA. The model gained exposure toward the Schwab US Large-Cap Growth ETF SCHG and the Schwab US REIT ETF SCHH. Interestingly enough, this leaves the portfolio with an overweight position toward real estate at roughly 23% of the model, with high exposure also seen in technology (21%) and consumer cyclicals (16%).

