Most Requested Symbols

Communication services has struggled so far in 2026. Today we observe a handful of technical pictures for some of the larger names.
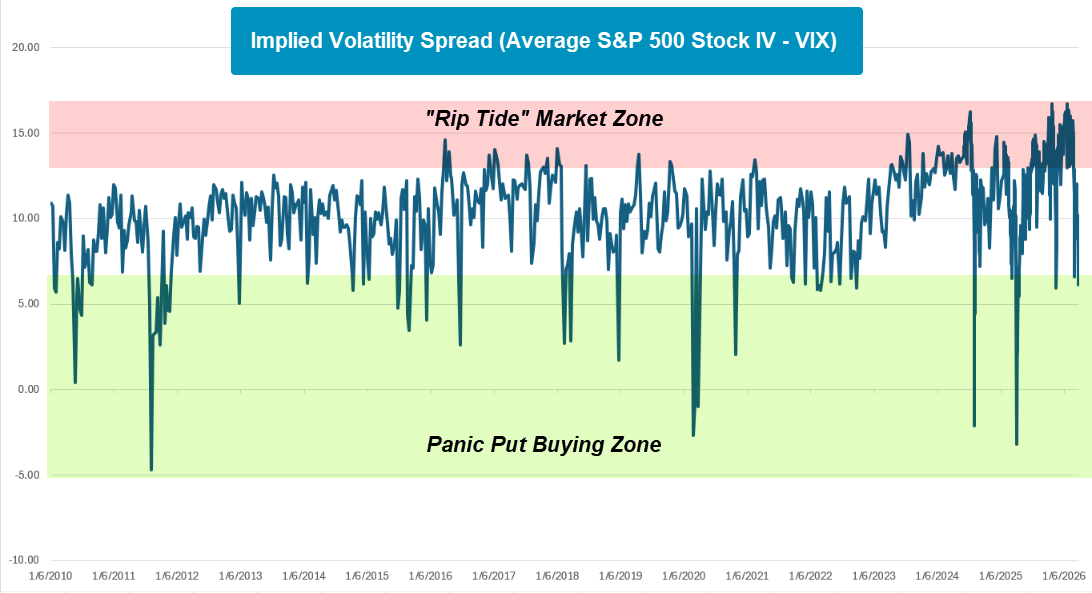
Signs of panic in the volatility complex may give relief to bulls.
Weekly Rundown Video – Mar 26, 2026
Weekly rundown with NDW analyst team covering all major asset classes.
Weekly rundown with NDW analyst team covering all major asset classes.
Interested in where the “Weight of the Evidence” stands as we move into Q2 2026? Join NDW Senior Portfolio Manager John Lewis and Research Analyst Miles Clark, alongside Nasdaq’s Head of Investment Insights, Yanni Angelakos, for a discussion on key technical and fundamental insights shaping what looks to be a busy second quarter. The webinar is next Tuesday (4/7) at 1PM EST. CE Credit will be available. Register HERE
After outperforming the broad S&P 500 in each of the last three years (2023-2025) communications services has fallen behind many other sectors throughout 2026. This development has come largely at the hands of larger, more tech-focused names as broader market-wide trends have followed suit. While the sector as a whole hasn’t struggled to the magnitude of a sector like financials, there are several signs supporting the idea that there could be extended weakness emerging for the group, especially if the rotation towards value-oriented names persists. The sector does remain technically acceptable on broader sector ranking pages like DALI (included below) or the Asset Class Group Scores Page, where the sector ranks third and fourth respectively. Despite this longer-term strength/persistence, we have seen the magnitude of leadership drop off significantly as the sector has ceded strength to other areas.

XLC has declined roughly 5.5% so far this year, barely underperforming the broad market (SPX) throughout Q1 with a late March rally. While the longer-term technical picture for XLC remains defendable based purely on its 4.02 fund score, the fund recently returned to a sell signal on its default chart… its first since April of 2025. While the recent exhale has it in heavily oversold territory (like much of the market) the fund score has moved to its worst reading in roughly a year. While we might expect a range of resistance around the early 2025 highs to act as new support in the near-term, there is certainly a fair share of risk associated with adding new exposure here when considering how broader markets have rolled over. All this to say, keep an eye on your broad exposure within communication services.

Looking underneath the hood of XLC, there are a handful of household names with interesting technical pictures worth commenting on. Even after Tuesday’s intraday rally on news of potential easing of conflict in the Middle East, the likes of Google (GOOGL, GOOG), Netflix (NFLX), and Meta (META) still sit well off their relative highs from earlier this year. Pictured below, GOOGL has quite an interesting picture having registered a string of four consecutive sell signals on its default chart amid the recent exhale. While the search engine giant remains a technically strong option according to its TA score, it is still off about 9% so far this year with plenty of resistance above between here and ATHs at $348. Many readers will have average costs on GOOGL well below current levels. Keep this in mind when considering cutting positions… while technical deterioration certainly has occurred be wary of cutting exposure to a heavily oversold high TA stock. Another quick comment on the likes of META: it is not a weak attribute stock after falling nearly 20% in Q1. With the bounce on 3/31, it would classify for many as a “sell-on-rally” candidate. Again, it's worth mentioning many of you will have nice gains generated over the last few years- keep this in mind when trimming positions if trying to take some money off the table.
Trying to find replacement assets for these mega-cap core names can be difficult. First, as hinted on throughout the piece, the tax implications on outstanding legacy positions can be tricky to navigate. Second, taking an underweight position for names that hold large weightings in our core benchmark can feel like taking a “risky” stance, especially if things start to rip back to all-time highs as global conflict cools. In these kinds of scenarios, it is paramount to remember to remain objective in our decision-making process. Allowing a stock’s name to subtly guide our hand can lead us to make emotion-based decisions. Second, remember that momentum is a self-correcting factor. If cutting exposure to a sector/specific security is the “wrong” move, momentum will pick it back up again as new relative strength is established.


About a month and a half ago, we discussed the wide disparity between S&P 500 Index implied volatility and the average implied volatility of its constituents. In summary, the average stock implied volatility in the S&P was historically elevated relative to the index’s volatility. We called this a “rip tide market” as the market looked calmed from a distance but was much more violent once you got in the water (read more here). With the recent increase in the S&P 500 Volatility Index (VIX), we are now in the opposite situation where the spread between index implied volatility and average constituent volatility has collapsed down to attractive levels for equity investors. While we have seen market panic episodes in the past where the spread between average SPX stock implied volatility and SPX implied volatility headed even lower than it is today, a bounce is usually in order from these levels. Said another way, investors were underpricing insurance a month and a half ago and have now shifted to overpricing insurance.
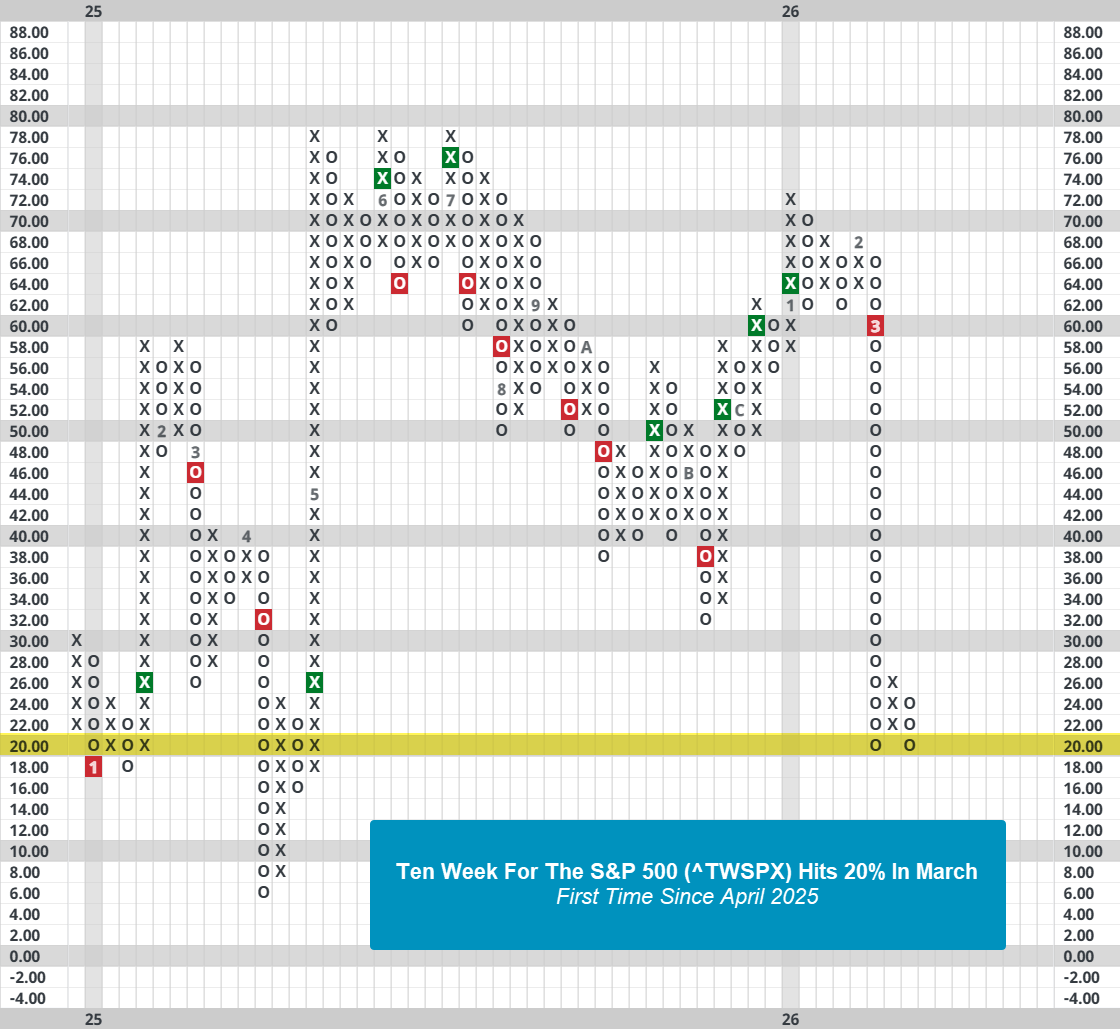
The markets could certainly move down further, but for those looking to protect portfolios with puts now is not the time to do so. Secondly, we have yet to see major technical deterioration of domestic or international equities. Short and intermediate-term indicators are trading in or right at washed out territory. The Ten Week for the S&P 500 (^TWSPX) and the Bullish Percent for the S&P 500 (^BPSPX) sit at 20% and 32%, respectively. Like the volatility spread, both indicators can and have headed lower, but any reversals back into Xs would usually be a good buying opportunity. There is plenty of headline risk moving forward, but the market is in a good position for a bounce.
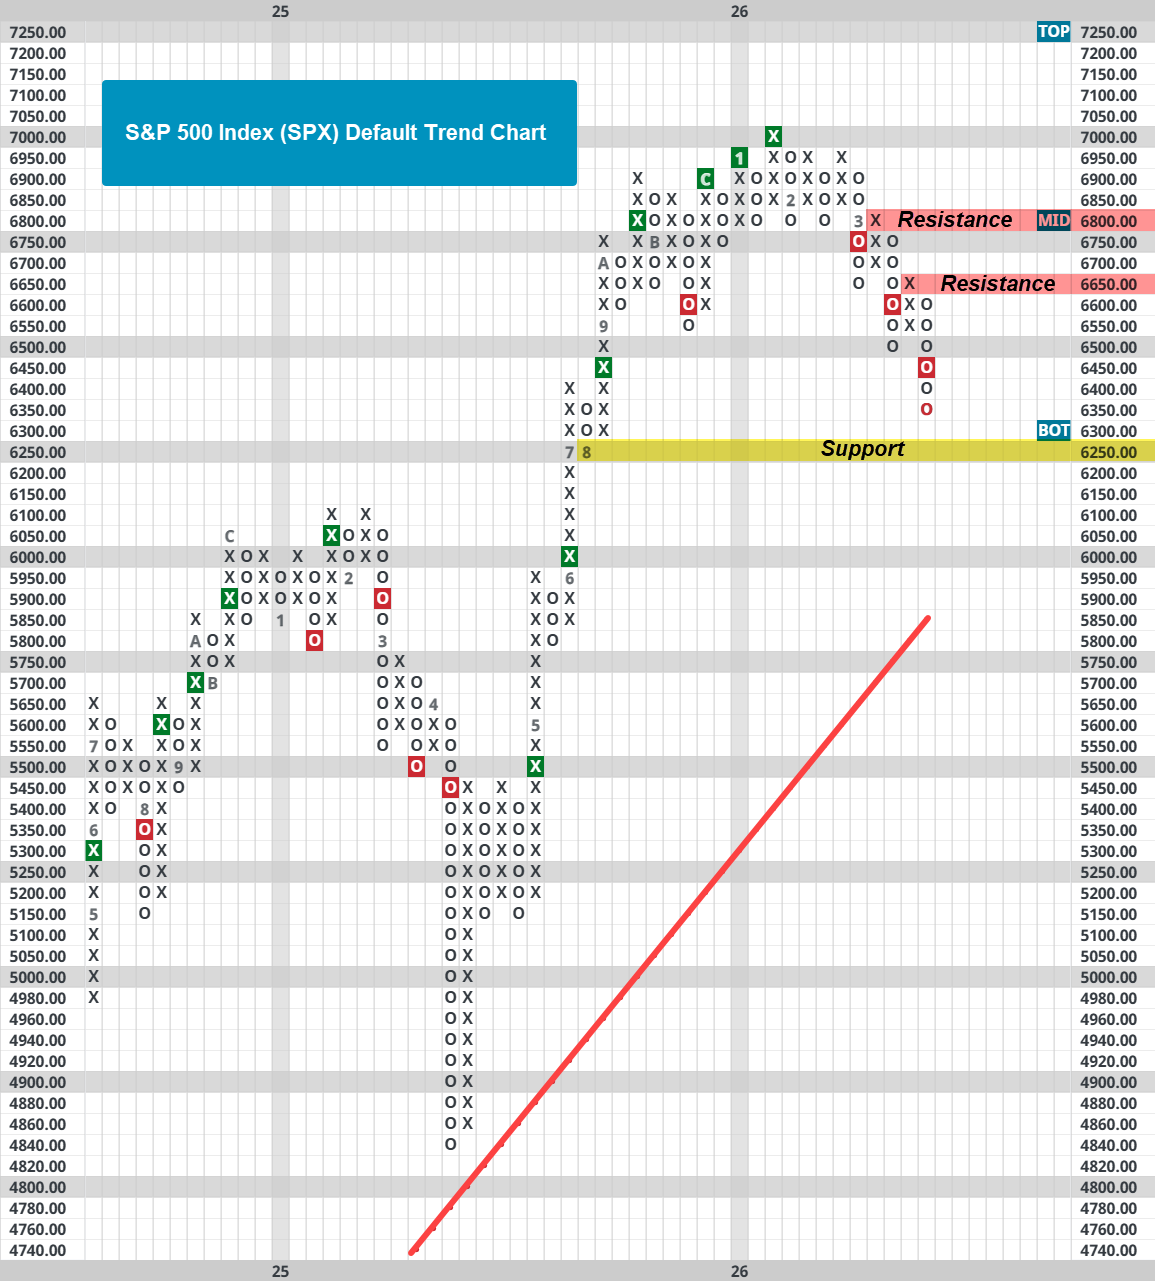
While there is a good setup for a bounce in the market, we still need to be on the lookout if that is not the case. Looking at the S&P 500’s (SPX) default chart, the next level of support is 6250. Below 6250, there is not any support until the 5800 to 5850 area. In terms of resistance, there are a few levels the benchmark needs to overcome: 6650 and 6800. Above 6800, the index is set up for test of its all-time highs at 7000. In other words, SPX has some technical repairs before bulls can feel confident even if a bounce does occur. Nonetheless, the dynamics in the volatility complex and low indicator readings shine a favorable light on a bounce in the short-term at least.
Average Level
-42.96
| < - -100 | -100 - -80 | -80 - -60 | -60 - -40 | -40 - -20 | -20 - 0 | 0 - 20 | 20 - 40 | 40 - 60 | 60 - 80 | 80 - 100 | 100 - > |
|---|---|---|---|---|---|---|---|---|---|---|---|
|
Sell signalefa
|
|||||||||||
|
Buy signalhyg
|
Buy signalfxe
|
||||||||||
|
Buy signalSPY
|
Buy signalrsp
|
Buy signalijr
|
|||||||||
|
Sell signalVOOG
|
Buy signalVOOV
|
Sell signalagg
|
|||||||||
|
Sell signalXLG
|
Buy signaliwm
|
Buy signalshy
|
|||||||||
|
Sell signaldia
|
Buy signalEEM
|
Sell signalgld
|
|||||||||
|
Sell signalONEQ
|
Sell signallqd
|
Buy signalicf
|
Sell signaltlt
|
Buy signalGSG
|
|||||||
|
Sell signalQQQ
|
Buy signalIJH
|
Sell signalief
|
Buy signaldvy
|
Buy signalGCC
|
Buy signaldx/y
|
Buy signalUSO
|
|||||
| < - -100 | -100 - -80 | -80 - -60 | -60 - -40 | -40 - -20 | -20 - 0 | 0 - 20 | 20 - 40 | 40 - 60 | 60 - 80 | 80 - 100 | 100 - > |
| AGG | iShares US Core Bond ETF |
| USO | United States Oil Fund |
| DIA | SPDR Dow Jones Industrial Average ETF |
| DVY | iShares Dow Jones Select Dividend Index ETF |
| DX/Y | NYCE U.S.Dollar Index Spot |
| EFA | iShares MSCI EAFE ETF |
| FXE | Invesco CurrencyShares Euro Trust |
| GLD | SPDR Gold Trust |
| GSG | iShares S&P GSCI Commodity-Indexed Trust |
| HYG | iShares iBoxx $ High Yield Corporate Bond ETF |
| ICF | iShares Cohen & Steers Realty ETF |
| IEF | iShares Barclays 7-10 Yr. Tres. Bond ETF |
| LQD | iShares iBoxx $ Investment Grade Corp. Bond ETF |
| IJH | iShares S&P 400 MidCap Index Fund |
| ONEQ | Fidelity Nasdaq Composite Index Track |
| QQQ | Invesco QQQ Trust |
| RSP | Invesco S&P 500 Equal Weight ETF |
| IWM | iShares Russell 2000 Index ETF |
| SHY | iShares Barclays 1-3 Year Tres. Bond ETF |
| IJR | iShares S&P 600 SmallCap Index Fund |
| SPY | SPDR S&P 500 Index ETF Trust |
| TLT | iShares Barclays 20+ Year Treasury Bond ETF |
| GCC | WisdomTree Continuous Commodity Index Fund |
| VOOG | Vanguard S&P 500 Growth ETF |
| VOOV | Vanguard S&P 500 Value ETF |
| EEM | iShares MSCI Emerging Markets ETF |
| XLG | Invesco S&P 500 Top 50 ETF |

| Symbol | Company | Sector | Current Price | Action Price | Target | Stop | Notes |
|---|---|---|---|---|---|---|---|
| WBS | Webster Financial Corporation | Banks | $67.92 | hi 60s - low 70s | 91 | 58 | 4 for 5'er, top 25% of BANK sector matrix, one box from peer RS buy, buy on pullback, 2.2% yield |
| CGON | CG Oncology, Inc. | Biomedics/Genetics | $63.90 | hi 50s - low 60s | 80 | 50 | 5 for 5'er, 18 of 162 in BIOM sector matrix, bullish catapult, good R-R |
| BRX | Brixmor Property Group Inc | Real Estate | $28.70 | hi 20s - lo 30s | 38 | 24 | 4 for 5'er, top third of REAL sector matrix, LT pos peer & mkt RS, LT pos trend, bullish triangle, 4% yield, Earn. 4/27 |
| CNX | CNX Resources Corp | Oil | $39.98 | hi 30s - mid 40s | 71 | 33 | 5 TA rating, top 50% of OIL sector matrix, LT RS buy and pos trend, consec buy signals |
| FFIV | F5 Inc. | Internet | $279.78 | 280s - 290s | 344 | 256 | 4 for 5'er, top third of INET sector matrix, LT pos peer RS, spread quad top, Earn. 4/27 |
| INVA | Innoviva, Inc | Drugs | $22.90 | lo-mid 20s | 32.50 | 18.50 | 5 TA rating, top half of drugs sector RS matrix, LT pos trend, LT RS buy, buy-on-pullback |
| ARCB | ArcBest Corp. | Transports/Non Air | $93.41 | low-to-mid 90s | 113 | 79 | 4 for 5'er, one box from market RS buy, top half of favored TRAN sector matrix, good R-R |
| GSK | GlaxoSmithKline Plc. (United Kingdom) ADR | Drugs | $54.23 | hi 40s - mid 50s | 67 | 42 | 5 TA rating, top 25% of DRUG sector matrix, LT pos trend, yield > 3%, buy-on-pullback |
| ADI | Analog Devices, Inc. | Semiconductors | $303.10 | 310s - 330s | 380 | 268 | 4 for 5'er, top half of favored SEMI sector matrix, LT pos market RS, return to buy signal |
| CSCO | Cisco Systems, Inc. | Computers | $77.04 | Upper 70s to lower 80s | 96 | 70 | 5 for 5'er; top quintile of Computers matrix; Pos. Trend since Sept. '24; Bull Triangle on 3/25. |
| CAT | Caterpillar, Inc. | Machinery and Tools | $667.43 | 680s - 720s | 848 | 592 | 5 for 5'er, #1 of 67 in favored MACH sector matrix, LT pos peer & mkt RS, buy on pullback |
| DBD | Diebold Nixdorf Inc | Finance | $73.60 | low-to-mid 70s | 99 | 63 | 5 for 5'er, #3 of 77 in FINA sector matrix, LT pos peer RS, bearish signal reversal, R-R>2.0 |
| NI | Nisource, Inc. | Gas Utilities | $46.50 | mid-hi 40s | 78 | 38 | 5 TA rating, LT pos trend, LT mkt RS buy, consec buy signals |
| Symbol | Company | Sector | Current Price | Action Price | Target | Stop | Notes |
|---|---|---|---|---|---|---|---|
| CPRT | Copart Incorporated | Autos and Parts | $32.61 | hi 30s | 28 | 42 | 1 TA rating, bottom 50% of AUTO sector matrix, NT and mkt RS sell last month, consec sell signals |
| Comment | |||||||
|---|---|---|---|---|---|---|---|
|
|
|||||||
NI Nisource, Inc. ($46.65) R - Gas Utilities - NO has a 5 for 5 TA rating and sits in the top third of the favored gas utilities sector RS matrix. The stock has maintained a positive trend since 2012 and been on an RS buy signal against the market for over a year. The weight of the technical evidence is favorable and continues to improve. The stock also carries a 2.64% yield. Exposure may be considered in the mid-to-upper $40s. Our initial stop will be positioned at $38, which would violate multiple support levels. The bullish price objective of $78 will serve as our price target.
| 21 | 23 | 24 | 26 | ||||||||||||||||||||||||||
| 47.00 | X | 47.00 | |||||||||||||||||||||||||||
| 46.00 | X | 46.00 | |||||||||||||||||||||||||||
| 45.00 | 2 | Mid | 45.00 | ||||||||||||||||||||||||||
| 44.00 | A | 1 | 44.00 | ||||||||||||||||||||||||||
| 43.00 | 8 | X | O | X | 43.00 | ||||||||||||||||||||||||
| 42.00 | X | O | X | O | X | 42.00 | |||||||||||||||||||||||
| 41.00 | 3 | 7 | O | X | C | 41.00 | |||||||||||||||||||||||
| 40.00 | X | O | 5 | 9 | X | Bot | 40.00 | ||||||||||||||||||||||
| 39.00 | 2 | O | X | O | 39.00 | ||||||||||||||||||||||||
| 38.00 | X | 4 | X | 38.00 | |||||||||||||||||||||||||
| 37.00 | X | O | X | 37.00 | |||||||||||||||||||||||||
| 36.00 | B | O | 36.00 | ||||||||||||||||||||||||||
| 35.00 | A | 35.00 | |||||||||||||||||||||||||||
| 34.00 | 9 | 34.00 | |||||||||||||||||||||||||||
| 33.00 | X | 33.00 | |||||||||||||||||||||||||||
| 32.00 | 4 | 6 | 8 | 32.00 | |||||||||||||||||||||||||
| 31.00 | 3 | O | X | O | 8 | X | 31.00 | ||||||||||||||||||||||
| 30.00 | 2 | O | X | O | 7 | O | 7 | 30.00 | |||||||||||||||||||||
| 29.00 | X | 5 | O | X | O | 5 | 29.00 | ||||||||||||||||||||||
| 28.00 | 1 | O | X | 9 | X | 4 | 28.00 | ||||||||||||||||||||||
| 27.00 | X | C | O | O | B | O | C | • | 27.00 | ||||||||||||||||||||
| 26.00 | X | X | O | X | O | X | O | X | • | 26.00 | |||||||||||||||||||
| 25.00 | X | O | X | O | 6 | 7 | B | 4 | A | X | 9 | X | • | 25.00 | |||||||||||||||
| 24.00 | X | O | X | 5 | X | O | X | O | X | O | X | O | A | X | • | 24.00 | |||||||||||||
| 23.00 | O | X | 4 | O | X | O | X | O | X | O | X | O | • | 23.00 | |||||||||||||||
| 22.00 | O | X | O | O | 8 | C | • | 22.00 | |||||||||||||||||||||
| 21.00 | O | • | 21.00 | ||||||||||||||||||||||||||
| 21 | 23 | 24 | 26 |
| EQT EQT Corporation ($63.64) - Oil - After completing four consecutive buy signals EQT fell to a sell signal Tuesday when it broke a double bottom at $63. The outlook for the stock remains favorable, however, as EQT is a 4 for 5'er; from here, the next level of support is EQT's trend line at $59. |
| FCX Freeport-McMoRan Inc. ($58.78) - Metals Non Ferrous - FCX returned to a buy signal Tuesday when it broke a double top at $59. The outlook for the stock remains negative, however, as FCX is a 1 for 5'er. From here, the next level of overhead resistance is FCX's bearish resistance line at $62. |
| LNG Cheniere Energy, Inc. ($283.76) - Oil Service - After completing three consecutive buy signals, LNG fell to a sell signal when it broke a double bottom at $280 on Tuesday. The weight of the evidence remains positive, however, as LNG is a 4 for 5'er and ranks in the top half of the oil service sector matrix. From here, the next level of support sits at $272. |
| RIO Rio Tinto PLC (United Kingdom) ADR ($93.29) - Metals Non Ferrous - After giving three consecutive sell signals, RIO returned to a buy signal when it broke a double top at $92. The technical picture remains negative despite Tuesday's break as RIO is a 2 for 5'er; from here, the next level of resistance sits at $96. |
| SNOW Snowflake, Inc. Class A ($150.54) - Software - SNOW fell over 2% Tuesday to break a double bottom at $150 before falling to $146 intraday. This stock has given four consecutive sell signals and only has a 1 for 5 TA rating, confirming its weak technical picture. Avoid long exposure. Further support can be seen at $136. Overhead resistance can be seen at $158 and $166. |

| Name | Option Symbol | Action | Stop Loss |
|---|---|---|---|
| Cisco Systems, Inc. - $77.59 | O: 26G77.50D17 | Buy the July 77.50 calls at 5.65 | 72.00 |
| Name | Option | Action |
|---|---|---|
| Target Corporation ( TGT) | May. 115.00 Calls | Initiate an option stop loss of 6.70 (CP: 8.70) |
| Name | Option Symbol | Action | Stop Loss |
|---|---|---|---|
| Oracle Corporation - $147.00 | O: 26S150.00D17 | Buy the July 150.00 puts at 19.65 | 156.00 |
| Name | Option | Action |
|---|---|---|
| Abbott Laboratories ( ABT) | Aug. 115.00 Puts | Raise the option stop loss to 12.50 (CP: 14.50) |
| Best Buy Co., Inc. ( BBY) | May. 67.50 Puts | Stopped at 5.40 (CP: 5.15) |
| Airbnb, Inc. Class A ( ABNB) | May. 130.00 Puts | Stopped at 9.85 (CP: 9.60) |
| Dutch Bros Inc. Class A ( BROS) | Jul. 52.50 Puts | Stopped at 7.20 (CP: 7.10) |
| PDD Holdings Inc. ( PDD) | Jul. 105.00 Puts | Stopped at 9.75 (CP: 9.20) |
| Name | Option Sym. | Call to Sell | Call Price | Investment for 500 Shares | Annual Called Rtn. | Annual Static Rtn. | Downside Protection |
|---|---|---|---|---|---|---|---|
| Halliburton Company $ 39.26 | O: 26E40.00D15 | May. 40.00 | 2.00 | $ 18,654.50 | 50.05% | 34.59% | 4.09% |
| Name | Action |
|---|---|
| Fortinet Inc. ( FTNT) - 79.05 | Sell the May 85.00 Calls. |
| Invesco PLC ( IVZ) - 23.29 | Sell the May 24.00 Calls. |
| Palantir Technologies Inc. Class A ( PLTR) - 137.55 | Sell the July 150.00 Calls. |
| Name | Covered Write |
|---|---|
| DuPont de Nemours Inc. ( DD - 44.22 ) | May 45.00 covered write. |
| Citizens Financial Group Inc ( CFG - 57.45 ) | July 60.00 covered write. |
| Merck & Co., Inc. ( MRK - 118.10 ) | July 120.00 covered write. |
Daily Equity & Market Analysis
LISTEN TO PODCAST
Mar 26, 2026
Loading, Please Wait...
