
Most Requested Symbols

The average distribution reading is 28.76% overbought.
Today's featured stock is American Financial Group Inc (AFG).
ADI, DFS, BKH, CPRI, GRBK, SFIX, ZM, ESTC, SNX, FMC, ZBRA, AYX, SPG, & IR.
Call: Comcast Corporation (CMCSA), Put: The Walt Disney Company (DIS), Covered Write: Ford Motor Company (F).
The last few months have seen a significant shift back from value to growth. We will often focus on the large cap comparison, but we have seen the value versus growth difference significantly on the small cap side as well. The iShares Russell 2000 Value ETF (IWN) crossed below the acceptable 3.0 fund score mark on July 16th and now has a fund score of 2.75 with a negative score direction of -1.90. In the DALI allocation tool, the small cap value style has fallen from second to sixth since the beginning of July. IWN moved to sell signal on July 8th and went on to test support at $152 before rebounding to the middle of its trading band. Since the end of the second quarter, IWN has returned -3.43% while RPG, the Invesco S&P 500 Pure Growth ETF, has gained 6.14%. Moving forward it will be important to keep an eye on small cap value areas as we’ve seen higher relative strength out of large caps and growth areas over the past few months.


Each week the analysts at DWA review and comment on all major asset classes in the global markets. Shown below is the summary or snapshot of the primary technical indicators we follow for multiple areas. Should there be changes mid-week we will certainly bring these to your attention via the report.
| Universe | BP Col & Level (actual) | BP Rev Level | PT Col & Level (actual) | PT Rev Level | HiLo Col & Level (actual) | HiLo Rev Level | 10 Week Col & Level (actual) | 10 Week Rev Level | 30 Week Col & Level (actual) | 30 Week Rev Level |
|---|---|---|---|---|---|---|---|---|---|---|
| ALL |
|
50% |
|
62% |
|
58% |
|
32% |
|
42% |
| NYSE |
|
50% |
|
74% |
|
72% |
|
38% |
|
56% |
| OTC |
|
48% |
|
56% |
|
48% |
|
30% |
|
44% |
| World |
|
54% |
|
54% |
|
|
|
46% |
|
60% |
Beginning this week, the U.S. Senate has started discussions about the infrastructure bill (for full details on the bill, click here). While many have said it’s been a slow slog, many articles note the bipartisan support that the bill is receiving within the U.S. Senate (Source: Reuters). While the bill has yet to pass, we thought we’d begin a discussion on how investors could seek to play the bill and touch on those sectors and sub-sectors that may benefit or be impacted. Additionally, we will note which of these sub-sectors are currently exhibiting high relative strength and how users are able to utilize the DWA Security Screener in culling out high RS actionable stocks within these sub-sectors.
The image below shows the current rank of the sub-sectors that may be impacted most by the infrastructure bill within the DWA Sub-Sector Matrix. The DWA Sub-Sector matrix has 96 representatives within it and the table displays the rank of our select sub-sectors as of the close on August 3rd. Bear in mind that the infrastructure bill has not been passed and that the potential list of sub-sectors that may be impacted is very broad. The sub-sectors shown below are by no means the final list as by the time the bill is passed, the list could either be more or less than those shown. The degree to what sub-sectors may be impacted most is also possible to change as well, our goal was to simply cast a broad net and see what sub-sectors currently show high RS and those that don’t. The table is also organized by rank and divided by those that rank in the top half of the sub-sector matrix (in green) and those that rank in the bottom half of the matrix (in red).
In examining the sub-sector matrix, leadership currently lies within those sub-sectors that lie generally within the Industrials and Basic Materials broad economic sectors. This isn’t too surprising as these two broad sectors, and their subsequent sub-sectors, seem to be the ones to potentially benefit most from the infrastructure bill due to the focus on constructing new roads, bridges, and transportation thoroughfares, and both broad sectors have ranked within the upper half of the DALI sector rankings for much of this year. The remaining points of the current bill seeks to expand broadband access the rural areas, provide better access and incentives for electric car manufacturers, and improving the water quality along with reducing pollution. The bottom half of the sub-sector matrix ranking is where we currently find those sub-sectors related to communication improvements, water improvement, and pollution reduction. We may see some of these groups improve in relative strength and potentially climb the sub-sector rankings, but until the bill’s passage, we don’t know if that will come to fruition. As noted above, this is by no means the final list of sub-sectors that may benefit from the infrastructure bill, but it is a starting point. As we’ll discuss below, having these sectors as a starting point is a great way to look for potential stock ideas.

Within the DWA Security Screener, we can use the aforementioned sub-sectors discussed as the starting universe for a stocks query. This process can also be used to search for ideas within the broad economic sectors, DWA sectors, and even the sector indicators as well. To find the tool, click Security Selection, then Security Screener followed by Run Stocks Query. Once the query page has loaded, locate the blue universe box at the top of the page and find the Economic Sectors header near the bottom left of the blue box. After clicking the Click here to toggle sectors link, the universe box will expand and display all the broad sectors, DWA sectors, sub-sectors, and mini-sectors available on the platform. Select the desired sectors that would be the starting universe (in our example shown we have selected Heavy construction and Heavy Machinery) and then add the remainder of the technical criteria (technical attributes, positive trend, etc.) in the boxes below. Bear in mind, that the broad economic and DWA sectors that coincide with the sub-sector or mini sector will be checked off automatically, but the universe will focus on the group(s) of stocks from the lowest level selected. If you have any questions on what further criteria to use or how to utilize the tool, feel free to call the NDW team at (804) 320-8511. Additionally, stay tuned later this week as we discuss some potential stock plays based on the infrastructure bill.


| Symbol | Name | Price | Yield | PnF Trend | RS Signal | RS Col. | Fund Score | 200 Day MA | Weekly Mom |
|---|---|---|---|---|---|---|---|---|---|
| DIA | SPDR Dow Jones Industrial Average ETF Trust | 351.09 | 1.59 | Positive | O | 3.11 | 321.41 | +3W | |
| EEM | iShares MSCI Emerging Markets ETF | 52.19 | 1.48 | Positive | Sell | O | 1.79 | 52.81 | -5W |
| EFA | iShares MSCI EAFE ETF | 80.46 | 2.26 | Positive | Sell | O | 3.02 | 75.40 | +1W |
| FM | iShares MSCI Frontier and Select EM ETF | 33.14 | 2.08 | Positive | Sell | O | 3.65 | 30.01 | -5W |
| IJH | iShares S&P MidCap 400 Index Fund | 270.25 | 1.07 | Positive | Buy | O | 3.60 | 248.51 | -17W |
| IJR | iShares S&P SmallCap 600 Index Fund | 110.57 | 0.96 | Positive | Buy | X | 3.11 | 101.84 | -21W |
| QQQ | Invesco QQQ Trust | 366.81 | 0.48 | Positive | Buy | X | 4.74 | 323.38 | -1W |
| RSP | Invesco S&P 500 Equal Weight ETF | 153.73 | 1.31 | Positive | Buy | X | 5.35 | 137.35 | -13W |
| SPY | SPDR S&P 500 ETF Trust | 441.15 | 1.27 | Positive | O | 3.44 | 393.83 | -1W | |
| XLG | Invesco S&P 500 Top 50 ETF | 336.84 | 1.07 | Positive | O | 3.53 | 298.45 | -1W |
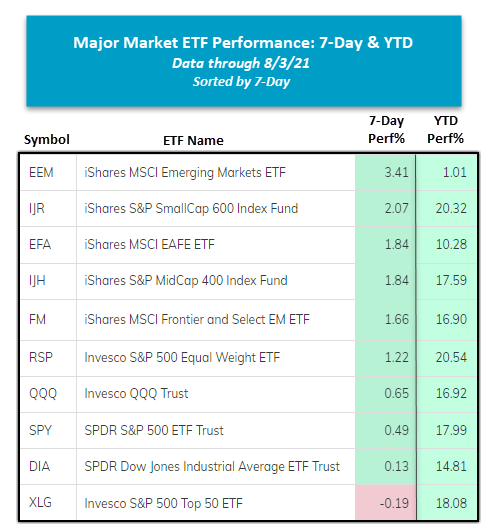
Overall, it was a bullish week of trading for the major market funds covered in this report as nine finished in positive territory while just one, the Invesco S&P 500 Top 50 ETF XLG, managed to finish in the red with a slight loss of -0.19%. Although this week’s price action didn’t cause any notable changes from a technical perspective, the iShares MSCI Emerging Markets ETF EEM experienced a rebound over the last seven days, gaining 3.41%, which pushed the fund back into the black for the year. On a year-to-date basis, the Invesco S&P 500 Equal Weight ETF RSP now leads all 10 major market funds as it has gained 20.53% on a price return basis, followed by the iShares S&P SmallCap 600 Index Fund IJR’s YTD return of 20.32%.
As of this writing, the US Equity Core Percentile Rank, which can be found on the Asset Class Group Scores page, is sitting at 98.59%, meaning that the “Core” market ranks in the 98th percentile versus all other asset classes around the world. The US Equity Core Rank, which is also known as the DWA S&P 500 Assets Percentile Rank, is sitting at lofty levels that are not often seen. Currently, each of the S&P 500-related major market ETFs covered in this report are trading at all-time highs, maintain Point & Figure buy signals on their default charts, and are trading in overall positive trends with fund scores well above the acceptable 3.0 threshold. In fact, on Monday, August 2, we saw the Invesco S&P 500 Equal Weight ETF RSP record a new all-time high with a move to $154, which also marked the fund’s fifth consecutive buy signal since May. With a solid fund score of 5.35 and a relatively neutral OBOS% reading of 37%, the RSP is actionable at current levels. The US Equity Core Percentile Rank is one more piece of evidence in favor of US Equities, which has ranked #1 in DALI since August 25, 2020. Click here to view our recent Core Percentile Ranking decile study published on July 8, 2021.

SECTOR BULLISH PERCENT CHANGES
| Reversed to X | Reversed to O |
|---|---|
| 15 (BPAERO | 40), (BPAUTO | 50), (BPBUIL | 54), (BPCHEM | 46), (BPCOMP | 46), (BPELEC | 52), (BPFINA | 56), (BPGAME | 34), (BPHEAL | 46), (BPINSU | 52), (BPMACH | 60), (BPMETA | 54), (BPSOFT | 52), (BPSTEE | 70), (BPTEXT | 54), |
0 |
| To Xs | To Os |
|---|---|
| Transports / Non Air ( 0.55 to 52 ) | None |
Average Level
50.16
| Sector |
|---|
| Biomedics/Genetics (28%) - Bull Correction |
| Sector |
|---|
| Aerospace Airline (40%) - Bear Correction |
| Autos & Parts (50%) - Bear Correction |
| Chemicals (46%) - Bear Correction |
| Computers (46%) - Bear Correction |
| Gaming (34%) - Bull Alert |
| Healthcare (46%) - Bull Confirmed |
| Internet (38%) - Bull Confirmed |
| Leisure (36%) - Bull Alert |
| Sector |
|---|
| Banks (58%) - Bear Confirmed |
| Utilities / Electric (56%) - Bear Confirmed |
| Foods Beverages/Soap (54%) - Bear Confirmed |
| Utilities / Gas (68%) - Bear Alert |
| Real Estate (76%) - Bull Confirmed |
| Savings & Loans (62%) - Bear Confirmed |
| Telephone (54%) - Bull Correction |
SECTOR INDICATOR CHART CHANGES
PT is the percentage of stocks within a sector that are trading above their bullish support lines. RSX is the percentage of stocks within a sector whose relative strength charts are in a column of Xs. RSP is the percentage of stocks within a sector whose relative strength charts are on a buy signal. The strongest sectors, i.e. market leaders, will have most of these indicators positive and moving higher in a column of Xs.
|
There were equal amounts of rising and falling sector PT charts this week, with 2 both rising and falling. The following sector charts rose: Semiconductors [^PTSEMI]-Rev. , Textiles/Apparel [^PTTEXT]-Rev. . The following sector charts fell: Household Goods [^PTHOUS], Telephone [^PTTELE]-Rev. . There were 2 that reversed to X and 1 that reversed to O. |
|
| ^PT Charts Reversing Up - | ^PT Charts Reversing Down - |
|
|
| ^PT Charts Moving Higher - | ^PT Charts Moving Lower - |
|
|
|
|
There were only falling sector RSX charts this week, with 11 falling and none rising. The following sector charts fell: Aerospace Airline [^RSXAERO], Autos and Parts [^RSXAUTO], Banks [^RSXBANK], Drugs [^RSXDRUG], Food Beverages/Soap [^RSXFOOD], Media [^RSXMEDI], Oil [^RSXOIL], Telephone [^RSXTELE], Textiles/Apparel [^RSXTEXT], Transports/Non Air [^RSXTRAN], Waste Management [^RSXWAST]. Waste Management [^RSXWAST] was the only sector RSX chart that moved to a sell signal, while none moved to a buy signal. |
|
| ^RSX Charts Reversing Up - | ^RSX Charts Reversing Down - |
|
|
|
| ^RSX Charts Moving Higher - | ^RSX Charts Moving Lower - |
|
|
|
|
There were only falling sector RSP charts this week, with 6 falling and none rising. The following sector charts fell: Drugs [^RSPDRUG], Gas Utilities [^RSPGUTI]-Rev. , Household Goods [^RSPHOUS], Internet [^RSPINET], Machinery and Tools [^RSPMACH], Transports/Non Air [^RSPTRAN]. There were 1 that reversed to O. |
|
| ^RSP Charts Reversing Up - | ^RSP Charts Reversing Down - |
|
|
|
| ^RSP Charts Moving Higher - | ^RSP Charts Moving Lower - |
|
|
|
FAVORED SECTOR STATUS CHANGES
A sector is considered to be Favored if it has 3 or 4 of the sector indicators (Relative Strength, RSX, RSP, & PT) positive, Average if it has 2 of the 4 indicators positive, & Unfavored if it has 0 or 1 of the indicators positive. The table below contains those sectors that have experienced a Favored Sector Status change over the past week. It is best to focus on sectors that are about 50% or lower on their Bullish Percent charts & are in Xs. Note: If a sector moves from Favored to Average, it doesn't necessarily mean that the sector in question has to be sold - it just means you need to evaluate your individual positions with exposure to that sector.
| Changes since 07/28/2021 | Full Report |
|
|
|
|
|||||||
|
|
|
|
|
|
|||||
|
|
|
|
|
|
|||||
|
|
|
|
|
|
|||||

There has been a significant amount of movement in certain foreign equity markets over the past month, however, the relative strength picture shown through our NDW Country Index Matrix ranking has remained largely unchanged, with no changes to the constituents of each quartile in July. The past week did see the Netherlands move back into the top-ranked position out of the 43 countries examined, with that country having maintained a rank of third or higher since November of last year. In fact, both the Netherlands and Sweden have been among the most consistent representatives in the country index matrix rankings, with the Netherlands remaining in the top quartile since December 2019 and Sweden staying in the top quartile since May 2020.

The technical pictures of fund representatives for both the Netherlands and Sweden also reveal similar movements over the past few months. The iShares MSCI Netherlands ETF EWN has moved largely sideways between $47 and $50 since April after giving nine consecutive buy signals since early 2020. The fund most recently reversed higher after finding support for the third time at $47 to break a double top at $49.50 in late July, matching its all-time high from June. EWN has maintained a favorable fund score with a recent posting of 5.54, which bests the average non-US equity fund (3.12) as well as the average European equity fund (3.52). Weekly momentum also recently flipped positive, suggesting the potential for further upside from here.
The iShares MSCI Sweden ETF EWD has also moved largely sideways since April, reaching a high of $49 in June before moving lower later that month to $45.50. The fund has pushed higher over the past few weeks to break a double top at $48 before pushing higher this week to match its all-time high of $49. Despite the near-term improvement, EWD is in actionable territory with an intraday weekly OBOS reading of 38% Wednesday. The fund possesses a favorable 4.44 recent fund score posting and has also shown a recent flip to positive weekly momentum, suggesting the potential for further upside.
Both of these funds have been among the strongest relative strength countries in international equities for over a year, showed a period of consolidation, and have now shown a recent attempt at breaking out of their respective trading ranges. Those looking to add exposure to developed market equities may look toward either representative at current levels or upon potential movement to new all-time highs.

US Treasury yields have continued lower this week. The US Treasury 10YR Yield Index TNX reached 1.15% on Wednesday, where it has now formed, but not broken a double bottom. A move to 1.125% would mark a fourth consecutive sell signal for the index.
The US Treasury Five-year Yield Index FVX gave a second consecutive sell signal when it reached 0.625% on Wednesday, its lowest level since February.

The decline in yields has been a tailwind for many parts of the fixed income market. The iShares US Core Bond ETF AGG has completed three consecutive buy signals and currently sits one box away from giving a fourth, which would come with a move to $117. AGG’s fund score remains in unfavorable territory at 2.11, although it has improved significantly from the lows it reached in April.
Convertible bonds, high yield bonds, and inflation protection remain areas of strength in the fixed income market as all three groups sport average scores north of 3.0 within the Asset Class Group Scores. The general bond-long group has joined the upper tier of fixed income groups as it crossed above the 3.0 score threshold within the last week. It currently shows the second-best score direction among fixed income groups at +1.33, trailing only the US Government-long group which has a positive 2.05 score direction. The movement in yields has been a net positive for the fixed income market at large; at this time there are only six fixed income groups with average scores below 2.5, which places them in the unfavorable/red zone. The Inverse-Fixed Income group is now the lowest-ranking fixed income group with an average score of 1.36, reflecting the generally positive movement in the market recently.
Remember, these are technical comments only. Just as you must be aware of fundamental data for the stocks we recommend based on technical criteria in the report, so too must you be aware of important data regarding delivery, market moving government releases, and other factors that may influence commodity pricing. We try to limit our technical comments to the most actively traded contracts in advance of delivery, but some contracts trade actively right up to delivery while others taper off well in advance. Be sure you check your dates before trading these contracts. For questions regarding this section or additional coverage of commodities email james.west@dorseywright.com.
Data represented in the table below is through 8/3/2021:
Broad Market Commodities Report
| Symbol | Name | Price | PnF Trend | RS Signal | RS Col. | 200 Day MA | Weekly Mom |
|---|---|---|---|---|---|---|---|
| CL/ | Crude Oil Continuous | 70.56 | Positive | Buy | X | 58.34 | -4W |
| DBLCIX | Deutsche Bank Liquid Commodities Index | 403.53 | Positive | Sell | O | 347.21 | -9W |
| DWACOMMOD | DWA Continuous Commodity Index | 716.13 | Positive | Buy | O | 637.43 | +3W |
| GC/ | Gold Continuous | 1810.10 | Positive | Buy | O | 1822.61 | +2W |
| HG/ | Copper Continuous | 4.38 | Positive | Buy | X | 3.95 | +3W |
| ZG/ | Corn (Electronic Day Session) Continuous | 550.50 | Negative | Buy | O | 548.30 | -11W |
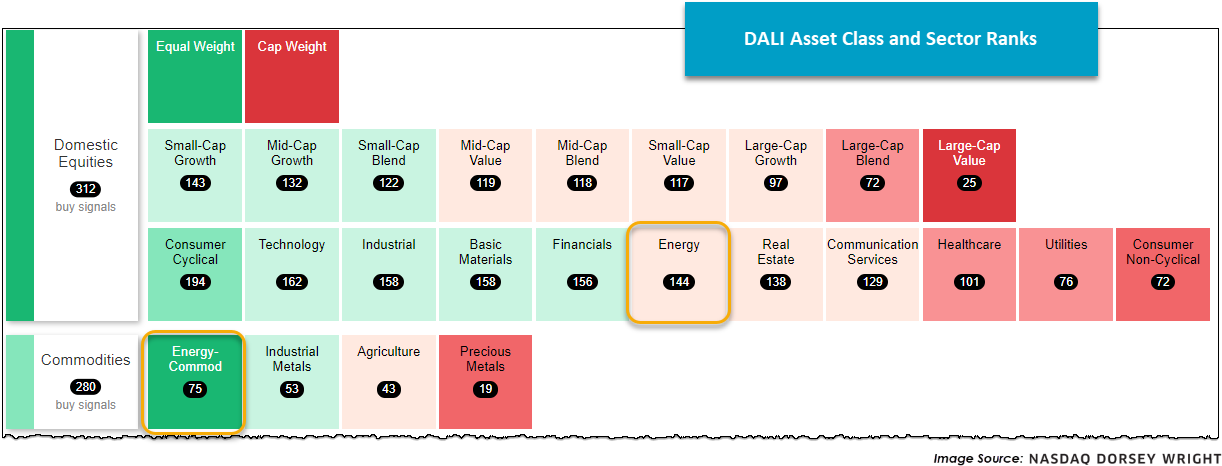
As we discussed in a DALI update last month and briefly in our Were You Aware from Monday, energy-related equities are weakening, recently falling from second to sixth in our DALI sector rankings. However, several of the underlying energy commodities tell a different story, as highlighted in the charts below.
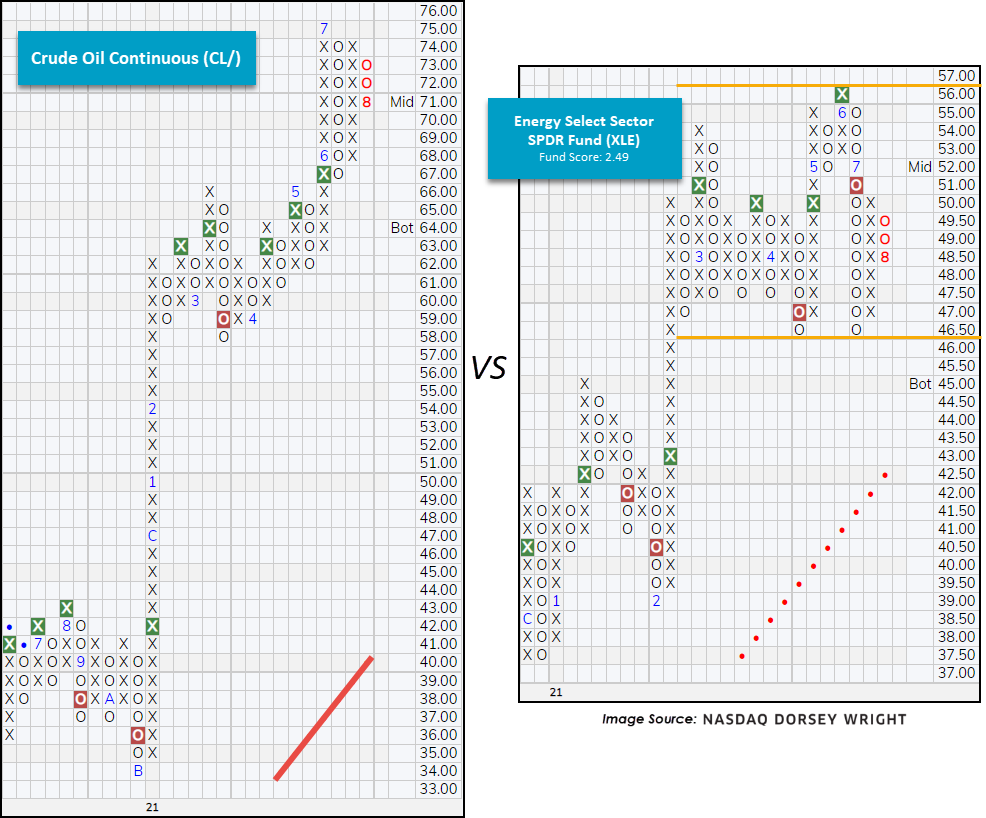

To begin, notice that the front month crude contract (CL/) remains in a discernable uptrend on three consecutive buy signals while the Energy Select Sector SPDR Fund (XLE) is in a consolidated posture and recently posted a lower top at $50. Similarly, we see the natural gas front month contract (NG/) trading on four consecutive buy signals, recently reversing back up into Xs yesterday, while the First Trust Natural Gas ETF (FCG) reversed down into Os and trades on consecutive sell signals.
To reconcile these charts, keep in mind that front month commodity contracts will (typically) be more sensitive to the current supply and demand story than equities. For example, OPEC’s latest decision to increase production affected the front month crude contract more dramatically than the equity-related holdings of XLE because equities are generally more forward looking. For natural gas, given the unusually hot summer temperatures experienced across the country, current demand levels are elevated, driving up the price of natural gas futures (among other variables). Although this certainly does not tell the full story, it can help us make sense of the disconnect between energy equities and commodities.
Average Level
28.76
| AGG | iShares US Core Bond ETF |
| USO | United States Oil Fund |
| DIA | SPDR Dow Jones Industrial Average ETF |
| DVY | iShares Dow Jones Select Dividend Index ETF |
| DX/Y | NYCE U.S.Dollar Index Spot |
| EFA | iShares MSCI EAFE ETF |
| FXE | Invesco CurrencyShares Euro Trust |
| GLD | SPDR Gold Trust |
| GSG | iShares S&P GSCI Commodity-Indexed Trust |
| HYG | iShares iBoxx $ High Yield Corporate Bond ETF |
| ICF | iShares Cohen & Steers Realty ETF |
| IEF | iShares Barclays 7-10 Yr. Tres. Bond ETF |
| LQD | iShares iBoxx $ Investment Grade Corp. Bond ETF |
| IJH | iShares S&P 400 MidCap Index Fund |
| ONEQ | Fidelity Nasdaq Composite Index Track |
| QQQ | Invesco QQQ Trust |
| RSP | Invesco S&P 500 Equal Weight ETF |
| IWM | iShares Russell 2000 Index ETF |
| SHY | iShares Barclays 1-3 Year Tres. Bond ETF |
| IJR | iShares S&P 600 SmallCap Index Fund |
| SPY | SPDR S&P 500 Index ETF Trust |
| TLT | iShares Barclays 20+ Year Treasury Bond ETF |
| GCC | WisdomTree Continuous Commodity Index Fund |
| VOOG | Vanguard S&P 500 Growth ETF |
| VOOV | Vanguard S&P 500 Value ETF |
| EEM | iShares MSCI Emerging Markets ETF |
| XLG | Invesco S&P 500 Top 50 ETF |
Relative strength is a measure of how a stock is performing when compared to something else, in this case the S&P 500 Equal Weighted Index (SPXEWI). Each day the stock's closing price is divided by that of the SPXEWI, the resulting numbers decimal is moved two places and then plotted on a Point & Figure chart. Whenever the relative strength chart shows a double top buy signal (e.g. RS Buy or Positive Relative Strength), it suggests the stock is likely to outperform the market for the foreseeable future. Conversely, whenever the relative strength chart gives a double bottom sell signal (e.g. RS Sell or Negative Relative Strength) it suggests the stock will under-perform the market. Relative strength signals tend to last roughly 18 to 24 months on average. Consequently, changes from buy signals to sell signals (and vice versa) are important to be aware of as they are longer-term implications of a stock's likely performance versus the indices. Using the Point & Figure chart along with the relative strength chart will allow you to better ascertain risk-reward and other trade management tools, but we always want to over-weight our portfolios toward those stocks that are on RS buy signals, giving us the best chance of outperforming the broader market.
In the Optionable Universe, this week we saw 15 relative strength buy signals compared to 9 last week. On the sell side, there were 25 relative strength sell signals compared to 32 last week.
| Symbol | Company | Sector | Price | RS vs Market Signal | RS vs Market Column | RS vs Peer Signal | RS vs Peer Column | Tech Attrib |
|---|---|---|---|---|---|---|---|---|
| AB | AllianceBernstein Holding LP | Financial Services | 50.230 | Buy | X | Sell | X |
|
| CACC | Credit Acceptance Corp MI | Financial Services | 541.150 | Buy | X | Buy | X |
|
| DXCM | Dexcom Inc. | Medical Products | 521.220 | Buy | X | Sell | X |
|
| HLIT | Harmonic Inc | Communications Technology | 10.630 | Buy | X | Buy | X |
|
| HOLI | Hollysys Automation Technologies Ltd. | Industrial Goods & Svcs | 19.870 | Buy | X | Sell | X |
|
| MXL | MaxLinear, Inc. | Semiconductors | 49.140 | Buy | X | Buy | X |
|
| ARCT | Arcturus Therapeutics Ltd. | Pharmaceuticals | 58.250 | Buy | X | Sell | X |
|
| TEAM | Atlassian Corp. PLC | Software | 329.420 | Buy | X | Buy | X |
|
| ARCH | Arch Resources Inc | Coal | 66.390 | Buy | X | Buy | X |
|
| TEAM.TR | Atlassian Corp. PLC TR | Software | 329.420 | Buy | X | Buy | X |
|
| DXCM.TR | Dexcom Inc TR | Medical Products | 521.220 | Buy | X | Sell | X |
|
| ARCT.TR | Arcturus Therapeutics Ltd. TR | Pharmaceuticals | 58.250 | Buy | X | Sell | X |
|
| CACC.TR | Credit Acceptance Corp MI TR | Financial Services | 541.150 | Buy | X | Buy | X |
|
| HLIT.TR | Harmonic Inc TR | Communications Technology | 10.630 | Buy | X | Buy | X |
|
| HOLI.TR | Hollysys Automation Technologies Ltd. TR | Industrial Goods & Svcs | 19.870 | Buy | X | Buy | X |
|
| Symbol | Company | Sector | Price | RS vs Market Signal | RS vs Market Column | RS vs Peer Signal | RS vs Peer Column | Tech Attrib |
|---|---|---|---|---|---|---|---|---|
| BSET | Bassett Furniture Industries | Cyclical Goods and Services | 22.250 | Sell | O | Buy | O |
|
| PRG | PROG Holdings Inc. | Retail | 42.710 | Sell | O | Sell | O |
|
| CNK | Cinemark Holdings Inc. | Cyclical Goods and Services | 15.070 | Sell | O | Sell | O |
|
| BGS | B&G Foods, Inc. | Food and Beverage | 28.900 | Sell | O | Sell | O |
|
| MVIS | Microvision Inc | Medical Products | 12.470 | Sell | O | Sell | O |
|
| PCAR | PACCAR Inc. | Industrial Goods & Svcs | 81.850 | Sell | O | Sell | O |
|
| IPGP | IPG Photonics Corp. | Semiconductors | 177.690 | Sell | O | Sell | O |
|
| POST | Post Holdings Inc | Food and Beverage | 102.000 | Sell | O | Buy | O |
|
| MACK | Merrimack Pharmaceuticals Inc | Pharmaceuticals | 5.180 | Sell | O | Sell | O |
|
| SHEN | Shenandoah Telecommunications Company | Fixed Line Communications | 29.580 | Sell | O | Sell | O |
|
| BNFT | Benefitfocus, Inc. | Software | 12.870 | Sell | O | Sell | O |
|
| SPNE | SeaSpine Holdings Corp | Medical Products | 15.750 | Sell | O | Sell | O |
|
| SRRA | Sierra Oncology Inc. | Biotechnology | 16.400 | Sell | O | Buy | O |
|
| NVCR | Novocure | Medical Products | 149.130 | Sell | O | Buy | O |
|
| PETQ | PetIQ, Inc. Class A | Pharmaceuticals | 35.310 | Sell | O | Buy | O |
|
| ATUS | Altice USA, Inc. Class A | Media | 30.180 | Sell | O | Sell | O |
|
| LBRT | Liberty Oilfield Services Inc. Class A | Oil Drilling, Equipment Svcs | 10.240 | Sell | O | Sell | O |
|
| IPGP.TR | IPG Photonics Corp. TR | Semiconductors | 177.690 | Sell | O | Sell | O |
|
| MKSI.TR | MKS Instrument, Inc. TR | Industrial Goods & Svcs | 157.948 | Sell | O | Buy | O |
|
| ATUS.TR | Altice USA, Inc. Class A TR | Media | 30.180 | Sell | O | Sell | O |
|
| NVCR.TR | NovoCure Ltd. TR | Medical Products | 149.130 | Sell | O | Buy | O |
|
| BNFT.TR | Benefitfocus, Inc. TR | Software | 12.870 | Sell | O | Sell | O |
|
| MACK.TR | Merrimack Pharmaceuticals Inc TR | Pharmaceuticals | 5.180 | Sell | O | Sell | O |
|
| MVIS.TR | Microvision Inc TR | Medical Products | 12.470 | Sell | O | Sell | O |
|
| SRRA.TR | Sierra Oncology Inc. TR | Biotechnology | 16.400 | Sell | O | Buy | O |
|
| Symbol | Company | Sector | Current Price | Action Price | Target | Stop | Notes |
|---|---|---|---|---|---|---|---|
| GFL | GFL Environmental Inc | Waste Management | $34.55 | low to upper 30s | 38 | 26 | 5 for 5'er, 5 consec buy signals, pullback from ATH |
| AKR | Acadia Realty Trust | Real Estate | $21.08 | 20 - 22 | 28 | 18 | 4 for 5'er, #6 of 154 in REAL sector matrix, one box from RS buy signal, 2.7% yield |
| STOR | Store Capital Corp. | Real Estate | $35.93 | mid-to-upper 30s | 47.50 | 30 | 5 for 5'er, multiple buy signals, one box from 52-week high, 4.1% yield, R-R>2.0 Earn. 8/5 |
| RVNC | Revance Therapeutics, Inc | Biomedics/Genetics | $30.15 | hi 20s - low 30s | 40 | 26 | 5 for 5'er, top 25% of BIOM sector matrix, quad top breakout, positive trend change, pos monthly mom flip Earnings 8/4 |
| NDLS | Noodles & Company | Restaurants | $12.13 | 11.50 - 13.50 | 20 | 10 | 5 for 5'er, #1 of 28 in REST sector matrix, triple top, pullback to mid of trading band, R-R>2.5 Earnings 8/3 |
| SEM | Select Medical Holdings Corporation | Healthcare | $39.66 | hi 30s - low 40s | 58 | 35 | 5 for 5'er, #8 of 116 names in favored HEAL sector matrix, multiple buy signals, good R-R, Earn. 8/5 |
| JBL | Jabil Circuit, Inc. | Electronics | $60.01 | low to high 50s | 73 | $47 | 4 for 5'er, multi-year highs, consecutive buy signals, top 10% of DWAELEC Earnings 9/22 |
| OXY | Occidental Petroleum Corporation | Oil | $26.43 | upper 20s - lower 30s | 33.50 | 22 | 3 for 5'er, top half of favored OIL sector matrix, bullish triangle, pullback from 52-week high, Earn 8/3 |
| TW | Tradeweb Markets, Inc. Class A | Business Products | $87.50 | 80s | 100 | 71 | 4 for 5'er, top 20% of BUSI sector matrix, triple top, pullback from ATH |
| UNH | UnitedHealth Group Incorporated | Healthcare | $421.90 | 390-420 | 496 | 340 | 4 for 5'er, top half of favored DWAHEAL matrix, consec buy signals, pullback from ATH, pos weekly mom flip, 1.38% yield |
| MS | Morgan Stanley | Wall Street | $96.60 | 90s | 109 | 83 | 5 for 5'er, top 10% of WALL sector matrix, spread triple top, LT pos mkt RS, 3.1% yield |
| ENTG | Entegris Inc. | Semiconductors | $122.74 | 110s to high 120s | 170 | 95 | 5 for 5'er, pullback from ATH, long-term market RS buy signal, top 25% of DWASEMI |
| GGG | Graco Inc | Machinery and Tools | $79.71 | mid 70s to low 80s | 108 | 64 | 4 for 5'er, consec buy signals, pullback from ATH, 1 box from bullish triangle, pos weekly momentum, long-term market & peer RS buy signals |
| DHI | D.R. Horton, Inc. | Building | $97.55 | 90s | 109 | 79 | 4 for 5'er, top 25% of BUIL sector matrix, LT pos mkt RS, spread quad top breakout, pos. trend change |
| AA | Alcoa Inc. | Metals Non Ferrous | $40.38 | mid to upper 30s to mid 40s | 56 | 30 | 4 for 5'er, bearish signal reversal pattern, pullback from multi-year highs, pos weekly mom flip, long-term market RS buy signal |
| ODFL | Old Dominion Freight Line, Inc. | Transports/Non Air | $273.82 | 250s to 280s | 324 | 216 | 5 for 5'er, pullback from ATH, 5 consec buy signals, LT market RS, pos weekly momentum, top 1/3 DWATRANS |
| ARCH | Arch Resources Inc | Oil | $66.39 | mid-to-upper 60s | 85 | 56 | 5 for 5'er, top 10% of oil sector matrix, bullish catapult, pullback from 52-wk high, R-R~2.0 |
| FB | Facebook Inc. | Internet | $351.24 | 340s - 360s | 460 | 304 | 4 for 5'er, top third of INET sector matrix, triple top breakout, pullback from ATH, R-R>2.0 |
| CMC | Commercial Metals Corporation | Steel/Iron | $32.52 | low to mid 30s | 36 | 26 | 5 for 5er, 2 weeks pos weekly mom, 4 consec buy signals, pullback from multi-year high, 1.46% yield |
| AFG | American Financial Group Inc | Insurance | $127.81 | high 120s - high 130s | 152 | 106 | 5 for 5'er, #5 of 65 names in INSU sector matrix, multiple consec buy signals, triple top breakout |
| Symbol | Company | Sector | Current Price | Action Price | Target | Stop | Notes |
|---|---|---|---|---|---|---|---|
| OPEN | Opendoor Technologies Inc. | Wall Street | $14.17 | low to mid 10s | 2 | 19.50 | 0 for 5'er, 4 consecutive sell signals, negative trend, bottom of DWAWALL matrix, negative monthly momentum, Earn. 8/11 |
| RAMP | Liveramp Holdings Inc. | Business Products | $39.67 | high 40s to high 30s | 36 | 51 | 0 for 5'er, 10 consec sell signals, 52 week lows, negative monthly mom flip, negative trend |
| Symbol | Company | Sector | Current Price | Action Price | Target | Stop | Notes |
|---|---|---|---|---|---|---|---|
| UE | Urban Edge Properties | Real Estate | $18.79 | 18 - 19.50 | 29.50 | 16 | UE hit our stop in Wednesday's trading. |
| VEEV | Veeva Systems Inc. | Software | $338.05 | 302s - 330s | 416 | 276 | VEEV has moved into heavily overbought territory. OK to hold here. Maintain $276 stop. Earn. 8/25 |
| Comment | |||||||
|---|---|---|---|---|---|---|---|
|
|
|||||||
AFG American Financial Group Inc R ($130.20) - Insurance - AFG is a 5 for 5'er that ranks fifth out of 65 names in the insurance sector matrix. On its default chart, AFG gas given five consecutive buy signals, most recently breaking a triple top at $128 late last month. Long exposure may be added in the high $120s to high $130s and we will set our initial stop at $106, which would take out multiple levels of support on AFG's default chart. Using a modified vertical price objective based on the most recent buy signal we will set our target price at $152.
| 21 | ||||||||||||||||||||||||||||||||||||||||||||||||||||||
| 140.00 | X | 140.00 | ||||||||||||||||||||||||||||||||||||||||||||||||||||
| 138.00 | X | O | 138.00 | |||||||||||||||||||||||||||||||||||||||||||||||||||
| 136.00 | X | O | 136.00 | |||||||||||||||||||||||||||||||||||||||||||||||||||
| 134.00 | 6 | O | 134.00 | |||||||||||||||||||||||||||||||||||||||||||||||||||
| 132.00 | X | O | 132.00 | |||||||||||||||||||||||||||||||||||||||||||||||||||
| 130.00 | X | O | X | 8 | 130.00 | |||||||||||||||||||||||||||||||||||||||||||||||||
| 128.00 | X | O | X | O | x | 128.00 | ||||||||||||||||||||||||||||||||||||||||||||||||
| 126.00 | 5 | O | X | X | X | O | x | Mid | 126.00 | |||||||||||||||||||||||||||||||||||||||||||||
| 124.00 | X | O | X | O | X | O | X | O | 124.00 | |||||||||||||||||||||||||||||||||||||||||||||
| 122.00 | X | O | X | O | X | O | X | 122.00 | ||||||||||||||||||||||||||||||||||||||||||||||
| 120.00 | X | 4 | O | X | O | 7 | 120.00 | |||||||||||||||||||||||||||||||||||||||||||||||
| 118.00 | X | O | X | O | 118.00 | |||||||||||||||||||||||||||||||||||||||||||||||||
| 116.00 | X | O | X | 116.00 | ||||||||||||||||||||||||||||||||||||||||||||||||||
| 114.00 | X | 3 | O | 114.00 | ||||||||||||||||||||||||||||||||||||||||||||||||||
| 112.00 | X | O | X | 112.00 | ||||||||||||||||||||||||||||||||||||||||||||||||||
| 110.00 | X | O | X | Bot | 110.00 | |||||||||||||||||||||||||||||||||||||||||||||||||
| 108.00 | X | O | 108.00 | |||||||||||||||||||||||||||||||||||||||||||||||||||
| 106.00 | X | 106.00 | ||||||||||||||||||||||||||||||||||||||||||||||||||||
| 104.00 | X | 104.00 | ||||||||||||||||||||||||||||||||||||||||||||||||||||
| 102.00 | X | 102.00 | ||||||||||||||||||||||||||||||||||||||||||||||||||||
| 100.00 | X | 100.00 | ||||||||||||||||||||||||||||||||||||||||||||||||||||
| 99.00 | X | 99.00 | ||||||||||||||||||||||||||||||||||||||||||||||||||||
| 98.00 | X | 98.00 | ||||||||||||||||||||||||||||||||||||||||||||||||||||
| 97.00 | X | 97.00 | ||||||||||||||||||||||||||||||||||||||||||||||||||||
| 96.00 | X | 96.00 | ||||||||||||||||||||||||||||||||||||||||||||||||||||
| 95.00 | X | • | 95.00 | |||||||||||||||||||||||||||||||||||||||||||||||||||
| 94.00 | X | X | 2 | X | • | 94.00 | ||||||||||||||||||||||||||||||||||||||||||||||||
| 93.00 | X | O | • | X | O | X | O | X | • | 93.00 | ||||||||||||||||||||||||||||||||||||||||||||
| 92.00 | X | O | X | • | X | O | X | O | X | • | 92.00 | |||||||||||||||||||||||||||||||||||||||||||
| 91.00 | X | X | O | X | O | X | O | O | • | 91.00 | ||||||||||||||||||||||||||||||||||||||||||||
| 90.00 | X | O | X | O | X | X | O | X | • | 90.00 | ||||||||||||||||||||||||||||||||||||||||||||
| 89.00 | X | O | X | C | X | O | X | O | X | • | 89.00 | |||||||||||||||||||||||||||||||||||||||||||
| 88.00 | X | O | O | X | O | X | X | O | X | • | 88.00 | |||||||||||||||||||||||||||||||||||||||||||
| 87.00 | X | X | O | O | X | O | X | O | X | • | 87.00 | |||||||||||||||||||||||||||||||||||||||||||
| 86.00 | X | O | X | O | X | O | X | O | X | • | 86.00 | |||||||||||||||||||||||||||||||||||||||||||
| 85.00 | X | O | X | O | X | 1 | O | X | • | 85.00 | ||||||||||||||||||||||||||||||||||||||||||||
| 84.00 | X | O | X | O | X | O | X | • | 84.00 | |||||||||||||||||||||||||||||||||||||||||||||
| 83.00 | X | O | O | O | X | • | 83.00 | |||||||||||||||||||||||||||||||||||||||||||||||
| 82.00 | X | O | X | • | 82.00 | |||||||||||||||||||||||||||||||||||||||||||||||||
| 81.00 | X | • | O | X | • | 81.00 | ||||||||||||||||||||||||||||||||||||||||||||||||
| 80.00 | X | • | O | • | 80.00 | |||||||||||||||||||||||||||||||||||||||||||||||||
| 79.00 | X | X | • | • | 79.00 | |||||||||||||||||||||||||||||||||||||||||||||||||
| 78.00 | X | O | X | • | 78.00 | |||||||||||||||||||||||||||||||||||||||||||||||||
| 77.00 | X | O | X | • | 77.00 | |||||||||||||||||||||||||||||||||||||||||||||||||
| 76.00 | X | X | B | O | X | • | 76.00 | |||||||||||||||||||||||||||||||||||||||||||||||
| 75.00 | X | X | O | X | O | X | O | • | 75.00 | |||||||||||||||||||||||||||||||||||||||||||||
| 74.00 | X | O | X | O | X | O | X | • | 74.00 | |||||||||||||||||||||||||||||||||||||||||||||
| 73.00 | • | X | O | X | O | O | X | • | 73.00 | |||||||||||||||||||||||||||||||||||||||||||||
| 72.00 | X | • | X | O | X | O | • | 72.00 | ||||||||||||||||||||||||||||||||||||||||||||||
| 71.00 | X | O | • | X | O | X | • | 71.00 | ||||||||||||||||||||||||||||||||||||||||||||||
| 70.00 | X | O | X | • | • | X | O | • | 70.00 | |||||||||||||||||||||||||||||||||||||||||||||
| 69.00 | X | O | 9 | O | X | • | X | • | 69.00 | |||||||||||||||||||||||||||||||||||||||||||||
| 68.00 | X | O | X | O | X | O | • | A | • | 68.00 | ||||||||||||||||||||||||||||||||||||||||||||
| 67.00 | X | O | X | O | X | O | X | • | X | • | 67.00 | |||||||||||||||||||||||||||||||||||||||||||
| 66.00 | • | X | O | X | O | O | X | O | X | • | 66.00 | |||||||||||||||||||||||||||||||||||||||||||
| 65.00 | • | • | X | O | O | X | O | X | • | 65.00 | ||||||||||||||||||||||||||||||||||||||||||||
| 64.00 | • | X | • | • | X | O | • | O | X | • | 64.00 | |||||||||||||||||||||||||||||||||||||||||||
| 63.00 | X | O | X | • | X | • | • | O | • | 63.00 | ||||||||||||||||||||||||||||||||||||||||||||
| 62.00 | O | X | O | X | O | 8 | • | • | 62.00 | |||||||||||||||||||||||||||||||||||||||||||||
| 61.00 | O | X | X | O | X | O | X | • | 61.00 | |||||||||||||||||||||||||||||||||||||||||||||
| 60.00 | 7 | X | O | X | O | O | X | • | 60.00 | |||||||||||||||||||||||||||||||||||||||||||||
| 59.00 | O | X | O | X | • | O | • | 59.00 | ||||||||||||||||||||||||||||||||||||||||||||||
| 58.00 | O | O | X | • | • | 58.00 | ||||||||||||||||||||||||||||||||||||||||||||||||
| 57.00 | O | • | 57.00 | |||||||||||||||||||||||||||||||||||||||||||||||||||
| 21 |
| ADI Analog Devices, Inc. ($173.14) - Semiconductors - ADI broke a double top at $172 to return to a buy signal and rallied up to $174 for a new all-time high. ADI is a 3 for 5'er that maintains long-term and near-term positive RS versus the market. Okay to consider here on the breakout or on a pullback to $168 on the chart. Initial support lies at the bullish support lie at $158. |
| AYX Alteryx Inc ($68.36) - Software - AYX fell Wednesday after their earnings release to complete a bearish triangle at $74 before falling over 13% intraday to mark a new multi-year low at $67. This unfavorable 0 for 5'er moved to a negative trend in February and ranks in the bottom decile of the software sector RS matrix. The overall weight of the evidence is decidedly negative, however, AYX is now in heavily oversold territory so those with current positions may look toward the stock as a sell-on-rally candidate. Initial overhead resistance may be seen at $79. |
| BKH Black Hills Corporation ($69.89) - Utilities/Electricity - BKH broke a double top at $70 on Wednesday, marking the stock’s fourth consecutive buy signal. BKH is a 1 for 5’er within the utilities/electricity sector that just experienced a flip to positive weekly momentum. From here, support sits at $66. Note BKH yields 3.32%. |
| CPRI Capri Holdings Ltd ($58.53) - Retailing - CPRI is a 4 for 5’er within the retailing sector that is showing superior strength versus the broader market. On Wednesday, CPRI broke a spread triple top at $60, marking a new 52 week high for the stock. Weekly momentum just flipped positive, suggesting the potential for higher prices. From here, support sits at $56. |
| DFS Discover Financial Services ($126.48) - Finance - DFS broke a double top at $128 for a fourth consecutive buy signal and a new high on the chart. DFS is 4 for 5'er that ranks in the top quartile of the Finance sector matrix. DFS maintains a yield of roughly 1.6% and can be considered here on the breakout or on a pullback to $122 on the chart. Support lies in the $112 to $116 range. |
| ESTC Elastic NV ($150.31) - Software - ESTC moved higher Wednesday to break a double top at $150. This 3 for 5'er moved to a positive trend in June and ranks in the top quartile of the software sector RS matrix. The weight of the evidence is positive here. Initial support may be found at $142 with further support offered at $136. Overhead resistance may come initially at $152. Note that earnings are expected on 8/24. |
| FMC FMC Corporation ($98.63) - Chemicals - FMC violated its trend in Wednesday's trading, which will drop it to an unfavorable 2 for 5'er; it now sits against support at $99. FMC also ranks in the bottom decile of the chemicals sector matrix. Long exposure should be avoided. |
| GRBK Green Brick Partners Inc. ($24.61) - Building - GRBK is a 3 for 5’er within the building sector that returned to a buy signal today with a double top breakout at $26. Weekly momentum has been positive for three weeks, suggesting the potential for higher prices, and GRBK is trading well above the bullish support line. From here, support sits at $21 while GRBK faces resistance at $28, the stock’s rally high. |
| IR Ingersoll-Rand Inc. ($50.32) - Machinery and Tools - Shares of IR returned to a buy signal on Wednesday with a double top break at $50 and later pushed past subsequent resistance to $51. The 4 for 5'er returned to an RS buy signal in September of last year, trades well-above its bullish support line, and has now seen five weeks of positive momentum. Demand is in control. Further bullish confirmation would come with a move past $52, which would break it out of its trading range since March of this year. Initial support is offered at around $46. |
| SFIX Stitch Fix Inc ($48.08) - Retailing - SFIX broke a double bottom at $50 before moving lower to $49 today. This marks the stock’s third consecutive sell signal in the last month. SFIX is an unacceptable 1 for 5’er within the retailing sector that has been trading in a negative trend since March. Avoid as supply is in control. From here, additional support sits at $38. |
| SNX SYNNEX Corporation ($120.97) - Computers - SNX pushed higher Wednesday to complete a bearish signal reversal with a double top break at $122. This 5 for 5'er has maintained a positive trend since May 2020 and ranks 9th out of 44 names in the computers sector RS matrix. The weight of the technical evidence is positive here. Initial support can be found at $110. |
| SPG Simon Property Group, Inc. ($128.70) - Real Estate - Shares of SPG returned to a buy signal on Wednesday with a double top breakout at $132, completing a bearish signal reversal pattern. The 5 for 5'er remains in the top quartile of the real estate stock sector matrix and recently returned to an RS buy signal versus the market in June of this year. Demand is in control and those looking to add exposure may consider SPG on this breakout or upon further bullish confirmation which would come with a move to $134. Initial support is offered at around $116. Note SPG also offers a yield of 4.43%. |
| ZBRA Zebra Technologies Corp ($560.00) - Electronics - Shares of ZBRA rose Wednesday after their earnings release to break a double top at $560, marking a sixth consecutive buy signal and a new all-time high. This 5 for 5'er moved to a positive trend in April 2020 and ranks 9th out of 63 names in the electronics sector RS matrix. Exposure may be considered on this breakout, with initial support offered at $528. Further support can be seen at $504, $488, and $456. |
| ZM Zoom Video Communications, Inc. Class A ($400.90) - Telephone - ZM is a 4 for 5’er within the telephone sector that broke a double top at $400 with Wednesday’s intraday action, marking the second consecutive buy signal on the chart. From here, support sits at $364 while ZM is testing overhead resistance at current levels. |
| Name | Option Symbol | Action | Stop Loss |
|---|---|---|---|
| Comcast Corporation - $57.97 | CMCSA2119K57.5 | Buy the November 60.00 calls at 3.05 | 54.00 |
| Name | Option | Action |
|---|---|---|
| Amphenol Corporation ( APH) | Oct. 67.50 Calls | Raise the option stop loss to 4.50 (CP: 6.50) |
| Name | Option Symbol | Action | Stop Loss |
|---|---|---|---|
| The Walt Disney Company - $172.57 | DIS2115V175 | Buy the October 175.00 puts at 9.15 | 182.00 |
| Name | Option | Action |
|---|---|---|
| Fastly, Inc. Class A (FSLY) | Dec. 55.00 Puts | Raise the option stop loss to 11.90 (CP: 13.90) |
| Name | Option Sym. | Call to Sell | Call Price | Investment for 500 Shares | Annual Called Rtn. | Annual Static Rtn. | Downside Protection |
|---|---|---|---|---|---|---|---|
| Ford Motor Company $14.02 | F2119K14 | Nov. 14.00 | 0.90 | $6,316.45 | 33.30% | 20.44% | 5.65% |
| Name | Action |
|---|---|
| Cleveland-Cliffs Inc. (CLF) - 24.39 | Sell the October 22.00 Calls. |
| Antero Resources Corp (AR) - 13.47 | Sell the November 15.00 Calls. |
| United States Steel Corporation (X) - 25.87 | Sell the October 25.00 Calls. |
| CommScope Holding Company, Inc. (COMM) - 20.88 | Sell the November 21.00 Calls. |
| Cloudflare Inc Class A (NET) - 119.57 | Sell the November 115.00 Calls. |
| Mosaic Company (MOS) - 31.34 | Sell the December 32.00 Calls. |
| Dick's Sporting Goods, Inc. (DKS) - 108.25 | Sell the December 110.00 Calls. |
| Halliburton Company (HAL) - 20.37 | Sell the October 21.00 Calls. |
| The Trade Desk Inc (TTD) - 83.16 | Sell the November 90.00 Calls. |
| Green Plains Inc. (GPRE) - 37.78 | Sell the December 36.00 Calls. |
| Alcoa Inc. (AA) - 40.38 | Sell the November 42.00 Calls. |
| Nucor Corporation (NUE) - 106.67 | Sell the October 105.00 Calls. |
| Biocryst Pharmaceuticals Inc (BCRX) - 16.76 | Sell the December 18.00 Calls. |
| Name | Covered Write |
|---|---|
|
|
|
Daily Equity & Market Analysis
LISTEN TO PODCAST
Apr 02, 2026
Loading, Please Wait...
