Raw commodities are holding up better than their equity-related counterparts, particularly in the energy and natural gas markets
Remember, these are technical comments only. Just as you must be aware of fundamental data for the stocks we recommend based on technical criteria in the report, so too must you be aware of important data regarding delivery, market moving government releases, and other factors that may influence commodity pricing. We try to limit our technical comments to the most actively traded contracts in advance of delivery, but some contracts trade actively right up to delivery while others taper off well in advance. Be sure you check your dates before trading these contracts. For questions regarding this section or additional coverage of commodities email james.west@dorseywright.com.
Data represented in the table below is through 8/3/2021:
Broad Market Commodities Report
Portfolio View - Commodity Indices
| Symbol | Name | Price | PnF Trend | RS Signal | RS Col. | 200 Day MA | Weekly Mom |
|---|---|---|---|---|---|---|---|
| CL/ | Crude Oil Continuous | 70.56 | Positive | Buy | X | 58.34 | -4W |
| DBLCIX | Deutsche Bank Liquid Commodities Index | 403.53 | Positive | Sell | O | 347.21 | -9W |
| DWACOMMOD | DWA Continuous Commodity Index | 716.13 | Positive | Buy | O | 637.43 | +3W |
| GC/ | Gold Continuous | 1810.10 | Positive | Buy | O | 1822.61 | +2W |
| HG/ | Copper Continuous | 4.38 | Positive | Buy | X | 3.95 | +3W |
| ZG/ | Corn (Electronic Day Session) Continuous | 550.50 | Negative | Buy | O | 548.30 | -11W |
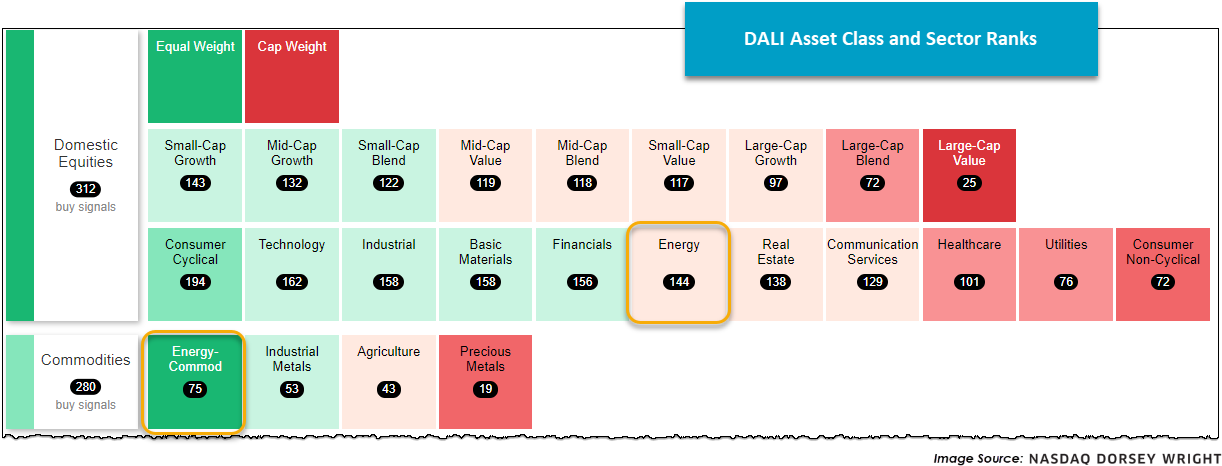
As we discussed in a DALI update last month and briefly in our Were You Aware from Monday, energy-related equities are weakening, recently falling from second to sixth in our DALI sector rankings. However, several of the underlying energy commodities tell a different story, as highlighted in the charts below.
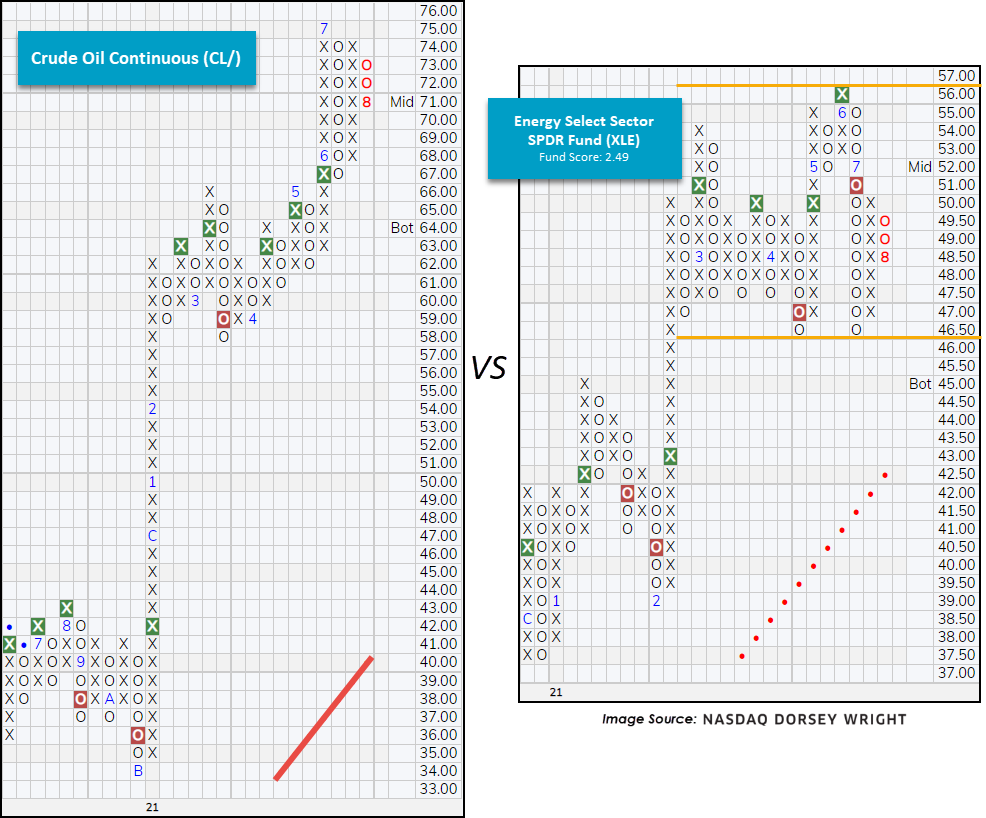

To begin, notice that the front month crude contract (CL/) remains in a discernable uptrend on three consecutive buy signals while the Energy Select Sector SPDR Fund (XLE) is in a consolidated posture and recently posted a lower top at $50. Similarly, we see the natural gas front month contract (NG/) trading on four consecutive buy signals, recently reversing back up into Xs yesterday, while the First Trust Natural Gas ETF (FCG) reversed down into Os and trades on consecutive sell signals.
To reconcile these charts, keep in mind that front month commodity contracts will (typically) be more sensitive to the current supply and demand story than equities. For example, OPEC’s latest decision to increase production affected the front month crude contract more dramatically than the equity-related holdings of XLE because equities are generally more forward looking. For natural gas, given the unusually hot summer temperatures experienced across the country, current demand levels are elevated, driving up the price of natural gas futures (among other variables). Although this certainly does not tell the full story, it can help us make sense of the disconnect between energy equities and commodities.