Most Requested Symbols

While July was a generally positive month for US equities, small-cap names have continued to see a period of consolidation. However, some areas within the small-cap growth camp have shown more recent improvement.
The average distribution reading is 25.06% overbought.
Today's featured stock is Facebook Inc. (FB).
AME, AMN, BIG, CR, DDS, DECK, DOCU, FCX, HON, LYB, ON, RL, SQ, THC, URI & YETI
Call: Iron Mountain Inc (IRM); Put: Bed Bath & Beyond (BBBY), Covered Write Nucor Corporation (NUE).
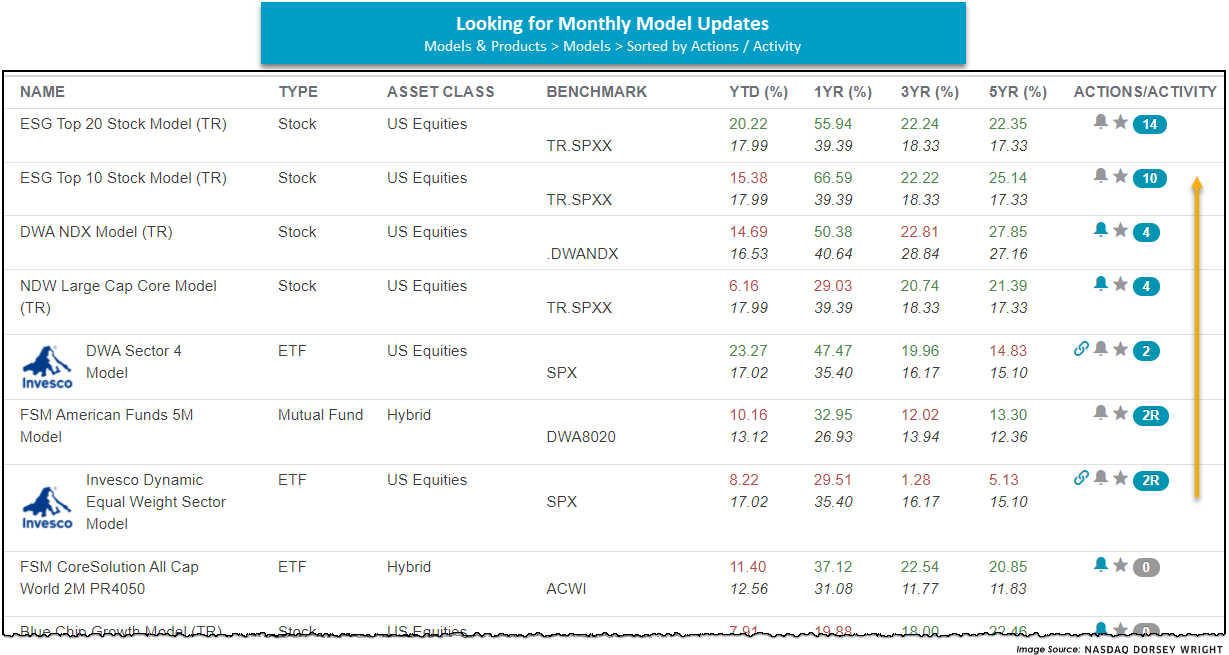
Following Friday’s (7/30) action, our monthly models (Models & Products > Models) underwent evaluation for the seventh time this year. Keep in mind that a “monthly evaluation frequency” does not mean a strategy will make a trade each month, but simply informs us that it could given it is up for review. In fact, more often than not, strategies will not make trades every evaluation period. Nonetheless, to assess the latest changes we filtered our models page (partially depicted below) for strategies that use a monthly update frequency by their respective activity. As a result, we saw our ESG stock models (Top 20 and Top 10) make the most trades at seven and five.
A few notable themes following the latest update include a sector tilt back towards financials and away from energy; we saw several models make this trade. For our latest feature on the energy sector, click here. Also, note that many of our strategies kept overweights in sectors like consumer discretionary, industrials, and technology. On the size and style front, the preference for growth over value prevailed along with sustained favoritism for domestic over international markets.
Although it is unlikely, and perhaps unjustified, for one to implement each of these models in a single portfolio, they can still serve as useful proxies for market sentiment and offer guidance on trends. Additionally, you can consider using the models as “idea generators” for sector ETFs, ESG plays, or even broader market positions. To receive email alerts on model trades, make sure the bell icon is blue. To simply group your favorite models, click the star icon to turn it blue.
Note that we will dive deeper into the FSM (Fund Score Method) model changes later this week in our Fund Score Overviews, following their evaluation tomorrow (8/3) night.

While July was a generally positive month for US equities, small-cap names have continued to see a period of consolidation that began in March of this year. Small-cap stocks were among the strongest areas of the US equity market as we began the year. The iShares Russell 2000 ETF gave four consecutive buy signals from October of last year through January, before reaching a new all-time high at $230 in February. The fund has since been stuck in a trading range between that February high and the $210 level it pulled back to in March, seeing multiple column reversals but moving largely sideways over the past five months. The broad small-cap fund most recently moved lower in July to give a sell signal at $210, its first such signal since September of last year but is now within one box of a reversal back up into a column of X's intraday Monday, which would come with movement to $225. IWM has held onto a suitable fund score of 3.82, which bests the average US fund of 3.66. The fund now sits in a relatively normalized trading territory at just -17% oversold through Friday's trading.

As we touched on last Friday, the next few months of the year have historically produced more muted returns for the core US equity benchmark, the S&P 500 Index. Last year, this worked out favorably for small-cap equities, as they began to outperform their large-cap counterparts heading into the end of the year. While the current market environment has indicated near-term strength lies with the broader large-cap space, the longer-term view of strength that can be seen through the DALI domestic equity size and style breakdown continues to have small-cap growth sit at the top of the nine style box rankings, a position it has maintained since January of this year. The small-cap growth group on the Asset Class Group Scores (ACGS) page has shown a retraction from score highs earlier this year but does maintain a favorable group score of 3.96 through trading Friday.
One of the strongest scoring funds within the small-cap growth group is the First Trust Small Cap Growth AlphaDEX Fund FYC. This fund also sits in a trading range at current levels of $72, but returned to a buy signal in June and reversed back up into a column of X's in July. The fund boasts a strong recent score posting of 4.51, besting the average small-cap growth fund (3.96) as well as the average US fund (3.66). The past few months of consolidation have left the fund at the middle of its ten-week trailing trading band, with initial support offered at $67 and further support seen at $66 and $65, the March low. Overhead resistance can be found initially at $74, seen in June and March, with the all-time high positioned at $77.

Technology is the most overweight sector within FYC at roughly 19% of the fund. The technology sector has also seen significant relative strength improvement over the past few months to currently sit in the second-ranked position in the DALI domestic equity sector rankings. One of the technology names within FYC that caught our eye is Synaptics Inc. SYNA, which pushed higher Monday to break a double top at $154. This 5 for 5’er has maintained a positive trend since December and ranks 7th out of 44 names in the computers sector RS matrix. The stock has also been on an RS buy signal against the market since December 2019. The overall technical picture for SYNA is positive and continues to improve. Initial support can be found at $142 from July, while overhead resistance may be seen initially at the all-time high of $160.

Average Level
25.06
| AGG | iShares US Core Bond ETF |
| USO | United States Oil Fund |
| DIA | SPDR Dow Jones Industrial Average ETF |
| DVY | iShares Dow Jones Select Dividend Index ETF |
| DX/Y | NYCE U.S.Dollar Index Spot |
| EFA | iShares MSCI EAFE ETF |
| FXE | Invesco CurrencyShares Euro Trust |
| GLD | SPDR Gold Trust |
| GSG | iShares S&P GSCI Commodity-Indexed Trust |
| HYG | iShares iBoxx $ High Yield Corporate Bond ETF |
| ICF | iShares Cohen & Steers Realty ETF |
| IEF | iShares Barclays 7-10 Yr. Tres. Bond ETF |
| LQD | iShares iBoxx $ Investment Grade Corp. Bond ETF |
| IJH | iShares S&P 400 MidCap Index Fund |
| ONEQ | Fidelity Nasdaq Composite Index Track |
| QQQ | Invesco QQQ Trust |
| RSP | Invesco S&P 500 Equal Weight ETF |
| IWM | iShares Russell 2000 Index ETF |
| SHY | iShares Barclays 1-3 Year Tres. Bond ETF |
| IJR | iShares S&P 600 SmallCap Index Fund |
| SPY | SPDR S&P 500 Index ETF Trust |
| TLT | iShares Barclays 20+ Year Treasury Bond ETF |
| GCC | WisdomTree Continuous Commodity Index Fund |
| VOOG | Vanguard S&P 500 Growth ETF |
| VOOV | Vanguard S&P 500 Value ETF |
| EEM | iShares MSCI Emerging Markets ETF |
| XLG | Invesco S&P 500 Top 50 ETF |

| Symbol | Company | Sector | Current Price | Action Price | Target | Stop | Notes |
|---|---|---|---|---|---|---|---|
| GFL | GFL Environmental Inc | Waste Management | $34.87 | low to upper 30s | 38 | 26 | 5 for 5'er, 5 consec buy signals, pullback from ATH |
| AKR | Acadia Realty Trust | Real Estate | $21.40 | 20 - 22 | 28 | 18 | 4 for 5'er, #6 of 154 in REAL sector matrix, one box from RS buy signal, 2.7% yield |
| STOR | Store Capital Corp. | Real Estate | $36.19 | mid-to-upper 30s | 47.50 | 30 | 5 for 5'er, multiple buy signals, one box from 52-week high, 4.1% yield, R-R>2.0 Earn. 8/5 |
| RVNC | Revance Therapeutics, Inc | Biomedics/Genetics | $29.08 | hi 20s - low 30s | 40 | 26 | 5 for 5'er, top 25% of BIOM sector matrix, quad top breakout, positive trend change, pos monthly mom flip Earnings 8/4 |
| NDLS | Noodles & Company | Restaurants | $11.94 | 11.50 - 13.50 | 20 | 10 | 5 for 5'er, #1 of 28 in REST sector matrix, triple top, pullback to mid of trading band, R-R>2.5 Earnings 8/3 |
| SEM | Select Medical Holdings Corporation | Healthcare | $39.45 | hi 30s - low 40s | 58 | 35 | 5 for 5'er, #8 of 116 names in favored HEAL sector matrix, multiple buy signals, good R-R, Earn. 8/5 |
| UE | Urban Edge Properties | Real Estate | $19.00 | 18 - 19.50 | 29.50 | 16 | 5 for 5'er, top 10% of REAL sector matrix, pullback from 52-week high, 3.1% yield, R-R>3.0 Earn. 8/4 |
| JBL | Jabil Circuit, Inc. | Electronics | $59.54 | low to high 50s | 73 | $47 | 4 for 5'er, multi-year highs, consecutive buy signals, top 10% of DWAELEC Earnings 9/22 |
| OXY | Occidental Petroleum Corporation | Oil | $26.10 | upper 20s - lower 30s | 33.50 | 22 | 3 for 5'er, top half of favored OIL sector matrix, bullish triangle, pullback from 52-week high, Earn 8/3 |
| TW | Tradeweb Markets, Inc. Class A | Business Products | $86.73 | 80s | 100 | 71 | 4 for 5'er, top 20% of BUSI sector matrix, triple top, pullback from ATH |
| UNH | UnitedHealth Group Incorporated | Healthcare | $412.22 | 390-420 | 496 | 340 | 4 for 5'er, top half of favored DWAHEAL matrix, consec buy signals, pullback from ATH, pos weekly mom flip, 1.38% yield |
| MS | Morgan Stanley | Wall Street | $95.98 | 90s | 109 | 83 | 5 for 5'er, top 10% of WALL sector matrix, spread triple top, LT pos mkt RS, 3.1% yield |
| ENTG | Entegris Inc. | Semiconductors | $120.64 | 110s to high 120s | 170 | 95 | 5 for 5'er, pullback from ATH, long-term market RS buy signal, top 25% of DWASEMI |
| GGG | Graco Inc | Machinery and Tools | $78.08 | mid 70s to low 80s | 108 | 64 | 4 for 5'er, consec buy signals, pullback from ATH, 1 box from bullish triangle, pos weekly momentum, long-term market & peer RS buy signals |
| DHI | D.R. Horton, Inc. | Building | $95.43 | 90s | 109 | 79 | 4 for 5'er, top 25% of BUIL sector matrix, LT pos mkt RS, spread quad top breakout, pos. trend change |
| AA | Alcoa Inc. | Metals Non Ferrous | $40.15 | mid to upper 30s to mid 40s | 56 | 30 | 4 for 5'er, bearish signal reversal pattern, pullback from multi-year highs, pos weekly mom flip, long-term market RS buy signal |
| VEEV | Veeva Systems Inc. | Software | $332.71 | 302s - 330s | 416 | 276 | 4 for 5'er, top 25% of SOFT sector matrix, LT pos mkt RS, multiple buy signals, Earn. 8/25 |
| ODFL | Old Dominion Freight Line, Inc. | Transports/Non Air | $269.15 | 250s to 280s | 324 | 216 | 5 for 5'er, pullback from ATH, 5 consec buy signals, LT market RS, pos weekly momentum, top 1/3 DWATRANS |
| ARCH | Arch Resources Inc | Oil | $65.72 | mid-to-upper 60s | 85 | 56 | 5 for 5'er, top 10% of oil sector matrix, bullish catapult, pullback from 52-wk high, R-R~2.0 |
| FB | Facebook Inc. | Internet | $356.30 | 340s - 360s | 460 | 304 | 4 for 5'er, top third of INET sector matrix, triple top breakout, pullback from ATH, R-R>2.0 |
| Symbol | Company | Sector | Current Price | Action Price | Target | Stop | Notes |
|---|---|---|---|---|---|---|---|
| OPEN | Opendoor Technologies Inc. | Wall Street | $14.82 | low to mid 10s | 2 | 19.50 | 0 for 5'er, 4 consecutive sell signals, negative trend, bottom of DWAWALL matrix, negative monthly momentum, Earn. 8/11 |
| RAMP | Liveramp Holdings Inc. | Business Products | $40.01 | high 40s to high 30s | 36 | 51 | 0 for 5'er, 10 consec sell signals, 52 week lows, negative monthly mom flip, negative trend |
| Comment | |||||||
|---|---|---|---|---|---|---|---|
|
|
|||||||
FB Facebook Inc. R ($351.55) - Internet - FB is a 4 for 5'er that ranks in the top third of the internet sector matrix and has been on a market RS buy signal since 2012. In trading late last month, the stock broke a triple top at $360, completing a shakeout pattern, and continued to higher to reach an all-time high of $376, before pulling back to the low $350s. Long exposure may be added in the $340s - $360s and we will set our initial stop at $304, the potential trend line violation on FB's default chart. We will use the bullish price objective, $460, as our target price, giving us a reward-to-risk ratio north of 2.0
| 21 | |||||||||||||||||||||||||||||||||||||||||||||||||||||
| 376.00 | X | 376.00 | |||||||||||||||||||||||||||||||||||||||||||||||||||
| 372.00 | X | O | 372.00 | ||||||||||||||||||||||||||||||||||||||||||||||||||
| 368.00 | X | O | 368.00 | ||||||||||||||||||||||||||||||||||||||||||||||||||
| 364.00 | X | O | 364.00 | ||||||||||||||||||||||||||||||||||||||||||||||||||
| 360.00 | X | O | 360.00 | ||||||||||||||||||||||||||||||||||||||||||||||||||
| 356.00 | X | X | X | O | 356.00 | ||||||||||||||||||||||||||||||||||||||||||||||||
| 352.00 | X | O | X | O | X | 8 | 352.00 | ||||||||||||||||||||||||||||||||||||||||||||||
| 348.00 | X | O | X | O | X | 348.00 | |||||||||||||||||||||||||||||||||||||||||||||||
| 344.00 | X | 7 | O | X | 344.00 | ||||||||||||||||||||||||||||||||||||||||||||||||
| 340.00 | X | O | X | Mid | 340.00 | ||||||||||||||||||||||||||||||||||||||||||||||||
| 336.00 | 6 | O | 336.00 | ||||||||||||||||||||||||||||||||||||||||||||||||||
| 332.00 | X | 332.00 | |||||||||||||||||||||||||||||||||||||||||||||||||||
| 328.00 | X | X | 328.00 | ||||||||||||||||||||||||||||||||||||||||||||||||||
| 324.00 | X | O | X | 324.00 | |||||||||||||||||||||||||||||||||||||||||||||||||
| 320.00 | X | O | X | 320.00 | |||||||||||||||||||||||||||||||||||||||||||||||||
| 316.00 | X | 5 | X | X | 316.00 | ||||||||||||||||||||||||||||||||||||||||||||||||
| 312.00 | X | X | O | X | O | X | 312.00 | ||||||||||||||||||||||||||||||||||||||||||||||
| 308.00 | X | O | X | O | X | O | X | • | 308.00 | ||||||||||||||||||||||||||||||||||||||||||||
| 304.00 | X | X | O | X | O | X | O | • | 304.00 | ||||||||||||||||||||||||||||||||||||||||||||
| 300.00 | X | O | 4 | O | O | • | 300.00 | ||||||||||||||||||||||||||||||||||||||||||||||
| 296.00 | X | O | X | X | X | • | Bot | 296.00 | |||||||||||||||||||||||||||||||||||||||||||||
| 292.00 | X | O | X | O | X | O | X | • | 292.00 | ||||||||||||||||||||||||||||||||||||||||||||
| 288.00 | X | 9 | X | O | X | X | O | X | • | 288.00 | |||||||||||||||||||||||||||||||||||||||||||
| 284.00 | X | O | X | X | O | C | O | X | X | O | X | • | 284.00 | ||||||||||||||||||||||||||||||||||||||||
| 280.00 | X | O | X | X | O | X | X | O | X | O | X | X | X | O | X | O | • | 280.00 | |||||||||||||||||||||||||||||||||||
| 276.00 | X | X | O | X | X | O | X | O | X | O | X | O | X | O | X | O | X | O | X | O | X | X | • | 276.00 | |||||||||||||||||||||||||||||
| 272.00 | X | O | X | O | X | O | X | O | X | O | X | O | B | O | X | O | X | O | X | O | X | O | X | O | X | • | 272.00 | ||||||||||||||||||||||||||
| 268.00 | X | O | X | O | X | O | A | X | O | X | O | O | X | O | X | O | O | 1 | X | O | 2 | O | 3 | • | 268.00 | ||||||||||||||||||||||||||||
| 264.00 | X | O | X | O | O | X | O | X | O | X | O | X | O | O | X | O | X | O | X | • | 264.00 | ||||||||||||||||||||||||||||||||
| 260.00 | X | O | X | O | X | O | X | O | O | O | X | O | X | O | X | • | 260.00 | ||||||||||||||||||||||||||||||||||||
| 256.00 | 8 | O | O | X | O | O | X | O | • | O | • | 256.00 | |||||||||||||||||||||||||||||||||||||||||
| 252.00 | X | O | X | O | X | • | • | 252.00 | |||||||||||||||||||||||||||||||||||||||||||||
| 248.00 | X | X | O | O | • | 248.00 | |||||||||||||||||||||||||||||||||||||||||||||||
| 244.00 | X | X | O | X | • | • | 244.00 | ||||||||||||||||||||||||||||||||||||||||||||||
| 240.00 | X | X | X | O | X | O | X | • | 240.00 | ||||||||||||||||||||||||||||||||||||||||||||
| 236.00 | X | O | 6 | O | X | O | X | O | X | • | 236.00 | ||||||||||||||||||||||||||||||||||||||||||
| 232.00 | X | O | X | O | X | O | X | O | X | • | 232.00 | ||||||||||||||||||||||||||||||||||||||||||
| 228.00 | X | O | X | O | X | O | 7 | O | • | 228.00 | |||||||||||||||||||||||||||||||||||||||||||
| 224.00 | X | O | O | O | X | • | 224.00 | ||||||||||||||||||||||||||||||||||||||||||||||
| 220.00 | X | O | X | • | 220.00 | ||||||||||||||||||||||||||||||||||||||||||||||||
| 216.00 | X | O | X | • | 216.00 | ||||||||||||||||||||||||||||||||||||||||||||||||
| 212.00 | 5 | O | X | • | 212.00 | ||||||||||||||||||||||||||||||||||||||||||||||||
| 208.00 | X | O | • | 208.00 | |||||||||||||||||||||||||||||||||||||||||||||||||
| 204.00 | X | • | 204.00 | ||||||||||||||||||||||||||||||||||||||||||||||||||
| 200.00 | X | • | 200.00 | ||||||||||||||||||||||||||||||||||||||||||||||||||
| 198.00 | X | • | 198.00 | ||||||||||||||||||||||||||||||||||||||||||||||||||
| 196.00 | X | • | 196.00 | ||||||||||||||||||||||||||||||||||||||||||||||||||
| 194.00 | X | • | 194.00 | ||||||||||||||||||||||||||||||||||||||||||||||||||
| 192.00 | X | X | • | 192.00 | |||||||||||||||||||||||||||||||||||||||||||||||||
| 190.00 | X | O | X | • | 190.00 | ||||||||||||||||||||||||||||||||||||||||||||||||
| 188.00 | X | O | X | • | 188.00 | ||||||||||||||||||||||||||||||||||||||||||||||||
| 186.00 | X | O | X | • | 186.00 | ||||||||||||||||||||||||||||||||||||||||||||||||
| 184.00 | X | O | • | 184.00 | |||||||||||||||||||||||||||||||||||||||||||||||||
| 182.00 | X | • | 182.00 | ||||||||||||||||||||||||||||||||||||||||||||||||||
| 180.00 | X | • | 180.00 | ||||||||||||||||||||||||||||||||||||||||||||||||||
| 178.00 | O | X | • | 178.00 | |||||||||||||||||||||||||||||||||||||||||||||||||
| 176.00 | O | X | • | 176.00 | |||||||||||||||||||||||||||||||||||||||||||||||||
| 174.00 | O | X | • | 174.00 | |||||||||||||||||||||||||||||||||||||||||||||||||
| 172.00 | O | X | • | 172.00 | |||||||||||||||||||||||||||||||||||||||||||||||||
| 170.00 | O | • | 170.00 | ||||||||||||||||||||||||||||||||||||||||||||||||||
| 21 |
| AME Ametek Inc ($138.44) - Electronics - AME broke a triple top for a fourth consecutive buy signal and a new high on the chart. AME is 4 for 5'er that ranks in the top third of the Electronics sector matrix. Okay to consider here on the breakout or on a pullback to $134 on the chart. Initial support lies in the $130 to $132 range, while long-term support lies at $108. |
| AMN AMN Healthcare Services, Inc. ($101.17) - Healthcare - AMN broke a double top at $102 for a second consecutive buy signal and a new chart high. The stock is a 3 for 5'er that ranks in the top quintile of the Healthcare sector matrix. Okay to consider here on the breakout or on a pullback to $98 on the chart Initial support lies at $97, while additional support lies at $93. |
| BIG Big Lots, Inc. ($56.16) - Retailing - BIG is an unacceptable 0 for 5’er within the unfavored retailing sector that ranks 87th out of 97 names in the sector stock matrix. Today, BIG broke a spread triple bottom at $56, marking the stock’s third consecutive sell signal. From here, the next level of support sits at $52. Avoid as the weight of the evidence is negative. |
| CR Crane Co. ($96.88) - Machinery and Tools - CR broke a spread triple top at $98, for a second consecutive buy signal, before rallying up to match the May chart high of $99. CR is a 3 for 5'er that ranks in the top half of the Machinery and Tools sector matrix. Okay to consider here on the breakout, or on a pullback to $96 on the chart. Initial support lies at $94, while additional support can be found in the $85 to $86 range. |
| DDS Dillard's, Inc. ($182.06) - Retailing - DDS is a perfect 5 for 5’er that ranks #1 in the retailing sector stock matrix. Today, DDS broke a spread triple top at $192 where the stock is now testing its all-time high originally hit in June. From here, support sits at $176. Okay to buy or hold here as the weight of the evidence is positive. |
| DECK Deckers Outdoor Corporation ($424.02) - Textiles/Apparel - DECK is a strong 5 for 5’er within the textiles/apparel sector that broke a double top at $416 before moving higher to $424, marking a new all-time high as well as the third consecutive buy signal. From here, support sits at $392. |
| DOCU DocuSign, Inc. ($294.94) - Software - DOCU reversed down to break a double bottom at $292 and initiate a shakeout pattern. DOCU is a 5 for 5'er that ranks in the top quintile of the Software sector matrix. Okay to consider on a reversal back into X's at $304, and the shakeout would be complete with the triple top break at $312. Initial supportlies at $272, while additional can be found at $248. |
| FCX Freeport-McMoRan Inc. ($36.62) - Metals Non Ferrous - FCX returned to a buy signal Monday after giving three consecutive sell signals since May. Monday's move adds to a positive overall picture for FCX as the stock is a 4 for 5 trading in a positive overall trend. From here, FCX faces overhead resistance at $44, a level it failed to breach three times in May and June. Support now sits at $32. |
| HON Honeywell International, Inc. ($232.42) - Aerospace Airline - HON broke a triple top at $236 to complete a shakeout pattern and reach a new high. HON is a 4 for 5'er that ranks in the top half of the Aerospace Airline sector matrix. Okay to consider here on the breakout, or on a pullback to $224 on the chart. Initial support lies at $212, while additional can be found at $196. |
| LYB LyondellBasell Industries NV ($98.90) - Chemicals - LYB returned to a buy signal Monday with a double top at $102. Despite Monday's move, the overall picture for LYB remains negative as it is a 0 for 5'er that ranks in the bottom half of the chemicals sector matrix. From here, the stock faces overhead resistance at $104, while support sits at $92. LYB carries a 4.5% yield. |
| ON On Semiconductor Corp. ($43.64) - Semiconductors - ON shares moved higher Monday after their earnings release to break a double top at $40 before reaching a new all-time high at $45 intraday. This 4 for 5'er moved to a positive trend last June and ranks in the top half of the semiconductors sector RS matrix. The technical picture is positive, however, ON is now in overbought territory so those looking to add exposure may be best served to wait for a pullback or normalization in the trading band. Initial support is offered at $35. |
| RL Ralph Lauren ($118.24) - Textiles/Apparel - RL completed a bearish signal reversal today, moving the chart to a buy signal for the first time since May. Although today’s breakout is a positive, RL remains a weak 0 for 5’er. Avoid. |
| SQ Square Inc ($272.38) - Software - Shares of SQ moved higher Monday to break a double top at $264 before rising over 10% intraday to match its all-time high at $280. This 3 for 5'er moved to a positive trend in April of last year and gave an RS buy signal against the market in May of this year. The weight of the technical evidence is positive. Initial support may be found at $248. |
| THC Tenet Healthcare Corporation ($71.37) - Healthcare - THC shares moved higher today to break a triple top at $74 to mark its second consecutive buy signal. This 5 for 5'er has been in a positive trend and on an RS buy signal since July of 2020. THC is actionable at current levels with a weekly overbought/oversold reading of 30%. From here, support is offered at $70. |
| URI United Rentals, Inc. ($326.27) - Machinery and Tools - Shares of URI pushed higher on Monday to break a double top at $336, resulting in a second consecutive buy signal. The 5 for 5'er remains in the top quartile of the machinery and tools stock sector matrix and well-above its positive trend line. Those considering new long exposure may need further bullish confirmation with a move past resistance at $340, which would put the stock nearly out of its rangebound state. Initial support is now offered at around $312. |
| YETI YETI Holdings, Inc. ($97.39) - Leisure - YETI broke a double top at $99 with today’s action, marking a new all-time high on the chart. YETI is a perfect 5 for 5’er that ranks #1 in the leisure sector stock matrix. Monthly momentum just flipped positive for YETI, which trades on consecutive buy signals. Demand is in control. From here, support sits at $95. |

| Name | Option Symbol | Action | Stop Loss |
|---|---|---|---|
| Iron Mountain Inc. - $43.76 | O: 22A42.50D21 | Buy the January 42.50 calls at 3.50 | 41.00 |
| Name | Option | Action |
|---|---|---|
| Amphenol Corporation ( APH) | Oct. 67.50 Calls | Raise the option stop loss to 4.00 (CP: 6.00) |
| Name | Option Symbol | Action | Stop Loss |
|---|---|---|---|
| Bed Bath & Beyond Inc. - $28.33 | O: 21W29.00D19 | Buy the November 29.00 puts at 4.85 | 32.00 |
| Name | Option | Action |
|---|---|---|
| Activision Blizzard, Inc. (ATVI) | Nov. 95.00 Puts | Raise the option stop loss to 11.85 (CP: 13.85) |
| Fastly, Inc. Class A (FSLY) | Dec. 55.00 Puts | Raise the option stop loss to 9.95 (CP: 11.95) |
| Name | Option Sym. | Call to Sell | Call Price | Investment for 500 Shares | Annual Called Rtn. | Annual Static Rtn. | Downside Protection |
|---|---|---|---|---|---|---|---|
| Nucor Corporation $104.02 | O: 21J105.00D15 | Oct. 105.00 | 5.30 | $48,926.90 | 30.88% | 21.30% | 4.14% |
| Name | Action |
|---|---|
| Cleveland-Cliffs Inc. (CLF) - 25.00 | Sell the October 22.00 Calls. |
| Antero Resources Corp (AR) - 13.60 | Sell the November 15.00 Calls. |
| United States Steel Corporation (X) - 26.48 | Sell the October 25.00 Calls. |
| CommScope Holding Company, Inc. (COMM) - 21.16 | Sell the November 21.00 Calls. |
| Cloudflare Inc Class A (NET) - 118.63 | Sell the November 115.00 Calls. |
| Mosaic Company (MOS) - 31.23 | Sell the December 32.00 Calls. |
| Dick's Sporting Goods, Inc. (DKS) - 104.14 | Sell the December 110.00 Calls. |
| Halliburton Company (HAL) - 20.68 | Sell the October 21.00 Calls. |
| The Trade Desk Inc (TTD) - 81.91 | Sell the November 90.00 Calls. |
| Green Plains Inc. (GPRE) - 35.36 | Sell the December 36.00 Calls. |
| Alcoa Inc. (AA) - 40.15 | Sell the November 42.00 Calls. |
| Name | Covered Write |
|---|---|
| NVIDIA Corporation ( NVDA - 194.99 ) | November 195.00 covered write. |
| Applied Materials, Inc. ( AMAT - 139.93 ) | October 140.00 covered write. |
Daily Equity & Market Analysis
LISTEN TO PODCAST
Apr 02, 2026
Loading, Please Wait...
