
Although the recent weakness in energy is undoubtedly negative for the sector, there are some individual energy names that are continuing to hold up on a technical basis. That said, today we present a “buy, hold, and sell” analysis of the broader energy sector.
From a technical standpoint, the energy sector had been a relative leader since mid-January when it moved up into the top half of the DALI US sector rankings and since June, the sector maintained a solid ranking of 3 or higher. However, with this past week’s worth of market action, the energy sector fell drastically from #2 to #6 overnight, giving up its position of longer-term leadership. Additionally, the energy sector has lost a total of 31 tally signals in DALI since the start of the third quarter, the most of any other sector, and, using the SPDR sector fund lineup as proxies, energy has underperformed all other broad sectors over that same period with a loss of -9.60% (through 7/22). Surprisingly, the energy sector remains the year-to-date leader in terms of performance with a gain of 28.50%, followed by the real estate sector, up 25.44%. Although this recent weakness is undoubtedly negative for the sector, there are some individual energy names that are continuing to hold up on a technical basis, while some have broken down. That said, today we present a buy, hold, and sell analysis of the broader energy sector.

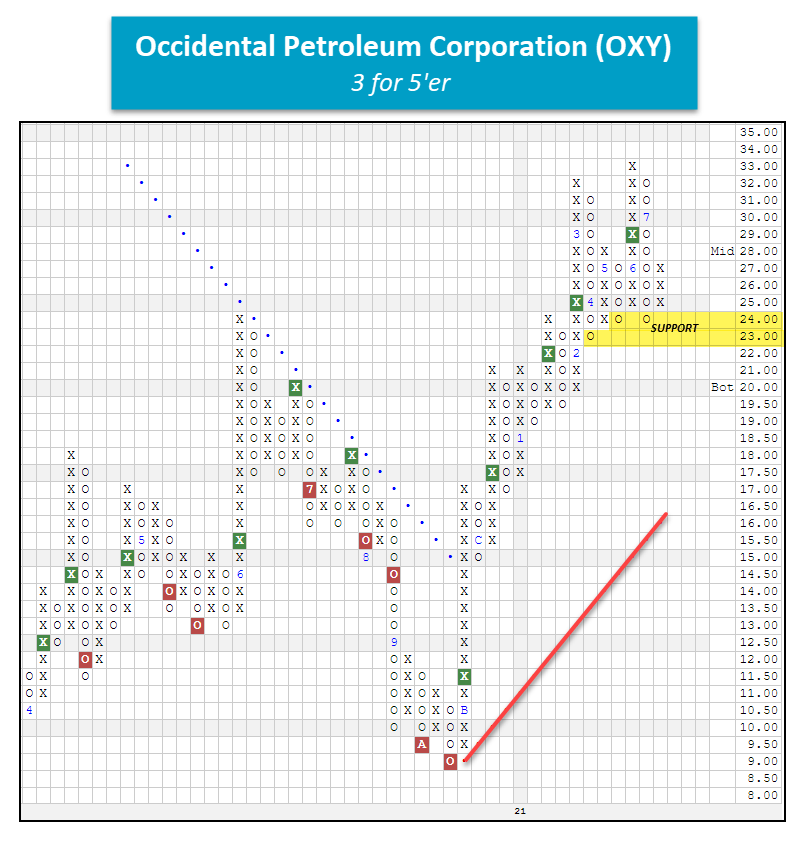
Buy - Occidental Petroleum Corporation OXY
OXY is a solid 3 for 5’er that currently sits in the top half of the oil sector stock matrix. The stock has been trading above its bullish support line since November 2020 and maintains a market RS buy signal, confirming its superior long-term strength versus the broader market. OXY has given five consecutive buy signals since November, telling us that demand remains firmly in control here. In June, OXY reached a new multi-year high with a move to $33 before pulling back to support at $24 in July along with the broader energy sector. With recent market action, however, the chart of OXY has reversed back up into X's to $27. From here, a move to $34 would mark the sixth consecutive buy signal and a new multi-year high. With an OBOS% reading of -23% oversold, new positions are welcome at current levels as demand is in control. Note that OXY expects to release earnings on August 3. Initial support is offered here at $24 with further support at $23. Note the long-term trend line lies at $16.
Additional "Buy" Energy Stocks
- Hal - HAL - 4 for 5'er
- ONEOK, Inc. - OKE - 3 for 5'er
- Devon Energy Corporation - DVN - 5 for 5'er
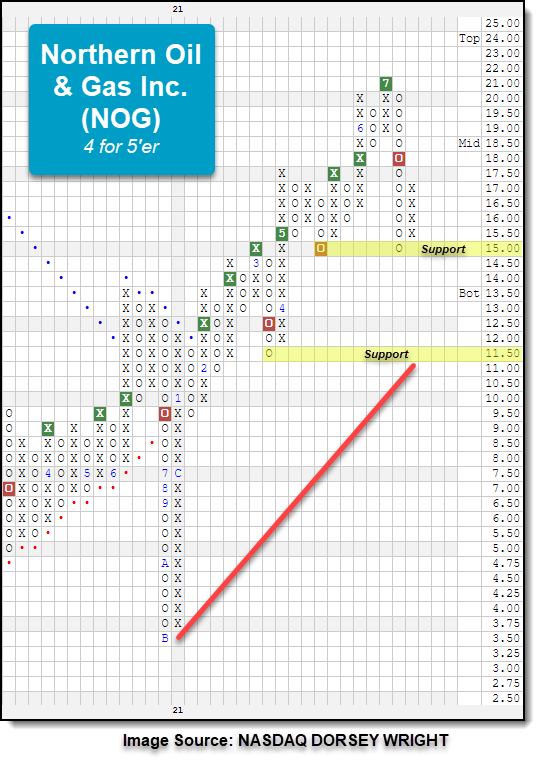
Hold – Northern Gas & Oil Inc. NOG
Prior to July 16, NOG had been a 5 for 5’er but fell to a 4 for 5’er following a reversal into a column of O’s on its market RS with the conclusion of trading last week. NOG still maintains an RS buy signal, exhibiting long-term strength, versus the market and its peer group. Additionally, the stock maintains near-term positive RS versus its peer group and ranks in the top quintile of the Oil sector matrix. On the chart below, NOG broke a double bottom at $18 on July 14 to complete a bearish signal reversal pattern. Following action on Monday, NOG fell to $15, matching the May low on the chart. NOG, fortunately, held this support level and reversed back into a column of X’s at $17 following action on Wednesday. While the stock is currently on a sell signal, the fact that it is still a 4 for 5’er and it held support at $15 leads us to believe that holding the position is still viable. If the chart were to reverse back down into O’s and fall to $14.50 it would be a potential spread triple bottom break, which would change our tune in terms of considering the stock a hold. On the flip side of the coin, if NOG rallies to return to a buy signal with a potential double top at $22 it would confirm follow-through and that near-term demand is back in play. Note resistance currently lies at $21, the July 2021 chart high, and at $24, the December 2020 high mark on the chart.
Additional "Hold" Energy Stocks
- Exxon Mobil Corporation - XOM - 3 for 5'er
- Chevron Corporation - CVX - 2 for 5'er
- Apache Corporation - APA - 2 for 5'er
Sell – Phillips 66 PSX
While we did witness some energy stocks better their June rallies earlier this month, PSX was not among those. Since hitting its near-term peak at $94 in June, we have seen a series of lower tops and bottoms. With the recent double bottom break at $79 on July 14, PSX completed a bearish catapult pattern and violated the bullish support line. The chart fell down to $70 with Tuesday’s action, and the rebounded the following day as it reversed back into X’s at $74. From a technical attribute perspective, PSX had been a 3 for 5’er as recently as April. Around that time though, PSX reversed down into a column of O’s on its market RS chart, indicating near-term underperformance by the stock relative to the market and causing PSX to fall to a 2 for 5’er. As noted above, PSX violated the bullish support line last week, and with action this week has given a peer RS sell signal. Both of these negative moves caused PSX to lose the remaining two attributes and fall to a 0 for 5’er. Some may hold the position as a yield play – its current yield of 4.88% - but with the trend reversal, we are seeing lower prices, and we must assess whether the yield received from the stock is greater than the deterioration in price. Bearing all this in mind, we would look to step away from PSX at this time as the weight of the evidence is negative.

Additional "Sell" Energy Stocks
- Cabot Oil & Gas Corporation – COG – 0 for 5’er
- Valero Energy Corp - VLO – 0 for 5’er
- NOV Inc. – NOV – 0 for 5’er
