
The US Equity Core Percentile Rank, known also as the DWA S&P 500 Assets Percentile Rank, sits at 98.59% Currently, each of the S&P 500-related major market ETFs covered in this report are trading at all-time highs, maintain Point & Figure buy signals on their default charts, and are trading in overall positive trends with fund scores well above the acceptable 3.0 threshold.
Portfolio View - Major Market ETFs
| Symbol | Name | Price | Yield | PnF Trend | RS Signal | RS Col. | Fund Score | 200 Day MA | Weekly Mom |
|---|---|---|---|---|---|---|---|---|---|
| DIA | SPDR Dow Jones Industrial Average ETF Trust | 351.09 | 1.59 | Positive | O | 3.11 | 321.41 | +3W | |
| EEM | iShares MSCI Emerging Markets ETF | 52.19 | 1.48 | Positive | Sell | O | 1.79 | 52.81 | -5W |
| EFA | iShares MSCI EAFE ETF | 80.46 | 2.26 | Positive | Sell | O | 3.02 | 75.40 | +1W |
| FM | iShares MSCI Frontier and Select EM ETF | 33.14 | 2.08 | Positive | Sell | O | 3.65 | 30.01 | -5W |
| IJH | iShares S&P MidCap 400 Index Fund | 270.25 | 1.07 | Positive | Buy | O | 3.60 | 248.51 | -17W |
| IJR | iShares S&P SmallCap 600 Index Fund | 110.57 | 0.96 | Positive | Buy | X | 3.11 | 101.84 | -21W |
| QQQ | Invesco QQQ Trust | 366.81 | 0.48 | Positive | Buy | X | 4.74 | 323.38 | -1W |
| RSP | Invesco S&P 500 Equal Weight ETF | 153.73 | 1.31 | Positive | Buy | X | 5.35 | 137.35 | -13W |
| SPY | SPDR S&P 500 ETF Trust | 441.15 | 1.27 | Positive | O | 3.44 | 393.83 | -1W | |
| XLG | Invesco S&P 500 Top 50 ETF | 336.84 | 1.07 | Positive | O | 3.53 | 298.45 | -1W |
Additional Comments:
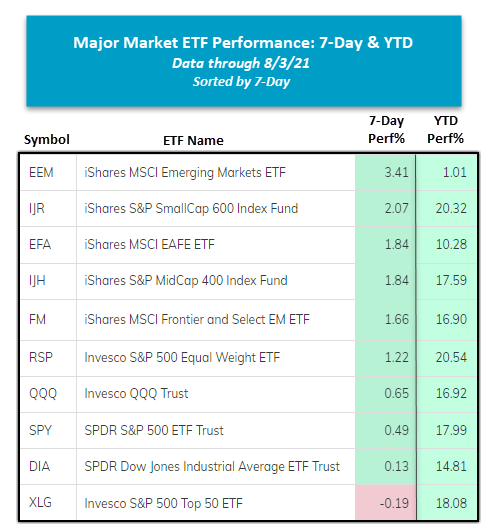
Overall, it was a bullish week of trading for the major market funds covered in this report as nine finished in positive territory while just one, the Invesco S&P 500 Top 50 ETF XLG, managed to finish in the red with a slight loss of -0.19%. Although this week’s price action didn’t cause any notable changes from a technical perspective, the iShares MSCI Emerging Markets ETF EEM experienced a rebound over the last seven days, gaining 3.41%, which pushed the fund back into the black for the year. On a year-to-date basis, the Invesco S&P 500 Equal Weight ETF RSP now leads all 10 major market funds as it has gained 20.53% on a price return basis, followed by the iShares S&P SmallCap 600 Index Fund IJR’s YTD return of 20.32%.
As of this writing, the US Equity Core Percentile Rank, which can be found on the Asset Class Group Scores page, is sitting at 98.59%, meaning that the “Core” market ranks in the 98th percentile versus all other asset classes around the world. The US Equity Core Rank, which is also known as the DWA S&P 500 Assets Percentile Rank, is sitting at lofty levels that are not often seen. Currently, each of the S&P 500-related major market ETFs covered in this report are trading at all-time highs, maintain Point & Figure buy signals on their default charts, and are trading in overall positive trends with fund scores well above the acceptable 3.0 threshold. In fact, on Monday, August 2, we saw the Invesco S&P 500 Equal Weight ETF RSP record a new all-time high with a move to $154, which also marked the fund’s fifth consecutive buy signal since May. With a solid fund score of 5.35 and a relatively neutral OBOS% reading of 37%, the RSP is actionable at current levels. The US Equity Core Percentile Rank is one more piece of evidence in favor of US Equities, which has ranked #1 in DALI since August 25, 2020. Click here to view our recent Core Percentile Ranking decile study published on July 8, 2021.

