
Most Requested Symbols

Today we review the RSP vs SPY RS switching strategy.
The average distribution reading is -1.53% oversold.
Today's featured stock is ITT Corporation (ITT).
CDXC, CHDN, CVLT, DISCK, JPM, LAD, LPLA, OMI, PAR, RPM, SMPL, TOL, UBER & VAC
Call: Fiserv (FISV), Put: Unilever (UL), Covered Write: L Brands (LB)
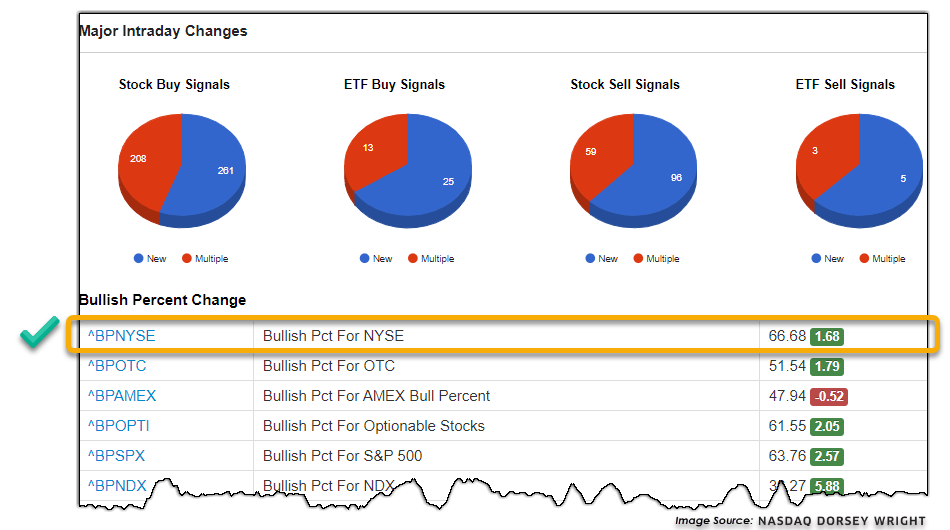
Wednesday’s intraday reading for the Bullish Percent for NYSE BPNYSE eclipsed the 66% level as of 3 pm ET, which should cause a reversal up into Xs to the 66% level after market close when the BP calculations are finalized. As a refresher, the BPNYSE indicator measures the percentage of stocks in the NYSE that are trading on Point & Figure buy signals and is used as a gauge for market participation and therefore, overall risk. The BPNYSE reversed down into a column of Os on February 23 before moving to 60% last week. In keeping with the Bullish Percent Playbook, this potential reversal back up into Xs returns the offensive team onto the field, calling for a more “risk-on” approach in the management of equity exposure. Those looking to increase equity allocation should still focus on areas with strong relative strength and favorable technical attribute/fund scores. Intraday BP readings are available via the Major Intraday Changes widget (shown in the image below) and are also provided in the Intraday Reports section under the Security Selection menu.
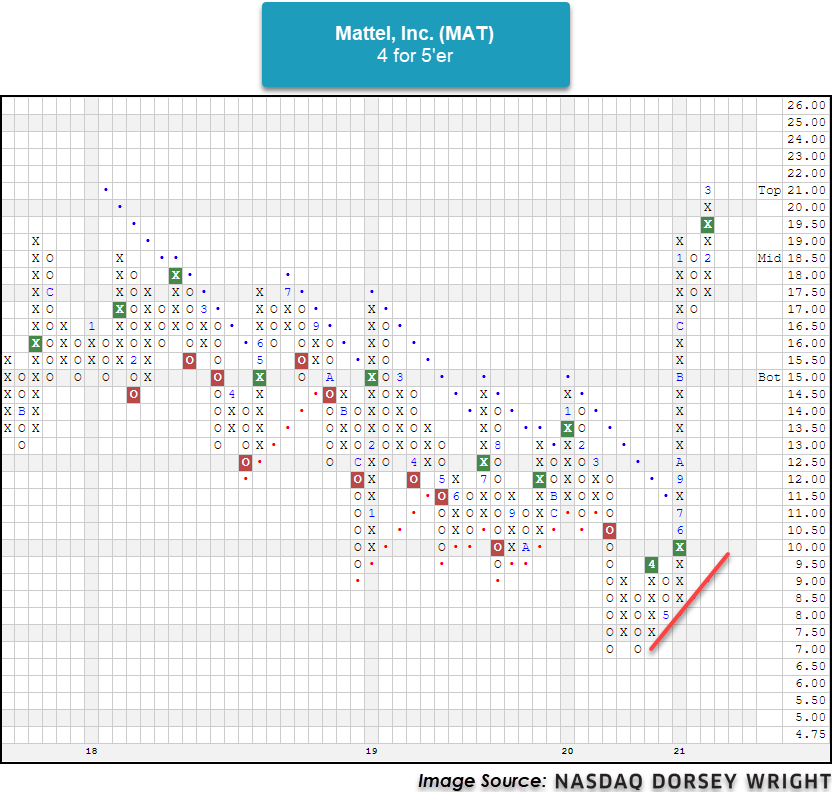
Yesterday marked the 62nd anniversary of the launch of the Barbie doll which was initially released by Mattel Inc. MAT on March 9, 1959, at the American Toy Fair in New York City (Source: History.com). Throughout the last year of lockdowns, MAT has seen a boost in its Barbie sales by 16%, leading to the toy manufacturers' best sales year since 2017. (Source: BBC). Not only has the fundamental picture for MAT improved, but the technical picture has as well. Currently, MAT is a healthy 4 for 5’er that is showing superior strength versus the broader market. Additionally, MAT is up over 12% year-to-date and is currently trading at multi-year highs on three consecutive buy signals. Since breaking out into a positive trend last July, Mattel has gained a staggering 69.13%, outperforming the S&P 500 Index by over 49%! New positions are welcome at current levels as MAT is trading in actionable territory with a weekly overbought/oversold reading of 31%. Initial support sits at the $17 level.

Each week the analysts at DWA review and comment on all major asset classes in the global markets. Shown below is the summary or snapshot of the primary technical indicators we follow for multiple areas. Should there be changes mid-week we will certainly bring these to your attention via the report.
| Universe | BP Col & Level (actual) | BP Rev Level | PT Col & Level (actual) | PT Rev Level | HiLo Col & Level (actual) | HiLo Rev Level | 10 Week Col & Level (actual) | 10 Week Rev Level | 30 Week Col & Level (actual) | 30 Week Rev Level |
|---|---|---|---|---|---|---|---|---|---|---|
| ALL |
|
58% |
|
68% |
|
78% |
|
52% |
|
80% |
| NYSE |
|
66% |
|
72% |
|
82% |
|
64% |
|
86% |
| OTC |
|
54% |
|
64% |
|
74% |
|
48% |
|
78% |
| World |
|
56% |
|
54% |
|
|
|
62% |
|
70% |
The improvement for small caps continues to shine within the ranks of DALI as Small Caps occupy the top three style boxes. Small Cap Value has moved up into the number two position, which is the first time since 2007 Small Cap Value has been ranked this high.

As strong as Large Caps, especially Large Growth, has been over the past few years, we are seeing that leadership now point towards Small and Mid Caps. The Russell 2000 Value Index RUJ is the best performing Style box this year with a return of nearly 23% (thru 3/9); however, it has consistently been the worst performing in recent years. Prior to 2021 Small Cap Value was the worst performing style in five out of the seven years. On the other hand, Large Cap Growth was the best performing style in five out of the past six years.

All of this is to say that small caps have established themselves as the leadership area of the market, and these trend can last, in some cases, for years. Prior February of this year Large Cap Growth enjoyed a lead with respect to its ranking in DALI over Small Cap Value for nearly six years! And before that, Small Cap Value was ranked higher than Large Growth for the vast majority of the period from the end of 2002 until mid-2015!


| Symbol | Name | Price | Yield | PnF Trend | RS Signal | RS Col. | Fund Score | 200 Day MA | Weekly Mom |
|---|---|---|---|---|---|---|---|---|---|
| DIA | SPDR Dow Jones Industrial Average ETF Trust | 318.61 | 1.78 | Positive | O | 3.14 | 285.60 | +2W | |
| EEM | iShares MSCI Emerging Markets ETF | 53.53 | 1.40 | Positive | Sell | O | 4.13 | 47.19 | -4W |
| EFA | iShares MSCI EAFE ETF | 75.37 | 2.10 | Positive | Sell | O | 3.10 | 67.51 | -12W |
| FM | iShares MSCI Frontier and Select EM ETF | 29.37 | 2.80 | Positive | Sell | O | 1.43 | 26.49 | -5W |
| IJH | iShares S&P MidCap 400 Index Fund | 254.50 | 1.18 | Positive | Buy | O | 4.29 | 206.77 | -7W |
| IJR | iShares S&P SmallCap 600 Index Fund | 110.17 | 0.97 | Positive | Buy | X | 4.64 | 81.55 | -5W |
| QQQ | Invesco QQQ Trust | 311.77 | 0.55 | Positive | Buy | X | 4.05 | 285.30 | -3W |
| RSP | Invesco S&P 500 Equal Weight ETF | 138.17 | 1.56 | Positive | Buy | X | 5.60 | 116.42 | +2W |
| SPY | SPDR S&P 500 ETF Trust | 387.17 | 1.50 | Positive | O | 2.99 | 347.39 | -3W | |
| XLG | Invesco S&P 500 Top 50 ETF | 290.71 | 1.24 | Positive | O | 3.29 | 266.82 | -3W |
Over the past week of market action (3/2 – 3/9), seven of the major market funds listed in the table above finished in the black while three finished in the red. The best performing fund was the iShares S&P SmallCap 600 Index Fund IJR, up 3.49% while the Invesco QQQ Trust QQQ lagged the group with a loss of -2.08%. The IJR continues to lead the pack in terms of year-to-date performance with an impressive gain of 19.88%. In fact, with today’s market action, the IJR has printed a fresh all-time high at the $112 level, extending the small-cap proxy’s year-to-date gains even further. The S&P 500 Index, as represented by the SPDR S&P 500 ETF Trust SPY, has managed a year-to-date return of 3.55%, which is actually 4.78% less than the YTD return for the Invesco S&P 500 Equal Weight ETF RSP. Recall that these two ETFs own the exact same 500+ stocks, but RSP holds them in an equally weighted fashion as opposed to the traditional cap-weighting that is employed within the SPY. So, what is causing this difference in performance? Sector exposure between the two funds has been a significant factor as the spread between the two S&P 500 index funds can be largely attributed to consumer discretionary, which has contributed 1.50% to the RSP while it contributed just 0.04% to the SPY since December 31. Similarly, the energy sector has added 1.65% to the RSP while it has contributed just 0.85% to the SPY (Source: Bloomberg). Regardless of the reason(s) behind the performance dispersion so far this year, this week the spread between the two S&P 500 funds became significant enough to cause a column change on the RS chart of RSP vs SPY, favoring equal-weight exposure for the first time in a year.
Below is a snapshot of the 3.25% relative strength (RS) chart between the equal-weight S&P 500 ETF RSP and the cap-weight S&P 500 ETF SPY. Using this single RS chart, we run an RS switching strategy between the RSP and SPY. When this chart is in a column of Xs (highlighted in pink), it suggests positive RS for equal weight exposure through RSP and therefore, the strategy owns RSP. When the chart is in a column of Os (highlighted in blue), it suggests cap-weighted exposure through SPY is likely to outperform, and the strategy will rotate out of the RSP and into the SPY. To create this RS chart yourself, simply pull up RSP’s trend chart and click on the blue “Chart” button under SmartChart on the left-hand side of the page. You will automatically be redirected to the SmartChart tool. From here, click the RS Chart dropdown and type “SPY” into the Compare to box, “3.25” into the Scale box, and “35” into the Years box. As mentioned above, this RS chart moved into a column of X's after Monday’s trading session so the RS switching strategy has rotated out of the SPY and into the RSP and will remain so until the chart reverses down into Os. A few observations from the graphic below:

SECTOR BULLISH PERCENT CHANGES
| Reversed to X | Reversed to O |
|---|---|
| 3 (BPBUIL | 74), (BPFORE | 74), (BPSTEE | 74), |
9 (BPCOMP | 40), (BPGAME | 58), (BPHOUS | 58), (BPOIL | 70), (BPREAL | 74), (BPSAVI | 84), (BPSEMI | 24), (BPSOFT | 28), (BPTRAN | 70), |
| To Xs | To Os |
|---|---|
| Autos & Parts ( 0.88 to 66 ) | None |
| Business Products ( 0.84 to 64 ) | None |
| Leisure ( 0.89 to 64 ) | None |
| Restaurants ( 0.64 to 78 ) | None |
| Retailing ( 0.68 to 50 ) | None |
Average Level
57.32
| Sector |
|---|
| Biomedics/Genetics (26%) - Bear Confirmed |
| Semiconductors (24%) - Bear Confirmed |
| Software (28%) - Bear Confirmed |
| Wall Street (28%) - Bear Confirmed |
| Sector |
|---|
| None |
| Sector |
|---|
| Autos & Parts (60%) - Bear Confirmed |
| Business Products (58%) - Bear Confirmed |
| Chemicals (66%) - Bear Confirmed |
| Electronics (50%) - Bear Confirmed |
| Finance (56%) - Bear Confirmed |
| Foods Beverages/Soap (58%) - Bull Correction |
| Gaming (58%) - Bear Alert |
| Household Goods (58%) - Bear Confirmed |
| Leisure (58%) - Bear Confirmed |
| Machinery and Tools (68%) - Bear Confirmed |
| Media (58%) - Bear Alert |
| Metals Non Ferrous (56%) - Bear Confirmed |
| Oil (70%) - Bull Confirmed |
| Real Estate (74%) - Bull Confirmed |
| Restaurants (72%) - Bull Confirmed |
| Savings & Loans (84%) - Bull Confirmed |
| Telephone (50%) - Bear Alert |
| Textiles / Apparel (72%) - Bull Confirmed |
| Transports / Non Air (70%) - Bull Confirmed |
SECTOR INDICATOR CHART CHANGES
PT is the percentage of stocks within a sector that are trading above their bullish support lines. RSX is the percentage of stocks within a sector whose relative strength charts are in a column of Xs. RSP is the percentage of stocks within a sector whose relative strength charts are on a buy signal. The strongest sectors, i.e. market leaders, will have most of these indicators positive and moving higher in a column of Xs.
|
There were mostly falling sector PT charts this week, with 20 falling and 5 rising. The following sector charts rose: Banks [^PTBANK], Building [^PTBUIL], Gas Utilities [^PTGUTI], Savings & Loans [^PTSAVI], Steel/Iron [^PTSTEE]. The following sector charts fell: Autos and Parts [^PTAUTO]-Rev. , Biomedics/Genetics [^PTBIOM], Business Products [^PTBUSI]-Rev. , Computers [^PTCOMP]-Rev. , Drugs [^PTDRUG]-Rev. , Electronics [^PTELEC]-Rev. , Utilities/Electricity [^PTEUTI], Finance [^PTFINA]-Rev. , Gaming [^PTGAME]-Rev. , Healthcare [^PTHEAL]-Rev. , Household Goods [^PTHOUS]-Rev. , Internet [^PTINET], Machinery and Tools [^PTMACH]-Rev. , Media [^PTMEDI]-Rev. , Precious Metals [^PTPREC], Retailing [^PTRETA], Semiconductors [^PTSEMI]-Rev. , Software [^PTSOFT], Wall Street [^PTWALL], Waste Management [^PTWAST]. There were 12 that reversed to O. |
|
| ^PT Charts Reversing Up - | ^PT Charts Reversing Down - |
|
|
|
| ^PT Charts Moving Higher - | ^PT Charts Moving Lower - |
|
There were mostly falling sector RSX charts this week, with 29 falling and 3 rising. The following sector charts rose: Banks [^RSXBANK], Savings & Loans [^RSXSAVI], Steel/Iron [^RSXSTEE]-Rev. . The following sector charts fell: Autos and Parts [^RSXAUTO], Biomedics/Genetics [^RSXBIOM], Business Products [^RSXBUSI], Chemicals [^RSXCHEM], Computers [^RSXCOMP], Drugs [^RSXDRUG], Electronics [^RSXELEC], Utilities/Electricity [^RSXEUTI], Finance [^RSXFINA], Food Beverages/Soap [^RSXFOOD], Gaming [^RSXGAME]-Rev. , Healthcare [^RSXHEAL], Household Goods [^RSXHOUS], Internet [^RSXINET], Leisure [^RSXLEIS]-Rev. , Media [^RSXMEDI], Metals Non Ferrous [^RSXMETA], Precious Metals [^RSXPREC], Protection Safety Equipment [^RSXPROT], Real Estate [^RSXREAL], Restaurants [^RSXREST], Retailing [^RSXRETA], Semiconductors [^RSXSEMI], Software [^RSXSOFT], Telephone [^RSXTELE], Textiles/Apparel [^RSXTEXT], Transports/Non Air [^RSXTRAN], Wall Street [^RSXWALL], Waste Management [^RSXWAST]. There were 0 that moved to buy signals and 6 that moved to sell signals. The following were buy signals: . The following were sell signals: Healthcare [^RSXHEAL],Internet [^RSXINET],Metals Non Ferrous [^RSXMETA],Retailing [^RSXRETA],Software [^RSXSOFT],Wall Street [^RSXWALL]. |
|
| ^RSX Charts Reversing Up - | ^RSX Charts Reversing Down - |
|
|
| ^RSX Charts Moving Higher - | ^RSX Charts Moving Lower - |
|
|
|
There were mostly falling sector RSP charts this week, with 14 falling and 3 rising. The following sector charts rose: Banks [^RSPBANK], Forest Prods/Paper [^RSPFORE], Savings & Loans [^RSPSAVI]. The following sector charts fell: Autos and Parts [^RSPAUTO]-Rev. , Biomedics/Genetics [^RSPBIOM]-Rev. , Computers [^RSPCOMP]-Rev. , Drugs [^RSPDRUG]-Rev. , Electronics [^RSPELEC]-Rev. , Utilities/Electricity [^RSPEUTI], Gaming [^RSPGAME]-Rev. , Healthcare [^RSPHEAL]-Rev. , Internet [^RSPINET]-Rev. , Precious Metals [^RSPPREC], Software [^RSPSOFT]-Rev. , Telephone [^RSPTELE]-Rev. , Wall Street [^RSPWALL]-Rev. , Waste Management [^RSPWAST]. There were 11 that reversed to O. |
|
| ^RSP Charts Reversing Up - | ^RSP Charts Reversing Down - |
|
|
|
| ^RSP Charts Moving Higher - | ^RSP Charts Moving Lower - |
FAVORED SECTOR STATUS CHANGES
A sector is considered to be Favored if it has 3 or 4 of the sector indicators (Relative Strength, RSX, RSP, & PT) positive, Average if it has 2 of the 4 indicators positive, & Unfavored if it has 0 or 1 of the indicators positive. The table below contains those sectors that have experienced a Favored Sector Status change over the past week. It is best to focus on sectors that are about 50% or lower on their Bullish Percent charts & are in Xs. Note: If a sector moves from Favored to Average, it doesn't necessarily mean that the sector in question has to be sold - it just means you need to evaluate your individual positions with exposure to that sector.
| Changes since 03/03/2021 | Full Report |
|
|
|
|
|||||||||||||||||||||
|
|
|
|
|
|
|||||||||||||||||||
|
|
|
|
|
|
|||||||||||||||||||
|
|
|
|
|
|
|||||||||||||||||||

The sell-off in domestic equity markets earlier this week saw some carry over into international equity markets, as shown through column reversals on both the iShares MSCI Emerging Markets ETF EEM and iShares MSCI EAFE ETF EFA. Both of these funds pulled back from relative highs toward the middle of their respective trading bands. However, each also still sits on a buy signal and in a positive trend. The decline in EEM was a bit more pronounced, as we might expect given the technology-focus in some of the emerging market economies with heavier allocations, such as China. EEM now has a -1.43 score direction posting, although the fund still maintains a strong score posting of 4.13. On the other hand, EFA has maintained a positive score direction of 0.87 and sits at a suitable score posting of 3.10.
While broad international indices have not seen that much change, there has been some movement from the individual country perspective, as shown in our NDW Country Index Matrix Ranking. This ranking, which can now be accessed under the “Specials” link found on the Premade Matrices page, saw two new additions into the top quartile of names, South Africa and Norway. Australia also showed improvement in rising to the rank of 7 out of the 43 country representatives.
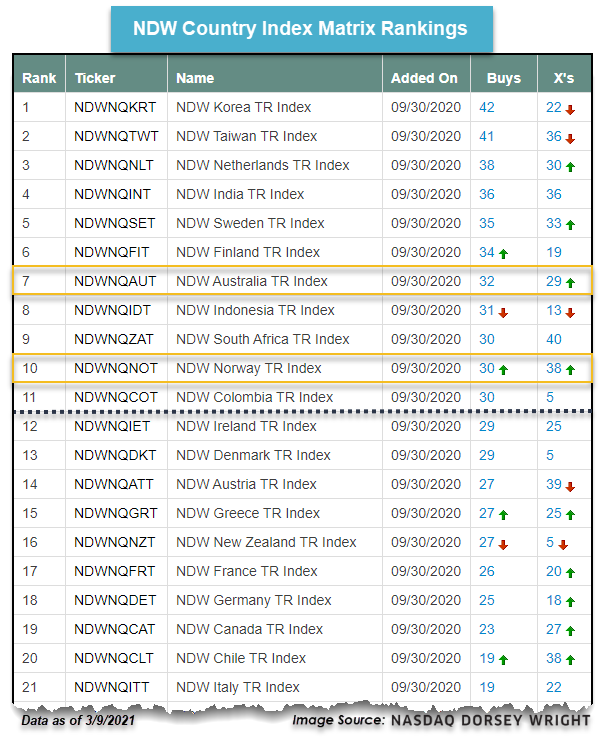
The improvement from Australia and Norway is especially interesting, as both of those countries have actually discussed tightening their lockdown restrictions over the past few weeks. Australia, which saw one of the tightest travel lockdowns globally last March and has yet to reopen its borders since that time, has maintained a significantly lower virus infection rate than other developed nations (source: thegaurdian.com). On a similar note, Norway has seen tighter lockdown restrictions than other European economies, also leading to lower infection rates (source: reuters.com).
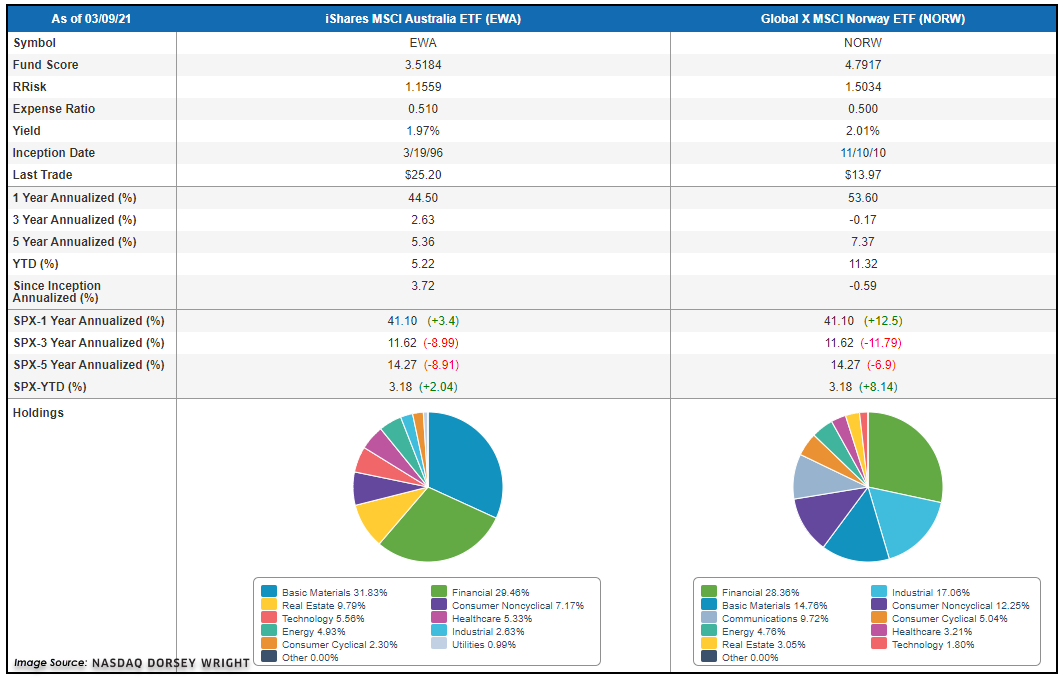
While one might initially expect news of enhancing lockdown restrictions within these countries to push shares lower, international equity investors have remained undeterred. Using the iShares MSCI Australia ETF EWA and the Global X Norway ETF NORW as our fund representatives, we can see that each remains in a column of X's, at multi-year highs and on a buy signal, with favorable fund scores. Looking underneath the hood at the constituents of each fund helps us understand some of the reasons for this movement, as each fund shows overweight positions toward financials and underweight positions in technology. Financials has continued to show improvement within our DALI domestic equity sector rankings, recently overtaking technology for the third-ranked sector position. While that ranking focuses on domestic equities, we have certainly seen that trade carry over into international equity markets, as shown through the movement of these countries as well as others with higher allocations toward financials, such as India.
The US Treasury 10YR yield Index gave an eighth consecutive buy signal in last week’s trading when it reached 1.625%. It pulled back slightly on Tuesday and Wednesday and currently sits at 1.525% on its default chart.
Rising yields have been a headwind for many areas of the fixed income market and in Monday’s trading, the iShares US Core Bond ETF AGG gave a fourth consecutive sell signal when it broke a double bottom at $114, its lowest level since April of last year. AGG has a weak 1.44 fund score and negative -2.39 score direction.
Although they continue to lead the fixed income rankings in the Asset Class Group Scores, the recent volatility in the equity market has weakened convertible bonds. The average score for the convertible bonds has fallen below 4.0 for the first time since June of last year, it now sits at 3.90.
In a related move, this week the SPDR Bloomberg Barclays Convertible Bond ETF CWB was sold from the State Street Fixed Income Model SSFIXED because its rank in the model’s relative strength matrix had fallen below the threshold to remain a holding in the portfolio. CWB had been a holding in the model since May 2020. In place of CWB, the model added the SPDR Blackstone Senior Loan ETF SRLN.
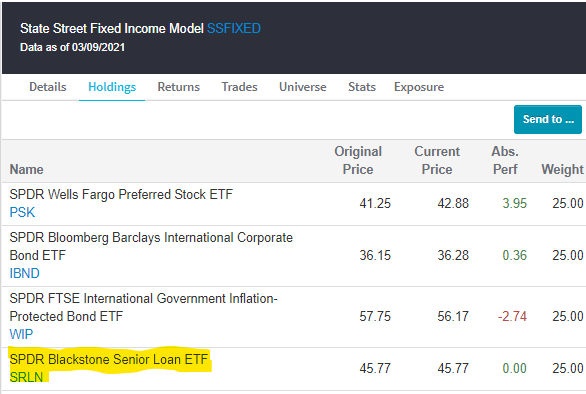
The floating rate group has moved up in the Asset Class Group Scores fixed income rankings, where it now ranks second behind convertibles with an average group score of 3.14. Unlike many other areas of the fixed income market, floating rate bonds typically perform well in a rising interest rate environment. High yield bonds are also an area of strength as the corp bond-high yield group ranks third among all fixed income groups with an average group score of 3.11.
Remember, these are technical comments only. Just as you must be aware of fundamental data for the stocks we recommend based on technical criteria in the report, so too must you be aware of important data regarding delivery, market moving government releases, and other factors that may influence commodity pricing. We try to limit our technical comments to the most actively traded contracts in advance of delivery, but some contracts trade actively right up to delivery while others taper off well in advance. Be sure you check your dates before trading these contracts. For questions regarding this section or additional coverage of commodities email james.west@dorseywright.com.
Data represented in the table below is through 3/9/2021:
Broad Market Commodities Report
| Symbol | Name | Price | PnF Trend | RS Signal | RS Col. | 200 Day MA | Weekly Mom |
|---|---|---|---|---|---|---|---|
| CL/ | Crude Oil Continuous | 64.01 | Positive | Buy | X | 44.55 | +6W |
| DBLCIX | Deutsche Bank Liquid Commodities Index | 360.24 | Positive | Sell | O | 288.08 | +6W |
| DWACOMMOD | DWA Continuous Commodity Index | 649.71 | Positive | Buy | O | 536.16 | +210W |
| GC/ | Gold Continuous | 1716.90 | Negative | Buy | O | 1859.84 | -8W |
| HG/ | Copper Continuous | 4.02 | Positive | Buy | X | 3.18 | +4W |
| ZG/ | Corn (Electronic Day Session) Continuous | 545.75 | Positive | Buy | X | 406.43 | -5W |
It was a hectic week for both equities and commodities. Oil (CL/) pushed higher to $66, Natural Gas (NG/) pulled back after a sharp bounce to the upside, copper gave its first Point and Figure sell signal since March of last year, gold continued to lag, and platinum ticked higher (PL/). With an active commodities market ripe for investors note that we recently wrote a piece on How to Gain Commodities Exposure Through ETFs, where we highlighted concentrated plays as well as actively managed products like the First Trust Global Tactical Commodity Strategy Fund (FTGC) for those seeking a core play.
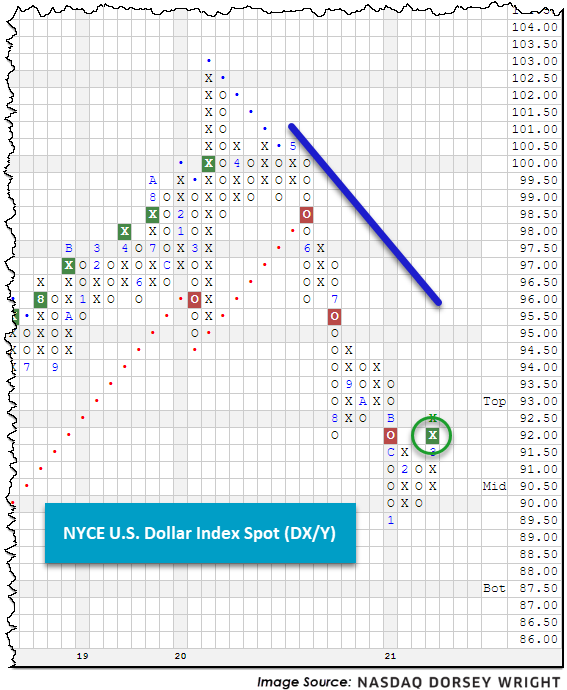
We also saw notable movement this week on the currencies front as the US dollar seems to have found a near-term bottom, returning to a Point and Figure buy signal for the first time since the beginning of March last year. Although the signal comes well within a defined downtrend, DX/Y also experienced a flip to positive monthly momentum following eight months of negative monthly momentum, suggesting the potential for additional recovery. The trade was noticeably oversold, so we will need to see further price action to determine if this is mostly a mean reversion or a change of tide. Do note that weekly momentum has been positive going on ten weeks now. In years past the US Dollar, commodity prices, and inflation were believed to correlate with greater predictive power; however, this relationship appears to have deteriorated in recent years (Source: Federal Reserve Bank of St. Louis and San Francisco). Those currently looking to these asset classes for signs of inflation, or expectation for such, may also consider weighing factors like employment, exchange rate fluctuations, and temporary supply/demand imbalances in the commodities market because of coronavirus shutdowns.
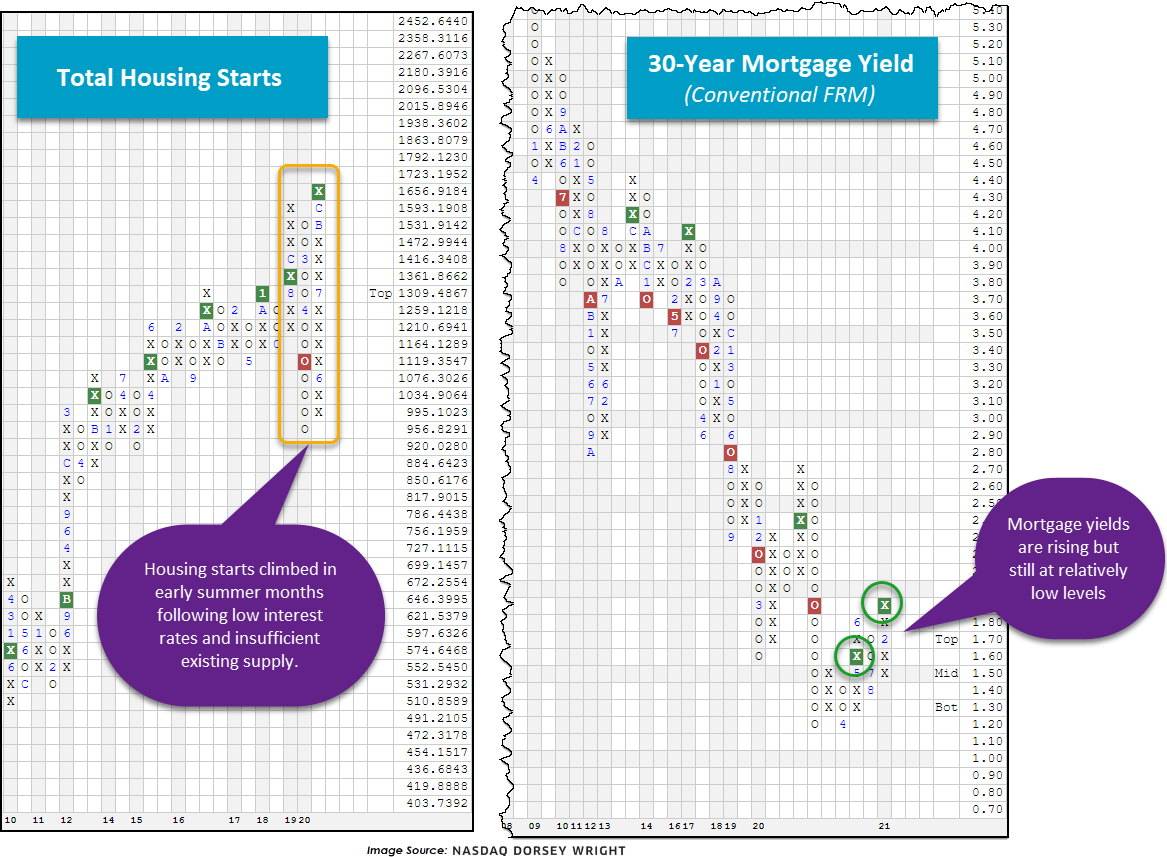
In addition to the dollar breakout and commodities movement, we recently saw positive economic data regarding the housing market. According to the National Association of Realtors, January existing home sales jumped almost 24% YoY and home prices were up 10% in 2020. The latest figures also show historically low inventory levels (about four months vs an average of six months) following years of “underbuilding” according to Realtor.com. Interest rates, and mortgage rates alike, have climbed lately but remain at relatively low levels – still acting as a tailwind for potential buyers along with favorably shifting demographics. Point being - a strong housing market has, historically, been a reliable leading indicator of economic growth which confirms technical readings we’re seeing in the commodities and equities market. At NDW we update many economic indicator charts daily, found under Security Selection > Chart Lists > Economic Indicator Charts. Below we’re showing the 30-Year Mortgage Yield (Conventional FRM) as well as the Total Housing Starts.
Average Level
-1.53
| AGG | iShares US Core Bond ETF |
| USO | United States Oil Fund |
| DIA | SPDR Dow Jones Industrial Average ETF |
| DVY | iShares Dow Jones Select Dividend Index ETF |
| DX/Y | NYCE U.S.Dollar Index Spot |
| EFA | iShares MSCI EAFE ETF |
| FXE | Invesco CurrencyShares Euro Trust |
| GLD | SPDR Gold Trust |
| GSG | iShares S&P GSCI Commodity-Indexed Trust |
| HYG | iShares iBoxx $ High Yield Corporate Bond ETF |
| ICF | iShares Cohen & Steers Realty ETF |
| IEF | iShares Barclays 7-10 Yr. Tres. Bond ETF |
| LQD | iShares iBoxx $ Investment Grade Corp. Bond ETF |
| IJH | iShares S&P 400 MidCap Index Fund |
| ONEQ | Fidelity Nasdaq Composite Index Track |
| QQQ | Invesco QQQ Trust |
| RSP | Invesco S&P 500 Equal Weight ETF |
| IWM | iShares Russell 2000 Index ETF |
| SHY | iShares Barclays 1-3 Year Tres. Bond ETF |
| IJR | iShares S&P 600 SmallCap Index Fund |
| SPY | SPDR S&P 500 Index ETF Trust |
| TLT | iShares Barclays 20+ Year Treasury Bond ETF |
| GCC | WisdomTree Continuous Commodity Index Fund |
| VOOG | Vanguard S&P 500 Growth ETF |
| VOOV | Vanguard S&P 500 Value ETF |
| EEM | iShares MSCI Emerging Markets ETF |
| XLG | Invesco S&P 500 Top 50 ETF |
Relative strength is a measure of how a stock is performing when compared to something else, in this case the S&P 500 Equal Weighted Index (SPXEWI). Each day the stock's closing price is divided by that of the SPXEWI, the resulting numbers decimal is moved two places and then plotted on a Point & Figure chart. Whenever the relative strength chart shows a double top buy signal (e.g. RS Buy or Positive Relative Strength), it suggests the stock is likely to outperform the market for the foreseeable future. Conversely, whenever the relative strength chart gives a double bottom sell signal (e.g. RS Sell or Negative Relative Strength) it suggests the stock will under-perform the market. Relative strength signals tend to last roughly 18 to 24 months on average. Consequently, changes from buy signals to sell signals (and vice versa) are important to be aware of as they are longer-term implications of a stock's likely performance versus the indices. Using the Point & Figure chart along with the relative strength chart will allow you to better ascertain risk-reward and other trade management tools, but we always want to over-weight our portfolios toward those stocks that are on RS buy signals, giving us the best chance of outperforming the broader market.
In the Optionable Universe, this week we saw 36 relative strength buy signals compared to 35 last week. On the sell side, there were 66 relative strength sell signals compared to 52 last week.
| Symbol | Company | Sector | Price | RS vs Market Signal | RS vs Market Column | RS vs Peer Signal | RS vs Peer Column | Tech Attrib |
|---|---|---|---|---|---|---|---|---|
| CFR | Cullen/Frost Bankers Inc | Banks | 112.610 | Buy | X | Buy | X | 4 |
| CRAI | Charles River Associates Incorporated | Industrial Goods & Svcs | 70.050 | Buy | X | Buy | X | 5 |
| FSP | Franklin Street Properties Corp. | Equity REITs | 6.430 | Buy | X | Sell | X | 4 |
| CLR | Continental Resources Inc. | Oil Companies Secondary | 29.710 | Buy | X | Buy | X | 5 |
| CFX | Colfax Corporation | Industrial Goods & Svcs | 47.110 | Buy | X | Sell | X | 4 |
| BOCH | Bank of Commerce Holdings | Banks | 12.090 | Buy | X | Sell | X | 3 |
| FBIZ | First Business Financial Services Inc | Banks | 25.350 | Buy | X | Sell | X | 3 |
| APTS | Preferred Apartment Communities Inc | Equity REITs | 10.220 | Buy | X | Sell | X | 4 |
| IBOC | International Bancshares Corporation | Banks | 49.340 | Buy | X | Buy | X | 4 |
| MCS | Marcus Corporation | Cyclical Goods and Services | 21.840 | Buy | X | Sell | X | 4 |
| PFS | Provident Financial Services, Inc. | Banks | 22.900 | Buy | X | Sell | X | 3 |
| PGC | Peapack Gladstone Financial Corporation | Banks | 29.460 | Buy | X | Sell | X | 3 |
| IBCP | Independent Bank Corp | Banks | 22.950 | Buy | X | Buy | X | 5 |
| RVSB | Riverview Bancorp, Inc. | Banks | 7.280 | Buy | X | Sell | X | 4 |
| SXI | Standex International Corp | Industrial Goods & Svcs | 104.570 | Buy | X | Sell | X | 4 |
| JCI | Johnson Controls International PLC | Industrial Goods & Svcs | 59.220 | Buy | X | Buy | X | 4 |
| UNM | UNUMProvident Corporation | Insurance | 28.500 | Buy | X | Sell | X | 4 |
| URBN | Urban Outfitters, Inc. | Retail | 37.220 | Buy | X | Sell | X | 4 |
| USCR | US Concrete Inc | Construction | 65.870 | Buy | X | Buy | X | 5 |
| FANG | Diamondback Energy Inc | Oil Companies Major | 81.030 | Buy | X | Buy | X | 5 |
| AHH | Armada Hoffler Properties | Equity REITs | 13.680 | Buy | X | Sell | X | 4 |
| EYES | Second Sight Medical Products, Inc | Medical Products | 15.480 | Buy | X | Buy | X | 5 |
| KMPH | Kempharm Inc | Pharmaceuticals | 9.010 | Buy | O | Sell | O | 2 |
| WRK | WestRock Co | Basic Resources | 52.950 | Buy | X | Sell | X | 3 |
| MSGN | MSG Networks Inc | Cyclical Goods and Services | 19.250 | Buy | X | Sell | X | 4 |
| KEGX | KEY ENERGY SERVICES, INC. | Oil Companies Major | 7.000 | Buy | X | Sell | X | 3 |
| LNC.TR | Lincoln National Corporation TR | Insurance | 63.653 | Buy | X | Sell | X | 4 |
| PFS.TR | Provident Financial Services, Inc. TR | Banks | 25.109 | Buy | X | Sell | X | 4 |
| CLR.TR | Continental Resources Inc. TR | Oil Companies Secondary | 29.809 | Buy | X | Buy | X | 5 |
| HES.TR | Hess Corporation TR | Oil Companies Secondary | 72.714 | Buy | X | Buy | X | 5 |
| SLB.TR | Schlumberger Limited TR | Oil Drilling, Equipment Svcs | 31.434 | Buy | X | Buy | X | 4 |
| SLG.TR | SL Green Realty Corp TR | Equity REITs | 81.942 | Buy | X | Buy | X | 5 |
| FSP.TR | Franklin Street Properties Corp. TR | Equity REITs | 6.941 | Buy | X | Buy | X | 5 |
| ROIC.TR | Retail Opportunity Investments Corp. TR | Equity REITs | 16.677 | Buy | X | Sell | X | 4 |
| RPT.TR | Ramco-Gershenson Properties Trust TR | Equity REITs | 12.369 | Buy | X | Buy | X | 5 |
| ACR.TR | ACRES Commercial Realty Corp. TR | Financial Services | 5.053 | Buy | X | Buy | X | 5 |
| Symbol | Company | Sector | Price | RS vs Market Signal | RS vs Market Column | RS vs Peer Signal | RS vs Peer Column | Tech Attrib |
|---|---|---|---|---|---|---|---|---|
| RAMP | Liveramp Holdings Inc. | Industrial Goods & Svcs | 51.470 | Sell | O | Sell | O | 0 |
| ADBE | Adobe Systems Incorporated | Software | 439.180 | Sell | O | Buy | O | 1 |
| AMED | Amedisys, Inc. | Healthcare Providers | 255.680 | Sell | O | Buy | O | 2 |
| CCI | Crown Castle International Corp. | Equity REITs | 151.040 | Sell | O | Buy | O | 1 |
| CERS | Cerus Corp. | Biotechnology | 6.280 | Sell | O | Sell | O | 1 |
| CSGP | CoStar Group Inc. | Industrial Goods & Svcs | 814.970 | Sell | O | Sell | O | 0 |
| APT | Alpha Pro Tech Limited | Medical Products | 10.700 | Sell | O | Sell | O | 0 |
| CSIQ | Canadian Solar Inc. | Industrial Goods & Svcs | 43.930 | Sell | O | Sell | O | 0 |
| EBS | Emergent Biosolutions, Inc. | Biotechnology | 86.990 | Sell | O | Buy | O | 1 |
| FSM | Fortuna Silver Mines Inc. (Canada) ADR | Basic Resources | 6.910 | Sell | O | Buy | O | 3 |
| GWRE | Guidewire Software Inc | Software | 100.860 | Sell | O | Sell | O | 1 |
| CCXI | ChemoCentryx Inc. | Biotechnology | 56.080 | Sell | O | Buy | O | 1 |
| INO | Inovio Biomedical Corp | Biotechnology | 9.750 | Sell | O | Buy | O | 1 |
| LPSN | LivePerson, Inc. | Technology Services | 56.300 | Sell | O | Sell | O | 0 |
| MPWR | Monolithic Power Systems Inc. | Semiconductors | 323.860 | Sell | O | Buy | O | 1 |
| NFLX | NetFlix Inc. | Retail | 506.440 | Sell | O | Sell | O | 0 |
| PERI | Perion Network Limited (Israel) ADR | Technology Services | 18.500 | Sell | O | Buy | O | 2 |
| MELI | Mercadolibre, Inc. | Retail | 1452.010 | Sell | O | Buy | O | 2 |
| OESX | Orion Energy Systems, Inc. | Industrial Goods & Svcs | 8.270 | Sell | O | Sell | O | 1 |
| MAG | MAG Silver Corp | Basic Resources | 17.060 | Sell | O | Buy | O | 2 |
| KNDI | Kandi Technologies, Corporation | Automobiles | 6.615 | Sell | O | Sell | O | 0 |
| MXL | MaxLinear, Inc. | Semiconductors | 33.160 | Sell | O | Sell | O | 2 |
| PRLB | Proto Labs Inc | Industrial Goods & Svcs | 127.610 | Sell | O | Sell | O | 0 |
| QUIK | QuickLogic Corporation | Semiconductors | 7.160 | Sell | O | Buy | O | 2 |
| ROL | Rollins, Inc. | Noncyclical Goods and Svcs | 32.920 | Sell | O | Sell | O | 1 |
| SNPS | Synopsys Inc | Software | 228.400 | Sell | O | Buy | O | 3 |
| TTWO | Take-Two Interactive Software, Inc. | Cyclical Goods and Services | 168.570 | Sell | O | Buy | O | 1 |
| CBIO | Catalyst Biosciences Inc. | Biotechnology | 6.090 | Sell | O | Sell | O | 1 |
| SOL | ReneSola, Ltd. (United Kingdom) ADR | Industrial Goods & Svcs | 13.630 | Sell | X | Buy | X | 3 |
| TREE | LendingTree Inc. | Banks | 235.050 | Sell | O | Sell | O | 0 |
| SPLK | Splunk Inc | Software | 135.870 | Sell | O | Buy | O | 1 |
| APPS | Digital Turbine Inc. | Technology Services | 71.510 | Sell | O | Buy | O | 2 |
| VCYT | Veracyte Inc. | Biotechnology | 50.690 | Sell | O | Buy | O | 1 |
| KODK | Eastman Kodak Company | Industrial Goods & Svcs | 8.620 | Sell | O | Sell | O | 0 |
| IOVA | Iovance Biotherapeutics Inc. | Biotechnology | 34.470 | Sell | O | Sell | O | 0 |
| DEA | Easterly Government Properties Inc | Equity REITs | 21.210 | Sell | O | Buy | O | 2 |
| CWEN | Clearway Energy Inc. | Electric Utilities | 28.590 | Sell | O | Buy | O | 2 |
| CLLS | Cellectis | Biotechnology | 21.650 | Sell | O | Buy | O | 1 |
| TRUP | Trupanion Inc. | Insurance | 87.350 | Sell | O | Sell | O | 0 |
| NTNX | Nutanix Inc | Software | 27.120 | Sell | O | Sell | O | 1 |
| COUP | Coupa Software, inc. | Software | 290.660 | Sell | O | Buy | O | 1 |
| ANAB | Anaptysbio | Biotechnology | 19.000 | Sell | O | Sell | O | 0 |
| APPN | Appian Corp. | Software | 149.700 | Sell | O | Buy | O | 2 |
| GDS | GDS Holdings Ltd. Sponsored ADR Class A | Technology Services | 89.080 | Sell | O | Sell | O | 0 |
| SFIX | Stitch Fix Inc | Retail | 49.230 | Sell | O | Sell | O | 0 |
| DNLI | Denali Therapeutics Inc. | Biotechnology | 58.230 | Sell | O | Buy | O | 1 |
| BTAI | Bioxcel Therapeutics, Inc. | Pharmaceuticals | 47.780 | Sell | O | Buy | O | 1 |
| HPR | HighPoint Resources Corporation | Oil Companies Major | 8.350 | Sell | O | Sell | O | 0 |
| SPOT | Spotify Technology S.A. | Media | 273.580 | Sell | O | Sell | O | 0 |
| GSHD | Goosehead Insurance, Inc. Class A | Insurance | 125.620 | Sell | O | Sell | O | 0 |
| CDAY | Ceridian HCM Holding, Inc. | Software | 85.370 | Sell | O | Sell | O | 0 |
| AVLR | Avalara Inc | Software | 141.510 | Sell | O | Sell | O | 0 |
| DOMO | Domo, Inc. Class B | Software | 62.320 | Sell | O | Buy | O | 3 |
| NIO | NIO Inc. Sponsored ADR Class A | Automobiles | 41.350 | Sell | O | Sell | O | 1 |
| ESTC | Elastic NV | Software | 114.440 | Sell | O | Sell | O | 0 |
| STNE | StoneCo Ltd. Class A | Industrial Goods & Svcs | 70.910 | Sell | O | Sell | O | 0 |
| APHA | Aphria Inc | Biotechnology | 18.150 | Sell | O | Buy | O | 3 |
| BLL.TR | Ball Corporation TR | Industrial Goods & Svcs | 87.433 | Sell | O | Sell | O | 0 |
| MPWR.TR | Monolithic Power Systems Inc. TR | Semiconductors | 328.194 | Sell | O | Buy | O | 1 |
| CSGP.TR | CoStar Group Inc. TR | Industrial Goods & Svcs | 814.970 | Sell | O | Sell | O | 0 |
| INVH.TR | Invitation Homes Inc TR | Equity REITs | 29.976 | Sell | O | Buy | O | 2 |
| RMD.TR | ResMed Inc TR | Medical Products | 185.247 | Sell | O | Sell | O | 0 |
| SPLK.TR | Splunk Inc TR | Software | 135.870 | Sell | O | Buy | O | 1 |
| SPOT.TR | Spotify Technology S.A. TR | Media | 273.580 | Sell | O | Sell | O | 0 |
| OPEN | Opendoor Technologies Inc. | Financial Services | 21.640 | Sell | O | Sell | O | 0 |
| YSG | Yatsen Holding Ltd. ADR Class A | Cyclical Goods and Services | 17.210 | Sell | O | Sell | O | 0 |
| Symbol | Company | Sector | Current Price | Action Price | Target | Stop | Notes |
|---|---|---|---|---|---|---|---|
| CSX | CSX Corporation | Transports/Non Air | $92.74 | high 80s to mid 90s | 106 | 75 | 4 for 5'er, LT market & Peer RS buy, pos trend, pullback from ATH, pos weekly mom flip |
| PFGC | Performance Food Group Co Formerly | Food Beverages/Soap | $55.39 | low/mid 50s to high 50s | 73 | 44 | 5 for 5'er, all-time high, top 25% of DWAFOOD, consec buy signals, pos trend |
| MOS | Mosaic Company | Chemicals | $30.78 | 28 - 31 | 54.50 | 25 | 5 for 5'er, #7 of 52 names in favored SEMI sector matrix, multiple buy signals, pullback from multi-year high, R-R>4.0 |
| SSB | South State Corp. | Banks | $87.08 | hi 70s - mid 80s | 102 | 68 | 4 for 5'er, top half of favored BANK sector matrix, spread triple top, pullback from 52-wk high, pos wkly mom flip, 2.3% yield |
| CHEF | Chefs' Warehouse Holdings, LLC | Food Beverages/Soap | $32.30 | low to mid 30s | 41.50 | 26 | 5 for 5'er, consec buy signals, #1 in DWAFOOD matrix, fav sector |
| SCCO | Southern Copper Corporation | Metals Non Ferrous | $72.97 | mid-to-upper 70s | 129 | 66 | 5 for 5'er, top half of favored META sector matrix, pullback from ATH, 2.3% yield, pot. cov. write, R-R>4.0 |
| LLY | Eli Lilly and Company | Drugs | $206.11 | low 200s to mid 220s | 238 | 160 | 4 for 5'er, top 25% of DWADRUG, consec buy signals, pullback from ATH, one box from bullish trianlge, pos mon mom |
| HWC | Hancock Whitney Corp | Banks | $41.55 | hi 30s - lo 40s | 88.50 | 36 | 5 for 5'er, 15th out of 122 names in favored BANK sector matrix, triple top, pos wkly mom flip, 2.7% yield |
| ITT | ITT Corporation | Machinery and Tools | $85.08 | mid-to-upper 80s | 111 | 74 | 4 for 5'er, top half of favored MACH sector matrix, LT pos mkt RS, pullback from ATH, pos wkly mom flip, 1% yield |
| Symbol | Company | Sector | Current Price | Action Price | Target | Stop | Notes |
|---|
| Symbol | Company | Sector | Current Price | Action Price | Target | Stop | Notes |
|---|---|---|---|---|---|---|---|
| TX | Ternium SA (Luxembourg) ADR | Steel/Iron | $35.43 | hi 20s - low 30s | 58 | 26 | See follow up comment below. |
| GNMK | Genmark Diagnostics Inc | Healthcare | $19.92 | high 10s to low 20s | 43.50 | 16.50 | See follow up comment below. |
| Comment |
|---|
| TX Ternium SA (Luxembourg) ADR R ($36.68) - Steel/Iron - TX has moved above the ideal action range. OK to hold here. Raise stop to $31, the first potential sell signal on TX's default chart. |
| GNMK Genmark Diagnostics Inc R ($16.52) - Healthcare - GNMK was down more than 17% intraday on Wednesday, triggering our $16.50 stop. |
ITT ITT Corporation R ($86.98) - Machinery and Tools - ITT is a 4 for 5'er that ranks in the top half of the favored machinery and tools sector matrix and has been on a market RS buy signal since 2013. On its default chart, ITT has given nine consecutive buy signals and reached a new all-time high earlier this month before pulling back slightly in Tuesday's trading. A recent flip to positive weekly momentum is also a positive sign for ITT. ITT carries a 1% yield and offers a potential covered write opportunity on the July '21 call options. Long exposure may be added in the mid-to-upper $80s and we will set our initial stop at $74, a potential spread quad bottom break on ITT's default chart. Using a modified vertical price objective based on the most recent buy signal, we will set our target price at $111.
| 21 | |||||||||||||||||||||||||||||||||||||||||||||||||||||
| 88.00 | X | 88.00 | |||||||||||||||||||||||||||||||||||||||||||||||||||
| 87.00 | X | O | 87.00 | ||||||||||||||||||||||||||||||||||||||||||||||||||
| 86.00 | X | O | 86.00 | ||||||||||||||||||||||||||||||||||||||||||||||||||
| 85.00 | 3 | O | 85.00 | ||||||||||||||||||||||||||||||||||||||||||||||||||
| 84.00 | X | 84.00 | |||||||||||||||||||||||||||||||||||||||||||||||||||
| 83.00 | X | 83.00 | |||||||||||||||||||||||||||||||||||||||||||||||||||
| 82.00 | X | X | 82.00 | ||||||||||||||||||||||||||||||||||||||||||||||||||
| 81.00 | X | O | X | 81.00 | |||||||||||||||||||||||||||||||||||||||||||||||||
| 80.00 | X | O | X | X | 80.00 | ||||||||||||||||||||||||||||||||||||||||||||||||
| 79.00 | X | X | O | X | O | X | Mid | 79.00 | |||||||||||||||||||||||||||||||||||||||||||||
| 78.00 | X | O | X | O | X | 2 | O | X | 78.00 | ||||||||||||||||||||||||||||||||||||||||||||
| 77.00 | X | O | X | O | X | O | X | O | 77.00 | ||||||||||||||||||||||||||||||||||||||||||||
| 76.00 | X | C | O | X | O | X | O | X | 76.00 | ||||||||||||||||||||||||||||||||||||||||||||
| 75.00 | X | O | X | 1 | O | O | • | 75.00 | |||||||||||||||||||||||||||||||||||||||||||||
| 74.00 | X | X | O | X | • | 74.00 | |||||||||||||||||||||||||||||||||||||||||||||||
| 73.00 | • | X | O | X | O | • | 73.00 | ||||||||||||||||||||||||||||||||||||||||||||||
| 72.00 | O | • | X | O | X | • | 72.00 | ||||||||||||||||||||||||||||||||||||||||||||||
| 71.00 | O | • | X | X | O | • | 71.00 | ||||||||||||||||||||||||||||||||||||||||||||||
| 70.00 | O | • | X | O | X | • | 70.00 | ||||||||||||||||||||||||||||||||||||||||||||||
| 69.00 | O | • | X | O | X | • | 69.00 | ||||||||||||||||||||||||||||||||||||||||||||||
| 68.00 | O | • | X | O | • | Bot | 68.00 | ||||||||||||||||||||||||||||||||||||||||||||||
| 67.00 | O | • | X | X | • | 67.00 | |||||||||||||||||||||||||||||||||||||||||||||||
| 66.00 | O | • | X | O | X | • | 66.00 | ||||||||||||||||||||||||||||||||||||||||||||||
| 65.00 | O | • | X | X | O | X | • | 65.00 | |||||||||||||||||||||||||||||||||||||||||||||
| 64.00 | O | • | X | O | X | X | X | O | X | • | 64.00 | ||||||||||||||||||||||||||||||||||||||||||
| 63.00 | O | • | X | O | X | O | X | O | X | O | B | • | 63.00 | ||||||||||||||||||||||||||||||||||||||||
| 62.00 | O | X | • | X | O | X | O | X | O | X | O | X | • | 62.00 | |||||||||||||||||||||||||||||||||||||||
| 61.00 | O | 3 | O | • | X | O | X | X | O | 9 | A | O | X | • | 61.00 | ||||||||||||||||||||||||||||||||||||||
| 60.00 | O | X | O | • | X | 6 | O | X | O | 8 | O | X | O | • | 60.00 | ||||||||||||||||||||||||||||||||||||||
| 59.00 | O | X | O | • | X | O | X | O | X | X | X | O | X | O | X | • | 59.00 | ||||||||||||||||||||||||||||||||||||
| 58.00 | O | O | • | X | O | X | O | X | O | X | O | X | O | X | O | • | 58.00 | ||||||||||||||||||||||||||||||||||||
| 57.00 | O | • | X | O | O | X | O | X | O | X | O | • | • | 57.00 | |||||||||||||||||||||||||||||||||||||||
| 56.00 | O | X | • | X | O | X | O | X | 7 | • | 56.00 | ||||||||||||||||||||||||||||||||||||||||||
| 55.00 | O | X | O | • | X | O | X | O | X | • | 55.00 | ||||||||||||||||||||||||||||||||||||||||||
| 54.00 | O | X | O | X | O | X | O | • | 54.00 | ||||||||||||||||||||||||||||||||||||||||||||
| 53.00 | O | X | O | X | O | • | 53.00 | ||||||||||||||||||||||||||||||||||||||||||||||
| 52.00 | O | X | X | X | 5 | X | • | 52.00 | |||||||||||||||||||||||||||||||||||||||||||||
| 51.00 | O | X | O | X | O | X | O | X | X | • | 51.00 | ||||||||||||||||||||||||||||||||||||||||||
| 50.00 | O | X | O | X | O | X | O | X | O | X | • | 50.00 | |||||||||||||||||||||||||||||||||||||||||
| 49.00 | O | X | O | X | O | X | O | X | O | X | • | 49.00 | |||||||||||||||||||||||||||||||||||||||||
| 48.00 | O | X | O | X | X | O | X | O | O | X | • | 48.00 | |||||||||||||||||||||||||||||||||||||||||
| 47.00 | O | O | X | X | O | X | O | X | O | X | • | 47.00 | |||||||||||||||||||||||||||||||||||||||||
| 46.00 | O | X | O | X | O | X | X | O | X | O | X | • | 46.00 | ||||||||||||||||||||||||||||||||||||||||
| 45.00 | O | X | O | X | O | X | O | X | O | O | • | 45.00 | |||||||||||||||||||||||||||||||||||||||||
| 44.00 | O | X | O | X | O | X | O | X | • | • | 44.00 | ||||||||||||||||||||||||||||||||||||||||||
| 43.00 | O | X | O | X | O | 4 | X | • | 43.00 | ||||||||||||||||||||||||||||||||||||||||||||
| 42.00 | O | O | X | X | O | • | 42.00 | ||||||||||||||||||||||||||||||||||||||||||||||
| 41.00 | O | X | O | X | • | 41.00 | |||||||||||||||||||||||||||||||||||||||||||||||
| 40.00 | O | X | O | X | • | 40.00 | |||||||||||||||||||||||||||||||||||||||||||||||
| 39.00 | O | X | O | X | • | 39.00 | |||||||||||||||||||||||||||||||||||||||||||||||
| 38.00 | O | X | O | X | • | 38.00 | |||||||||||||||||||||||||||||||||||||||||||||||
| 37.00 | O | X | O | X | • | 37.00 | |||||||||||||||||||||||||||||||||||||||||||||||
| 36.00 | O | O | • | 36.00 | |||||||||||||||||||||||||||||||||||||||||||||||||
| 21 |
| CDXC Chromadex Corp. ($11.08) - Forest Prods/Paper - CDXC completed a bullish triangle pattern with a double top breakout at $13.50 before moving higher to $14.50. This stock has given four consecutive buy signals and is an acceptable 3 for 5’er within the favored forest prods/paper sector. Furthermore, monthly momentum has been positive for two months, adding to the positive technical picture. From here, support sits at $10.50. Note CDXC reports earnings after today’s market close. |
| CHDN Churchill Downs Inc ($247.97) - Gaming - CHDN hit a new all-time high today when it broke a double top at $248. CHDN is a 4 for 5’er within the gaming sector that has maintained a market RS buy signal since March 2015. From here, support sits at $220. |
| CVLT Commvault Systems, Inc. ($67.29) - Software - Shares of CVLT moved higher Wednesday to break a double top at $68. This 4 for 5'er moved to a positive trend in July and ranks 6th out of 128 names in the software sector RS matrix. The weight of the evidence is positive here. Initial support can be found at $59, with further support offered at $57 and $54. Overhead resistance may be found at the multi-year high of $72 from last month. |
| DISCK Discovery Communications Inc. 'C' ($56.00) - Media - DISCK broke a double top at $56 and is now trading at new all-time highs. This marks the fifth consecutive buy signal on the chart, confirming that demand is in control. DISCK ranks 5th out of 50 names in the media sector and has all five attributes in its favor. Demand is in control however the stock is more than 160% overbought here. Initial support sits at $52. |
| JPM J.P. Morgan Chase & Co. ($155.15) - Banks - JPM shares moved higher today to break a triple top at $156 to mark its third consecutive buy signal and reach a new all-time high. This 5 for 5'er has been in a positive trend since November and on an RS buy signal versus the market since November of 2016. JPM is actionable at current levels with a weekly overbought/oversold reading of 68%. From here, support is offered at $148. |
| LAD Lithia Motors Inc-Cl A ($396.11) - Autos and Parts - LAD broke a spread triple top at $392 before moving higher to $396, marking a new all-time high on the chart. LAD is a 4 for 5’er within the autos and parts sector that has maintained a long-term market RS buy signal since April 2019. Additionally, monthly momentum has been positive for two months. From here, support sits at $376. |
| LPLA LPL Investment Holdings Inc ($140.30) - Finance - LPLA shares moved higher today to break a double top at $140 to mark its eighth consecutive buy signal and reach a new all-time high. This 5 for 5'er has been in a positive trend since May and on an RS buy signal versus the market since January. Recent price action has put LPLA into heavily overbought territory, so those wishing to initiate a position may be best served to scale in at current levels. From here, support is offered at $130. |
| OMI Owens & Minor Incorporated ($36.67) - Healthcare - OMI shares moved higher today to break a double top at $36 to mark its second consecutive buy signal. This 5 for 5'er has been in a positive trend since July and on an RS buy signal versus the market since March of 2020. OMI is actionable at current levels with a weekly overbought/oversold reading of 32%. From here, support is offered at $30. |
| PAR Par Technology Corporation ($76.25) - Computers - PAR reversed up into a column of X's Wednesday and broke a double top at $75 before continuing to $77 intraday. This 4 for 5'er moved to a positive trend in May of last year and ranks in the top third of the computers sector RS matrix. The technical picture is once again improving. Initial support can be found at $70 with further support offered at $67 and $63, the current location of the bullish support line. Overhead resistance may come at the all-time high of $90. Note that PAR has earnings expected on 3/15. |
| RPM RPM, Inc. ($88.14) - Chemicals - RPM returned a buy signal in Wednesday's trading after giving three consecutive sell signals since December. Despite the weakness in recent months, RPM's overall technical picture is positive as it is a 3 for 5'er, trading in a positive trend, and has been on a market RS buy signal since 2001. RPM carries a 1.8% yield and is expected to report earnings on 4/7. |
| SMPL Simply Good Foods Co ($33.92) - Retailing - SMPL completed a bullish triangle on Wednesday with a double top breakout at $32 before moving higher to $34, marking a new all-time high on the chart as well as the fourth consecutive buy signal. SMPL just experienced a flip to positive weekly momentum and has 3 out of 5 attributes in its favor. From here, support sits at $28. Earnings are expected on 4/5. |
| TOL Toll Brothers, Inc. ($57.84) - Building - TOL completed a shakeout pattern today with a triple top buy signal at $57 before moving higher to $58, which matches the stock’s all-time high last reached in July 2005. TOL is a 4 for 5’er within the favored building sector that is trading well above the bullish support line. Additionally, monthly momentum just flipped positive, adding to the positive technical picture. Initial support sits at $50. |
| UBER Uber Technologies, Inc. ($57.61) - Retailing - UBER broke a double top at $58, marking the second consecutive buy signal on the chart. UBER is a perfect 5 for 5’er as all of its trending and RS characteristics are positive here. From here, support sits at $51, the bullish support line. |
| VAC Marriott Vacations Worldwide Corporation ($185.54) - Leisure - VAC broke a double top at $190 and as a result, is now trading at new all-time highs. Today’s breakout marks the second consecutive buy signal for this perfect 5 for 5’er that is a member of the favored leisure sector. Demand is in control, but VAC is heavily overbought at current levels. Initial support sits at $182. |
| Name | Option Symbol | Action | Stop Loss |
|---|---|---|---|
| Fiserv, Inc. - $123.86 | FISV2118F115 | Buy the June 115.00 calls at 13.55 | 106.00 |
| Name | Option | Action |
|---|---|---|
| Bank of America ( BAC) | Jun. 30.00 Calls | Raise the option stop loss to 5.70 (CP: 7.70) |
| Comcast Corporation ( CMCSA) | Jun. 50.00 Calls | Initiate an option stop loss of 5.90 (CP: 7.90) |
| Discover Financial Services ( DFS) | Apr. 95.00 Calls | Initiate an option stop loss of 5.50 (CP: 7.50) |
| General Motors ( GM) | Jun. 50.00 Calls | Initiate an option stop loss of 7.35 (CP: 9.35) |
| Name | Option Symbol | Action | Stop Loss |
|---|---|---|---|
| Unilever PLC (United Kingdom) ADR - $54.83 | UL2120T57.5 | Buy the August 57.50 puts at 5.80 | 62.00 |
| Name | Option | Action |
|---|---|---|
| iQIYI, Inc. Sponsored ADR Class A (IQ) | Jun. 27.50 Puts | Stopped at 27.00 (CP: 27.83) |
| Walmart Inc. (WMT) | May. 140.00 Puts | Stopped at 13.30 (CP: 11.45) |
| Name | Option Sym. | Call to Sell | Call Price | Investment for 500 Shares | Annual Called Rtn. | Annual Static Rtn. | Downside Protection |
|---|---|---|---|---|---|---|---|
| L Brands Inc. $54.51 | LB2120H55 | Aug. 55.00 | 8.40 | $23,490.75 | 35.61% | 37.03% | 14.19% |
| Name | Action |
|---|---|
| Micron Technology, Inc. (MU) - 89.30 | Sell the May 90.00 Calls. |
| General Motors (GM) - 54.65 | Sell the June 55.00 Calls. |
| Alcoa Inc. (AA) - 29.94 | Sell the July 30.00 Calls. |
| Ladder Capital Corp (LADR) - 11.57 | Sell the August 12.50 Calls. |
| Halliburton Company (HAL) - 23.47 | Sell the July 25.00 Calls. |
| MGM Resorts International (MGM) - 37.48 | Sell the June 40.00 Calls. |
| The Gap, Inc. (GPS) - 28.99 | Sell the June 30.00 Calls. |
| Name | Covered Write |
|---|---|
| First Horizon Corp. ( FHN - 16.69 ) | August 18.00 covered write. |
Daily Equity & Market Analysis
Loading, Please Wait...
