Most Requested Symbols

The largest names in the S&P 500 continue to perform the best and their dominance is changing how markets move.
The end of the year brings with it client conversations and questions about what is coming down the pipeline in 2026. With that said, we will take the final trading day of 2025 to update our Dow Technical Attribute Study,
Weekly Rundown Video – Dec 30, 2025
Weekly rundown with NDW analyst team covering all major asset classes.
Weekly rundown with NDW analyst team covering all major asset classes.
As we wrap up another year, 2025 marked the continuation of a longer-term trend in the market. The 10 largest stocks in the S&P 500 handily beat the S&P Equal Weight Index by just under 15%. The Mega Cap Top 10 (MEGATEN), an equally weighted basket of the ten largest stocks in the S&P 500, has put together three consecutive years of +20% gains. The last time it was able to do this was from 2019-2021 and from 1995-1999 (five years straight) with data going back to 1990. While it’s not the largest sample size, it does show that the last few years have been abnormally good for the mega cap names. Over the last three years, MEGATEN has beaten the SPXEWI by just over 100% for the first time since the 1999-2000 period. That doesn’t mean the current run for the mega caps is over, that is a single data point in our relatively small sample size of market history. However, it is concerning that it is just a handful of names carrying the market higher and their concentration continues to trend higher.

One of the impacts of the higher level of index and performance concentration has been the breakdown in correlations between the mega-caps and the SPXEWI. The rolling three-year correlation between MEGATEN and SPXEWI is near its lowest levels ever - the only time it has been lower was in 1995. The correlation between the two has been declining over the last decade and is now down to 0.66 on a three-year basis. Yes, they’re still correlated, somewhat, but it is much lower than the strong +0.8 correlation the two had for most of the last 30 years. If we look at the one-year rolling correlation, we can begin to see how the longer-term correlation has started to fall. The two recent valleys in the one-year rolling correlation were in July 2021 and July 2024 which both were preceded by positive returns for both indices. The one-year correlation began to rise near the end of 2021 and exploded higher in 2022 as markets tumbled. The most recent rise in correlations between MEGATEN and SPXEWI was due to the tariff induced sell-off. To summarize, MEGATEN and SPXEWI are becoming less correlated in “good times” and more correlated in “bad times.” The breakdown in correlations will be important to watch moving forward as other asset classes will offer better diversification benefits than simply having exposure to more stocks.


The end of the year brings with it client conversations and questions about what is coming down the pipeline in 2026, especially after major markets managed to put together their third consecutive year of gains coming out of a disappointing 2022. With that said, we will take the final trading day of 2025 to update our Dow Technical Attribute Study, giving you ammo to talk about what has changed (and more importantly, what hasn’t) as you enter the new year.
The Dow Jones Industrial Average has gone through many changes over the years, both in the constituents of the index itself and in its relevance as a main market benchmark. In terms of recent changes, both Amazon (AMZN) and NVIDIA (NVDA) were added to the .DJIA within the last few years. Despite these recent more tech focused additions, .DJIA has still struggled to keep up with other major benchmarks. Since 1/1/2023, .DJIA has underperformed SPX & NDX by ~33.5% and ~87% respectively. Remember, the Dow Jones is a price weighted index, meaning stocks with higher share prices have a greater influence on the index's value. This difference in weighting methodology means that names like GS & CAT have a larger impact on overall movement than the likes of NVDA or AAPL… for better or for worse.
Regardless, there are fundamental analysts that rate all 30 Dow stocks as a "buy," "overweight," or "hold". While this subjective system is one of the limitations to using traditional fundamental research, it does provide advisors with an opportunity to differentiate themselves using a logical, organized, sell discipline based upon something grounded in supply and demand like our Technical Attribute ratings.
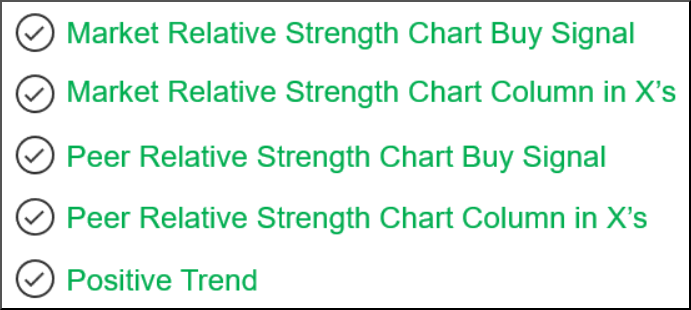
Higher equals better in this rating system. If a stock has all 5 of these attributes in its favor, it is considered a technically strong stock. On the other end of the spectrum, stocks with a technical attribute rating of 0 are considered the weakest of names. As a result, they tend to carry more risk and are often market laggards. This is not to say such stocks can't rise, but our odds of outperformance are much narrower with low attribute names (0, 1, and 2) versus high attribute names (3, 4, and 5). Our general rule of thumb is that a Technical Attribute rating of 3 or higher will increase the odds of success. From an implementation standpoint, using Technical Attributes to evaluate existing portfolios, especially those portfolios being transferred over to you, is one straightforward way to add value. For more information on the value of the NDW Technical Attribute Rating system, click here to read our latest whitepaper.
Reviewing the Stocks in the Dow by Technical Attributes
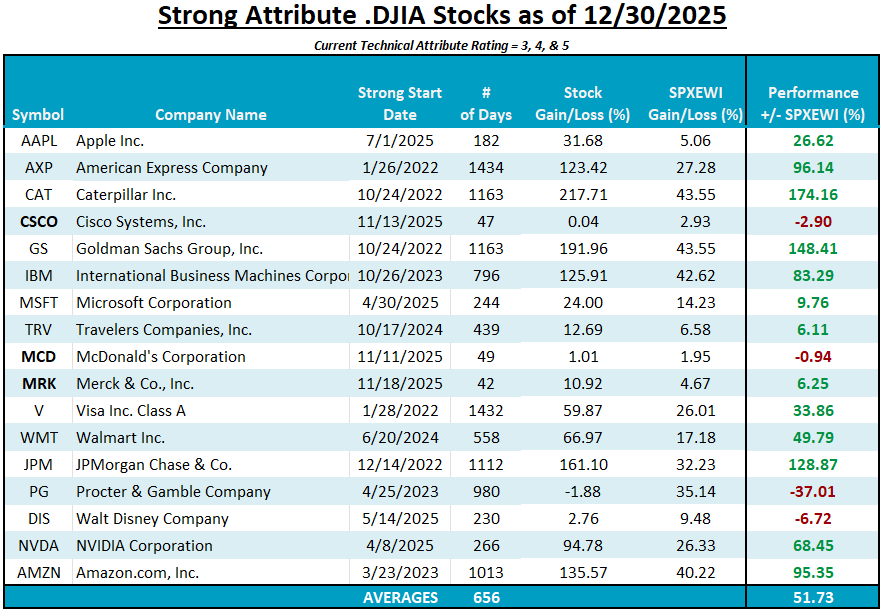
To put some numbers to this rating system, let's look at a Technical Attribute study using the components of the Dow Jones Industrial Average. We update this periodically in the Daily Equity Report, as it allows us to illustrate the benefit of implementing Technical Attributes into your business using a group of companies familiar to us all. We begin by separating the 30 components of the Dow into two categories: "weak attribute" stocks (0, 1, and 2) and "strong attribute" stocks (3, 4, and 5). The objective is two-fold. First, we want to show how each component has done versus the average stock, as represented by the S&P 500 Equal Weight Index SPXEWI. Secondly, we hope to show that using the technical attribute system helps capture the important longer-term trends.
The results of the study convey several relevant pieces of information. For instance, not ALL weak attribute stocks underperform, and not ALL high attribute stocks outperform. We would consider this to be a positive, as every time we see a market process that boasts a 100% success rate, we inherently get skeptical. While the TA rating system may not work every time, it does work over time, highlighting stocks that are market leaders and avoiding stocks that are laggards.
This can be seen in the averages from the tables below. There are currently 17 stocks in the Dow with strong TA ratings (3 or higher) as of 12/29/2025. The average length of time the Technical Attribute Rating has been "strong" for these 17 stocks is 656 days. The average outperformance for those 14 names versus the S&P Equal Weighted Index since becoming strong attribute names is over 51%, excluding dividends. Only four of these names have underperformed SPXEWI during their time in the high attribute territory, CSCO, MCD, DIS, & PG with Procter & Gamble being the only one to underperform the benchmark by more than 10%. Note that CSCO & MCD both gained technical favor within the last two months, and their overall underperformance has been relatively narrow. Other recent movers (since our last update in August) are highlighted in each table below, helping draw attention to those stocks that have gained/lost favor.
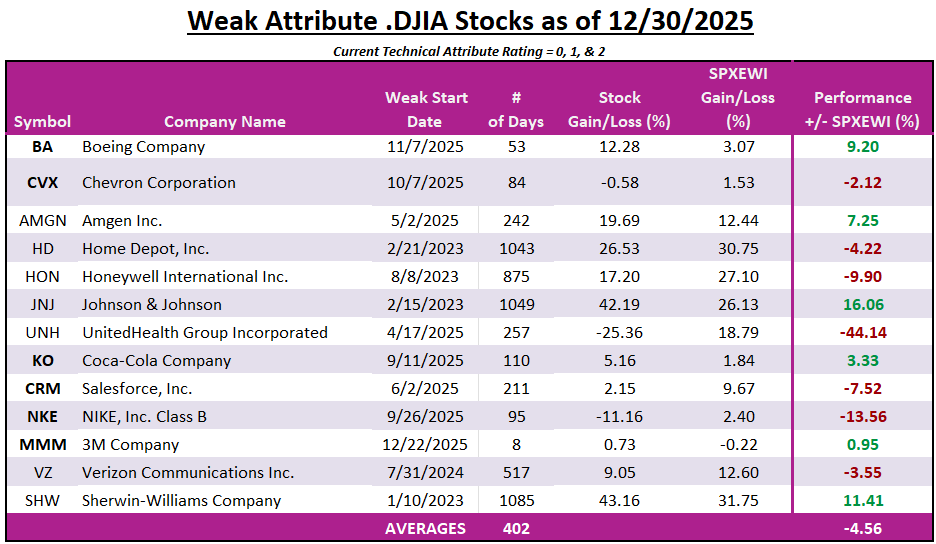
On the other hand, the remaining 13 stocks in the Dow are categorized as weak attribute names (2 or lower), and on average, these stocks have been technically weak for 402 days. Once a stock falls below the threshold of 3 positive attributes, this condition of lethargy can persist for an extended period. The average underperformance of these stocks since becoming weak attribute names is -4.56%, illustrating the importance of watching the Technical Attribute pictures for stocks that you own or manage over time. While it hasn’t been a large magnitude of underperformance during the current period, it is far less than the average return of strong attribute stocks which highlights the opportunity costs of sticking with a low attribute name on average. Just like our positive attribute table, there are certainly instances where low attribute stocks can outperform the benchmark. If this outperformance persists, these stocks can (and have) become high RS names fit for investment.
This screening process can be both a crucial aspect of your portfolio management strategy and an important part of your story with clients and prospects. The "story," in this case, is not "being right all the time." Instead, it is adding a level of analysis to your process that is not afraid to say "sell" when a holding indicates that it has likely gone into hibernation… while more fundamental analysts will maintain their “buy” or “hold” rating far longer than it would be rational. While these ratings may miss a few modest periods of outperformance or underperformance, it is self-correcting by nature, helping you to stick with the important trends in the market.
Each week the analysts at NDW review and comment on all major asset classes in the global markets. Shown below is the summary or snapshot of the primary technical indicators we follow for multiple areas. Should there be changes mid-week we will certainly bring these to your attention via the report.
| Universe | BP Col & Level (actual) | BP Rev Level | PT Col & Level (actual) | PT Rev Level | HiLo Col & Level (actual) | HiLo Rev Level | 10 Week Col & Level (actual) | 10 Week Rev Level | 30 Week Col & Level (actual) | 30 Week Rev Level |
|---|---|---|---|---|---|---|---|---|---|---|
| ALL |
|
40% |
|
38% |
|
52% |
|
46% |
|
46% |
| NYSE |
|
52% |
|
56% |
|
78% |
|
64% |
|
54% |
| OTC |
|
34% |
|
34% |
|
44% |
|
42% |
|
42% |
| World |
|
42% |
|
42% |
|
|
|
44% |
|
52% |

Remember, these are technical comments only. Just as you must be aware of fundamental data for the stocks we recommend based on technical criteria in the report, so too must you be aware of important data regarding delivery, market moving government releases, and other factors that may influence commodity pricing. We try to limit our technical comments to the most actively traded contracts in advance of delivery, but some contracts trade actively right up to delivery while others taper off well in advance. Be sure you check your dates before trading these contracts. For questions regarding this section or additional coverage of commodities email james.west@nasdaq.com.
Data represented in the table below is through 12/30/2025:
| Symbol | Name | Price | PnF Trend | RS Signal | RS Col. | 200 Day MA | Weekly Mom |
|---|---|---|---|---|---|---|---|
| CL/ | Crude Oil Continuous | 57.95 | Negative | Sell | O | 62.87 | + 1W |
| DBLCIX | Deutsche Bank Liquid Commodities Index | 468.52 | Positive | Sell | O | 460.74 | - 25W |
| DWACOMMOD | NDW Continuous Commodity Index | 1073.20 | Positive | Buy | O | 996.08 | + 8W |
| GC/ | Gold Continuous | 4370.10 | Positive | Buy | X | 3598.95 | + 4W |
| HG/ | Copper Continuous | 5.73 | Positive | Buy | X | 4.91 | + 5W |
| ZG/ | Corn (Electronic Day Session) Continuous | 440.50 | Positive | Sell | O | 430.23 | + 9W |

Average Level
7.60
| < - -100 | -100 - -80 | -80 - -60 | -60 - -40 | -40 - -20 | -20 - 0 | 0 - 20 | 20 - 40 | 40 - 60 | 60 - 80 | 80 - 100 | 100 - > |
|---|---|---|---|---|---|---|---|---|---|---|---|
|
Buy signalQQQ
|
|||||||||||
|
Buy signaliwm
|
|||||||||||
|
Buy signaldvy
|
Buy signalIJH
|
||||||||||
|
Buy signalONEQ
|
Buy signalSPY
|
||||||||||
|
Buy signalEEM
|
Buy signalefa
|
||||||||||
|
Sell signallqd
|
Buy signalhyg
|
Buy signaldia
|
|||||||||
|
Buy signalagg
|
Buy signalgsg
|
Buy signalrsp
|
|||||||||
|
Sell signalicf
|
Buy signalXLG
|
Buy signalgcc
|
|||||||||
|
Sell signaldx/y
|
Buy signalshy
|
Buy signalVOOG
|
Buy signalVOOV
|
||||||||
|
Sell signaltlt
|
Sell signalief
|
Sell signaluso
|
Buy signalijr
|
Buy signalGLD
|
Buy signalfxe
|
||||||
| < - -100 | -100 - -80 | -80 - -60 | -60 - -40 | -40 - -20 | -20 - 0 | 0 - 20 | 20 - 40 | 40 - 60 | 60 - 80 | 80 - 100 | 100 - > |
| AGG | iShares US Core Bond ETF |
| USO | United States Oil Fund |
| DIA | SPDR Dow Jones Industrial Average ETF |
| DVY | iShares Dow Jones Select Dividend Index ETF |
| DX/Y | NYCE U.S.Dollar Index Spot |
| EFA | iShares MSCI EAFE ETF |
| FXE | Invesco CurrencyShares Euro Trust |
| GLD | SPDR Gold Trust |
| GSG | iShares S&P GSCI Commodity-Indexed Trust |
| HYG | iShares iBoxx $ High Yield Corporate Bond ETF |
| ICF | iShares Cohen & Steers Realty ETF |
| IEF | iShares Barclays 7-10 Yr. Tres. Bond ETF |
| LQD | iShares iBoxx $ Investment Grade Corp. Bond ETF |
| IJH | iShares S&P 400 MidCap Index Fund |
| ONEQ | Fidelity Nasdaq Composite Index Track |
| QQQ | Invesco QQQ Trust |
| RSP | Invesco S&P 500 Equal Weight ETF |
| IWM | iShares Russell 2000 Index ETF |
| SHY | iShares Barclays 1-3 Year Tres. Bond ETF |
| IJR | iShares S&P 600 SmallCap Index Fund |
| SPY | SPDR S&P 500 Index ETF Trust |
| TLT | iShares Barclays 20+ Year Treasury Bond ETF |
| GCC | WisdomTree Continuous Commodity Index Fund |
| VOOG | Vanguard S&P 500 Growth ETF |
| VOOV | Vanguard S&P 500 Value ETF |
| EEM | iShares MSCI Emerging Markets ETF |
| XLG | Invesco S&P 500 Top 50 ETF |

| Symbol | Company | Sector | Current Price | Action Price | Target | Stop | Notes |
|---|---|---|---|---|---|---|---|
| AIT | Applied Industrial Technologies, Inc. | Machinery and Tools | $261.16 | mid 240s - ow 260s | 316 | 208 | 5 for 5'er, top half of favored MACH sector matrix, LT pos peer & mkt RS, pos trend flip, Earn. 1/28 |
| BAC | Bank of America | Banks | $55.28 | 49 - 54 | 67 | 44 | 4 for 5'er, top 25% of favored BANK sector matrix, LT pos peer RS, bullish catapult, 2.1% yield, Earn. 1/14 |
| CME | CME Group, Inc. | Wall Street | $275.83 | 260s - 270s | 312 | 224 | 4 for 5'er, middle of WALL sector matrix, triple top breakout, 1.8% yield |
| AFL | AFLAC Incorporated | Insurance | $110.80 | 108 - 115 | 143 | 95 | 4 for 5'er, top half of INSU sector matrix, LT pos peer & mkt RS, spread triple top, 2% yield |
| GFI | Gold Fields Limited (South Africa) ADR | Precious Metals | $44.12 | 40 - 44 | 58 | 35 | 4 for 5'er, top third of PREC sector matrix, LT pos peer & mkt RS, good R-R, 1.8% yield |
| CINF | Cincinnati Financial Corporation | Insurance | $164.95 | mid 150s - hi 160s | 206 | 134 | 4 TA rating, top 33% of INSU sector matrix, LT mkt RS buy, yield > 2%, pos momentum, buy-on-pullback |
| LAMR | Lamar Advertising Company | Media | $126.83 | 120s - low 130s | 158 | 110 | 4 for 5'er, top half of MEDI sector matrix, LT pos peer & mkt RS, spread triple top 4.8% yield |
| ABCB | Ameris Bancorp | Banks | $75.24 | 70s | 92 | 77 | 5 for 5'er, top 25% of BANK sector matrix, LT pos peer RS, spread quintuple top, 1.1% yield, Earn. 1/29 |
| ORI | Old Republic International | Insurance | $46.24 | lo-mid 40s | 76 | 384 | 4 TA rating, top 20% of insurance sector RS matrix, consec buy signals, recent RS buy, R-R > 4, Earn. 1/22 |
| LAZ | Lazard Inc. | Wall Street | $49.43 | hi 40s - low 50s | 69 | 41 | 5 for 5'er, middle of WALL sector matrix, LT pos peer & mkt RS, triple top, buy on pullback, good R-R, Earn. 1/29 |
| HLT | Hilton Worldwide Holdings Inc | Leisure | $290.43 | hi 260s - low 280s | 328 | 240 | 5 for 5'er, top half of LEIS sector matrix LT pos peer & mkt RS, quintuple top |
| HCA | HCA Healthcare Inc. | Healthcare | $473.26 | 450s - lo 500s | 588 | 384 | 5 TA rating, top 20% of HEAL sector matrix, LT RS buy, LT peer RS buy, consec buy signals, buy-on-pullback, Earn. 1/23 |
| LECO | Lincoln Electric Holdings, Inc. | Machinery and Tools | $243.37 | 240s | 320 | 196 | 5 for 5'er, top third of favored MACH sector matrix, LT pos peer & mkt RS, triple top, 1.3% yield |
| THC | Tenet Healthcare Corporation | Healthcare | $201.30 | 190 - mid 200s | 286 | 170 | 5 TA rating, top 50% of HEAL sector matrix, LT RS buy, buy-on-pullback |
| AU | AngloGold Ashanti Limited (South Africa) ADR | Precious Metals | $86.38 | low-to-mid 80s | 101 | 71 | 5 for 5'er, 4th of 30 in PREC sector matrix, LT pos peer & mkt RS, triple top, 3% yield |
| FLS | Flowserve Corporation | Machinery and Tools | $70.16 | hi 60s - lo 70s | 91 | 54 | 5 TA rating, top 10% of MACH sector matrix, LT RS buy, buy-on-pullback |
| BPOP | Popular, Inc. | Banks | $125.96 | 120s | 154 | 108 | 5 for 5'er, top third of favored BANK sector matrix, LT pos mkt & peer RS, 2.4% yield, Earn. 1/27 |
| BCO | The Brink's Company | Protection Safety Equipment | $118.36 | mid 110s - low 120s | 152 | 104 | 5 for 5'er, top half of PROT sector matrix, LT pos peer & mkt RS, spread triple top, R-R>2.0 |
| GOOGL | Alphabet Inc. Class A | Internet | $313.85 | 300 - hi 320s | 428 | 268 | 5 TA rating, top of INET sector matrix, LT RS buy, buy-on-pullback |
| CUBI | Customers Bancorp Inc | Banks | $73.40 | low-to-mid 70s | 89 | 63 | 4 for 5'er, top 20% of favored BANK sector matrix, RS buy signal, spread quad top, Earn. 1/22 |
| ENS | EnerSys | Electronics | $148.34 | mid 140s - low 150s | 190 | 126 | 4 for 5'er, top 20% of ELEC sector matrix, one box from RS buy signal, quadruple top |
| AAPL | Apple Inc. | Computers | $273.08 | 260s - 270s | 380 | 224 | 5 for 5'er, top 20% of COMP sector matrix, LT pos mkt RS, buy on pullback, Earn. 1/29 |
| RL | Ralph Lauren | Textiles/Apparel | $358.66 | 352 - 380s | 472 | 296 | 5 TA rating, LT RS buy, consec buy signals, buy-on-pullback |
| HEI | Heico Corporation | Aerospace Airline | $328.26 | 310s - 320s | 424 | 264 | 5 for 5'er, LT pos mkt RS, spread quad top, pos trend change |
| Symbol | Company | Sector | Current Price | Action Price | Target | Stop | Notes |
|---|
| Symbol | Company | Sector | Current Price | Action Price | Target | Stop | Notes |
|---|---|---|---|---|---|---|---|
| PII | Polaris Inc. | Leisure | $64.46 | mid-to-hi 60s | 77 | 59 | PII fell to a sell signal and a negative trend Wednesday. OK to hold here. Maintain $59 stop. Earn. 1/27 |
| Comment | |||||||
|---|---|---|---|---|---|---|---|
|
|
|||||||
HEI Heico Corporation R ($325.27) - Aerospace Airline - HEI is a 5 for 5'er and member of the aerospace airline sector that has been on a market RS buy signal since 2003. In last week's trading, HEI returned to a buy signal and a positive trend when it broke a spread quadruple top at $340, taking out resistance that had been in place since August. Long exposure may be added in the $310s to $320s and we will set our initial stop at $264, which would take out two levels of support on HEI's chart. We will use the bullish price objective, $424, as our target price.
| 340.00 | • | X | 340.00 | ||||||||||||||||||||||||||
| 336.00 | X | X | X | • | X | O | 336.00 | ||||||||||||||||||||||
| 332.00 | X | O | X | O | X | O | X | O | 332.00 | ||||||||||||||||||||
| 328.00 | X | X | 8 | O | X | O | X | X | O | X | O | 328.00 | |||||||||||||||||
| 324.00 | X | O | X | O | X | O | X | O | 9 | X | O | B | O | X | 324.00 | ||||||||||||||
| 320.00 | X | O | X | O | X | O | X | O | X | O | X | O | X | O | C | 320.00 | |||||||||||||
| 316.00 | X | 7 | O | X | O | X | O | X | O | X | O | X | O | X | Mid | 316.00 | |||||||||||||
| 312.00 | X | O | O | X | O | O | A | X | O | X | 312.00 | ||||||||||||||||||
| 308.00 | X | O | X | O | O | X | 308.00 | ||||||||||||||||||||||
| 304.00 | 6 | O | O | X | • | 304.00 | |||||||||||||||||||||||
| 300.00 | X | • | O | • | 300.00 | ||||||||||||||||||||||||
| 296.00 | X | • | • | 296.00 | |||||||||||||||||||||||||
| 292.00 | X | • | 292.00 | ||||||||||||||||||||||||||
| 288.00 | X | • | 288.00 | ||||||||||||||||||||||||||
| 284.00 | X | • | 284.00 | ||||||||||||||||||||||||||
| 280.00 | X | X | • | 280.00 | |||||||||||||||||||||||||
| 276.00 | X | O | X | • | Bot | 276.00 | |||||||||||||||||||||||
| 272.00 | X | X | X | O | X | • | 272.00 | ||||||||||||||||||||||
| 268.00 | 3 | X | O | X | O | X | O | • | 268.00 | ||||||||||||||||||||
| 264.00 | X | O | X | O | X | O | X | • | 264.00 | ||||||||||||||||||||
| 260.00 | X | O | X | 4 | X | O | • | 260.00 | |||||||||||||||||||||
| 256.00 | X | O | X | O | X | X | • | 256.00 | |||||||||||||||||||||
| 252.00 | X | O | O | X | O | 5 | • | 252.00 | |||||||||||||||||||||
| 248.00 | X | O | X | O | X | • | 248.00 | ||||||||||||||||||||||
| 244.00 | X | O | X | O | X | • | 244.00 | ||||||||||||||||||||||
| 240.00 | X | O | X | O | X | • | 240.00 | ||||||||||||||||||||||
| 236.00 | X | O | X | O | • | 236.00 | |||||||||||||||||||||||
| 232.00 | X | O | • | 232.00 | |||||||||||||||||||||||||
| 228.00 | X | • | 228.00 | ||||||||||||||||||||||||||
| 224.00 | X | • | 224.00 |
| MSTR Strategy Inc ($153.39) - Software - MSTR fell Wednesday to break a spread triple bottom at $154, marking a new 52-week low to end the year. This 0 for 5'er moved to a negative trend in October and sits near the bottom of the software sector RS matrix. The weight of the technical evidence is weak and deteriorating. Overhead resistance is seen initially at $162 with further resistance potentially seen at $170. |
| Name | Option Symbol | Action | Stop Loss |
|---|---|---|---|
| J.P. Morgan Chase & Co. - $323.81 | O: 26D325.00D17 | Buy the May 325.00 calls at 17.40 | 288.00 |
| Name | Option | Action |
|---|---|---|
|
|
||
| Name | Option Symbol | Action | Stop Loss |
|---|---|---|---|
| Sysco Corporation - $73.95 | O: 26O75.00D20 | Buy the March 75.00 puts at 3.40 | 82.00 |
| Name | Option | Action |
|---|---|---|
| Accenture PLC ( ACN) | Mar. 270.00 Puts | Initiate an option stop loss of 12.20 (CP: 14.20) |
| Name | Option Sym. | Call to Sell | Call Price | Investment for 500 Shares | Annual Called Rtn. | Annual Static Rtn. | Downside Protection |
|---|---|---|---|---|---|---|---|
| Figure Technology Solutions, Inc. Class A $ 41.68 | O: 26B45.00D20 | Mar. 45.00 | 2.95 | $ 19,148.80 | 117.62% | 46.95% | 6.16% |
| Name | Action |
|---|---|
| Amphenol Corporation ( APH) - 136.20 | Sell the March 140.00 Calls. |
| Wayfair Inc. ( W) - 101.03 | Sell the January 100.00 Calls. |
| Micron Technology, Inc. ( MU) - 292.63 | Sell the March 260.00 Calls. |
| Fortinet Inc. ( FTNT) - 80.31 | Sell the March 85.00 Calls. |
| APA Corp ( APA) - 24.70 | Sell the March 25.00 Calls. |
| Lemonade Inc ( LMND) - 71.80 | Sell the March 80.00 Calls. |
| Intel Corporation ( INTC) - 37.30 | Sell the March 37.00 Calls. |
| Estee Lauder Companies ( EL) - 105.84 | Sell the March 110.00 Calls. |
| Las Vegas Sands Corp. ( LVS) - 65.10 | Sell the March 65.00 Calls. |
| Name | Covered Write |
|---|---|
| SoFi Technologies Inc. ( SOFI - 26.56 ) | March 30.00 covered write. |
Daily Equity & Market Analysis
LISTEN TO PODCAST
May 21, 2026
Loading, Please Wait...
