Most Requested Symbols

NDW's take on a Christmas Classic
Momentum proxies continued to perform quite well in 2025 as leadership trends remained largely intact in 2025. Today we explore what history suggests could be in store for the factor in 2026.
Weekly Rundown Video – Dec 17, 2025
Weekly rundown with NDW analyst team covering all major asset classes.
Weekly rundown with NDW analyst team covering all major asset classes.
A NDW Christmas Story
‘Twas the night before Christmas and all through the market
Not a ticker was stirring, not even Tesla nor Target.
The Point and Figure charts were updated after close with great care,
In hopes that more buy signals would soon be there.
The traders were nestled all snug in their bed,
With all-time highs dancing at the front of their head.
The analysts on their laptops, working hard as hard as can be.
“The markets are up!” They said with great glee!
When over on DALI there arose such a clatter,
I sprang to my screen to see what was the matter.
Midyear they drifted, a change in the tide,
But Domestic’s back leading, with Global beside.
The intra-day upticks they caused me to rue
With equities at all-time highs, pullbacks sometimes seemed overdue.
When what to my wandering eyes did appear,
MMPR below 5? That’s a reason for cheer.
Oh how the markets can turn on a dime,
A reason to be tactical each and all of the time.
Although just buying tech has been fun…
You never know when a new trend has begun.
Oh what a treat to see what was before me
Coming down the chimney was Good Old Tom Dorsey
Tactically tilted, the accounts settled in,
As RS charts will find the places that win.
“On NVDA, on GOOGL, on Large-Cap Growth we depend,
Off Staples and Real Estate, Energy we can’t recommend
This year’s returns have been ones to display,
Now rally, now rally, may the market rally each day!"
From here our little story is not worth predicting,
As leaders and laggards they are always shifting.
And while no one can tell what’s next on the docket,
It’s the ability to adapt that keeps money in our pocket.
From Bitcoin, to Equities, to Crude to TIPS
The one constant is change, so have a plan for the dips.
With alerts set on the models and eyes on the bell,
Momentum can help identify the right time to sell.
And with that, we close the book on what's been a pretty good year,
We can hope these returns continue, and don’t disappear.
From the team at Dorsey Wright as 2026 comes into sight,
"Merry Christmas to all, and to all a good night!"


As chartists, particularly PnF chartists, we have been trained to look for patterns we can take advantage of. Whether that be finding the newest shakeout pattern on a 5 technical attribute stock or knowing what might happen during a falling dollar environment, understanding patterns can help us gain context into overall market movement thrown at us each day. Part of pattern recognition is utilizing history as a guide for future action… as the saying goes history never repeats but it often does rhyme. With that in mind, we will take today’s feature to observe what history might suggest is coming down the chute in 2026 for momentum.
To do so, we will utilize price action for proxy MTUM since 1993. From there, we can attempt to judge whether momentum carries “momentum” from year to year. As most of us know, it has been quite a productive pair of years for momentum, seeing MTUM best the broad market SPX by ~8.5% in 2024 and ~5% in 2025 (through 12/19). This comes after a historically poor showing for the factor in 2023, whose 7.51% gain lagged nearly 17% behind the broad market… it’s worst year in our observed history. Now nearly 3 years later, MTUM maintains a strong 5.10 fund score, having reversed back into X’s on its default chart to close out November. Support is offered just below the middle of the trading band at $235, which will be an important point to defend in the new year. A pullback to that point would represent a near 8% pullback.

The scatterplot below journeys back to this idea of momentum’s momentum from year to year. The X axis represents the previous year’s outperformance. Note that “outperformance” could still come with an overall negative year… it more so matters if MTUM beat our benchmark SPX. From there, we can observe the next year’s first quarter performance against SPX, plotted on the Y axis. For example, we highlighted 2024’s 8.58% calendar outperformance, which MTUM then followed up in Q1 2025 with an additional 2.27% gain over the benchmark. All this to say, data points in the top right of the graph suggest momentum continued to outperform in Q1 after doing so the previous year. Some high level statistics:

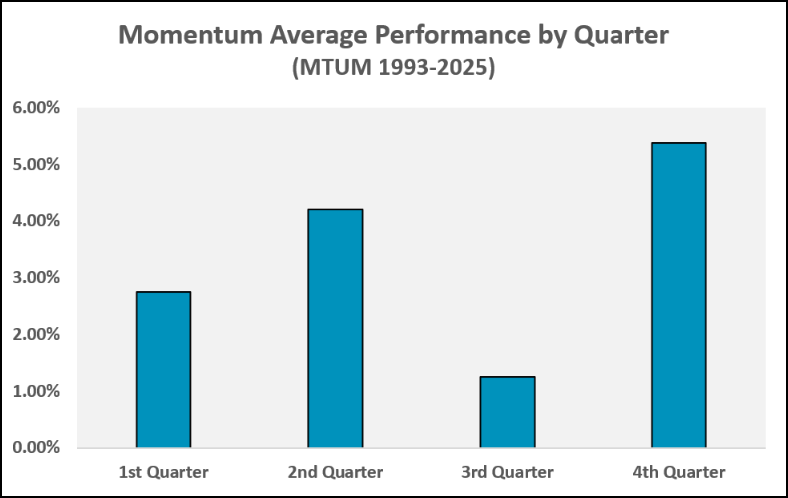
Point being, there is some credence to the idea that momentum’s momentum will follow through into Q1 2026. On average, MTUM advances in the first quarter of any year by roughly 2.75%. This is the 2nd worst (or third best!) of any quarter on average, only beating the sub 1.5% typical gain for Q3.
Remember…. averages are hardly ever hit on the nose, so chances are actual results will differ wildly from the ones explored today. Regardless, today’s study should give you some ammo for those inbound client calls asking if momentum is due for a pullback because it has done relatively well over the last few years.
Reminder: NDW offices will be closed on Christmas Day. Our team will return Friday, December 26th. Safe travels to wherever you find yourself this holiday season.
Each week the analysts at NDW review and comment on all major asset classes in the global markets. Shown below is the summary or snapshot of the primary technical indicators we follow for multiple areas. Should there be changes mid-week we will certainly bring these to your attention via the report.
| Universe | BP Col & Level (actual) | BP Rev Level | PT Col & Level (actual) | PT Rev Level | HiLo Col & Level (actual) | HiLo Rev Level | 10 Week Col & Level (actual) | 10 Week Rev Level | 30 Week Col & Level (actual) | 30 Week Rev Level |
|---|---|---|---|---|---|---|---|---|---|---|
| ALL |
|
40% |
|
38% |
|
64% |
|
46% |
|
46% |
| NYSE |
|
52% |
|
56% |
|
76% |
|
64% |
|
54% |
| OTC |
|
34% |
|
34% |
|
56% |
|
42% |
|
42% |
| World |
|
48% |
|
42% |
|
|
|
42% |
|
52% |

Remember, these are technical comments only. Just as you must be aware of fundamental data for the stocks we recommend based on technical criteria in the report, so too must you be aware of important data regarding delivery, market moving government releases, and other factors that may influence commodity pricing. We try to limit our technical comments to the most actively traded contracts in advance of delivery, but some contracts trade actively right up to delivery while others taper off well in advance. Be sure you check your dates before trading these contracts. For questions regarding this section or additional coverage of commodities email james.west@nasdaq.com.
Data represented in the table below is through 12/23/25:
| Symbol | Name | Price | PnF Trend | RS Signal | RS Col. | 200 Day MA | Weekly Mom |
|---|---|---|---|---|---|---|---|
| CL/ | Crude Oil Continuous | 58.38 | Negative | Sell | O | 63.05 | + 1W |
| DBLCIX | Deutsche Bank Liquid Commodities Index | 468.52 | Positive | Sell | O | 460.74 | - 24W |
| DWACOMMOD | NDW Continuous Commodity Index | 1073.23 | Positive | Buy | O | 993.65 | + 7W |
| GC/ | Gold Continuous | 4488.40 | Positive | Buy | X | 3569.51 | + 3W |
| HG/ | Copper Continuous | 5.49 | Positive | Buy | X | 4.90 | + 4W |
| ZG/ | Corn (Electronic Day Session) Continuous | 447.50 | Positive | Sell | O | 430.58 | + 8W |
Average Level
6.75
| < - -100 | -100 - -80 | -80 - -60 | -60 - -40 | -40 - -20 | -20 - 0 | 0 - 20 | 20 - 40 | 40 - 60 | 60 - 80 | 80 - 100 | 100 - > |
|---|---|---|---|---|---|---|---|---|---|---|---|
|
Buy signalONEQ
|
|||||||||||
|
Buy signalXLG
|
|||||||||||
|
Buy signalVOOG
|
|||||||||||
|
Buy signaliwm
|
|||||||||||
|
Buy signalefa
|
|||||||||||
|
Buy signalijr
|
|||||||||||
|
Buy signalshy
|
Buy signalSPY
|
||||||||||
|
Sell signaldx/y
|
Buy signalrsp
|
||||||||||
|
Sell signalief
|
Buy signalhyg
|
Buy signaldvy
|
Buy signalVOOV
|
||||||||
|
Buy signalagg
|
Buy signalEEM
|
Buy signalQQQ
|
Buy signalIJH
|
||||||||
|
Sell signaltlt
|
Sell signallqd
|
Sell signalicf
|
Sell signaluso
|
Buy signalgsg
|
Buy signaldia
|
Buy signalgcc
|
Buy signalfxe
|
Buy signalGLD
|
|||
| < - -100 | -100 - -80 | -80 - -60 | -60 - -40 | -40 - -20 | -20 - 0 | 0 - 20 | 20 - 40 | 40 - 60 | 60 - 80 | 80 - 100 | 100 - > |
| AGG | iShares US Core Bond ETF |
| USO | United States Oil Fund |
| DIA | SPDR Dow Jones Industrial Average ETF |
| DVY | iShares Dow Jones Select Dividend Index ETF |
| DX/Y | NYCE U.S.Dollar Index Spot |
| EFA | iShares MSCI EAFE ETF |
| FXE | Invesco CurrencyShares Euro Trust |
| GLD | SPDR Gold Trust |
| GSG | iShares S&P GSCI Commodity-Indexed Trust |
| HYG | iShares iBoxx $ High Yield Corporate Bond ETF |
| ICF | iShares Cohen & Steers Realty ETF |
| IEF | iShares Barclays 7-10 Yr. Tres. Bond ETF |
| LQD | iShares iBoxx $ Investment Grade Corp. Bond ETF |
| IJH | iShares S&P 400 MidCap Index Fund |
| ONEQ | Fidelity Nasdaq Composite Index Track |
| QQQ | Invesco QQQ Trust |
| RSP | Invesco S&P 500 Equal Weight ETF |
| IWM | iShares Russell 2000 Index ETF |
| SHY | iShares Barclays 1-3 Year Tres. Bond ETF |
| IJR | iShares S&P 600 SmallCap Index Fund |
| SPY | SPDR S&P 500 Index ETF Trust |
| TLT | iShares Barclays 20+ Year Treasury Bond ETF |
| GCC | WisdomTree Continuous Commodity Index Fund |
| VOOG | Vanguard S&P 500 Growth ETF |
| VOOV | Vanguard S&P 500 Value ETF |
| EEM | iShares MSCI Emerging Markets ETF |
| XLG | Invesco S&P 500 Top 50 ETF |

| Symbol | Company | Sector | Current Price | Action Price | Target | Stop | Notes |
|---|---|---|---|---|---|---|---|
| AIT | Applied Industrial Technologies, Inc. | Machinery and Tools | $263.58 | mid 240s - ow 260s | 316 | 208 | 5 for 5'er, top half of favored MACH sector matrix, LT pos peer & mkt RS, pos trend flip |
| BAC | Bank of America | Banks | $55.97 | 49 - 54 | 67 | 44 | 4 for 5'er, top 25% of favored BANK sector matrix, LT pos peer RS, bullish catapult, 2.1% yield, Earn. 1/14 |
| CME | CME Group, Inc. | Wall Street | $275.53 | 260s - 270s | 312 | 224 | 4 for 5'er, middle of WALL sector matrix, triple top breakout, 1.8% yield |
| AFL | AFLAC Incorporated | Insurance | $110.72 | 108 - 115 | 143 | 95 | 4 for 5'er, top half of INSU sector matrix, LT pos peer & mkt RS, spread triple top, 2% yield |
| GFI | Gold Fields Limited (South Africa) ADR | Precious Metals | $46.17 | 40 - 44 | 58 | 35 | 4 for 5'er, top third of PREC sector matrix, LT pos peer & mkt RS, good R-R, 1.8% yield |
| CINF | Cincinnati Financial Corporation | Insurance | $165.78 | mid 150s - hi 160s | 206 | 134 | 4 TA rating, top 33% of INSU sector matrix, LT mkt RS buy, yield > 2%, pos momentum, buy-on-pullback |
| LAMR | Lamar Advertising Company | Media | $126.76 | 120s - low 130s | 158 | 110 | 4 for 5'er, top half of MEDI sector matrix, LT pos peer & mkt RS, spread triple top 4.8% yield |
| ABCB | Ameris Bancorp | Banks | $76.42 | 70s | 92 | 77 | 5 for 5'er, top 25% of BANK sector matrix, LT pos peer RS, spread quintuple top, 1.1% yield |
| ORI | Old Republic International | Insurance | $46.45 | lo-mid 40s | 76 | 384 | 4 TA rating, top 20% of insurance sector RS matrix, consec buy signals, recent RS buy, R-R > 4, Earn. 1/22 |
| LAZ | Lazard Inc. | Wall Street | $49.27 | hi 40s - low 50s | 69 | 41 | 5 for 5'er, middle of WALL sector matrix, LT pos peer & mkt RS, triple top, buy on pullback, good R-R |
| HLT | Hilton Worldwide Holdings Inc | Leisure | $291.38 | hi 260s - low 280s | 328 | 240 | 5 for 5'er, top half of LEIS sector matrix LT pos peer & mkt RS, quintuple top |
| HCA | HCA Healthcare Inc. | Healthcare | $474.04 | 450s - lo 500s | 588 | 384 | 5 TA rating, top 20% of HEAL sector matrix, LT RS buy, LT peer RS buy, consec buy signals, buy-on-pullback |
| LECO | Lincoln Electric Holdings, Inc. | Machinery and Tools | $245.39 | 240s | 320 | 196 | 5 for 5'er, top third of favored MACH sector matrix, LT pos peer & mkt RS, triple top, 1.3% yield |
| PII | Polaris Inc. | Leisure | $67.12 | mid-to-hi 60s | 77 | 59 | 4 for 5'er, top 10% of LEIS sector matrix, bullish catapult, pos trend flip, 3.8% yield |
| THC | Tenet Healthcare Corporation | Healthcare | $198.76 | 190 - mid 200s | 286 | 170 | 5 TA rating, top 50% of HEAL sector matrix, LT RS buy, buy-on-pullback |
| AU | AngloGold Ashanti Limited (South Africa) ADR | Precious Metals | $89.60 | low-to-mid 80s | 101 | 71 | 5 for 5'er, 4th of 30 in PREC sector matrix, LT pos peer & mkt RS, triple top, 3% yield |
| FLS | Flowserve Corporation | Machinery and Tools | $71.24 | hi 60s - lo 70s | 91 | 54 | 5 TA rating, top 10% of MACH sector matrix, LT RS buy, buy-on-pullback |
| BPOP | Popular, Inc. | Banks | $125.37 | 120s | 154 | 108 | 5 for 5'er, top third of favored BANK sector matrix, LT pos mkt & peer RS, 2.4% yield |
| BCO | The Brink's Company | Protection Safety Equipment | $118.24 | mid 110s - low 120s | 152 | 104 | 5 for 5'er, top half of PROT sector matrix, LT pos peer & mkt RS, spread triple top, R-R>2.0 |
| GOOGL | Alphabet Inc. Class A | Internet | $314.35 | 300 - hi 320s | 428 | 268 | 5 TA rating, top of INET sector matrix, LT RS buy, buy-on-pullback |
| CUBI | Customers Bancorp Inc | Banks | $76.41 | low-to-mid 70s | 89 | 63 | 4 for 5'er, top 20% of favored BANK sector matrix, RS buy signal, spread quad top, Earn. 1/22 |
| Symbol | Company | Sector | Current Price | Action Price | Target | Stop | Notes |
|---|
| Comment | |||||||
|---|---|---|---|---|---|---|---|
|
|
|||||||
CUBI Customers Bancorp Inc R ($76.22) - Banks - CUBI is a 4 for 5'er that ranks in the top quintile of the favored banks sector matrix and recently moved to a market RS buy signal. On its default chart, CUBI gave a second consecutive buy signal earlier this month when it broke a spread quadruple top at $73, taking out resistance that had been in place since August. Long exposure may be added in the low-to-mid $70s and we will set our initial stop at $63, which would take out two levels of support on CUBI's chart and violate its trend line. We will use the bullish price objective, $89, as our target price.
| 78.00 | X | 78.00 | |||||||||||||||||||||||||||
| 77.00 | X | 77.00 | |||||||||||||||||||||||||||
| 76.00 | X | 76.00 | |||||||||||||||||||||||||||
| 75.00 | X | 75.00 | |||||||||||||||||||||||||||
| 74.00 | X | 74.00 | |||||||||||||||||||||||||||
| 73.00 | • | X | 73.00 | ||||||||||||||||||||||||||
| 72.00 | X | • | X | X | X | 72.00 | |||||||||||||||||||||||
| 71.00 | X | O | • | X | O | C | O | X | 71.00 | ||||||||||||||||||||
| 70.00 | X | O | • | X | O | X | O | X | 70.00 | ||||||||||||||||||||
| 69.00 | X | 9 | X | • | X | O | X | X | O | 69.00 | |||||||||||||||||||
| 68.00 | X | O | X | O | • | X | O | X | O | X | Mid | 68.00 | |||||||||||||||||
| 67.00 | X | X | X | X | O | X | O | A | X | O | X | O | X | 67.00 | |||||||||||||||
| 66.00 | X | O | X | O | X | O | X | O | O | X | O | X | B | O | X | • | 66.00 | ||||||||||||
| 65.00 | X | O | X | O | X | X | O | X | O | X | O | X | O | X | • | 65.00 | |||||||||||||
| 64.00 | X | O | O | X | O | X | O | X | O | O | X | O | • | 64.00 | |||||||||||||||
| 63.00 | X | O | X | O | X | O | X | O | X | • | 63.00 | ||||||||||||||||||
| 62.00 | X | O | O | 8 | X | O | X | • | 62.00 | ||||||||||||||||||||
| 61.00 | 7 | O | O | X | • | 61.00 | |||||||||||||||||||||||
| 60.00 | X | • | O | • | 60.00 | ||||||||||||||||||||||||
| 59.00 | X | • | • | 59.00 | |||||||||||||||||||||||||
| 58.00 | X | • | 58.00 | ||||||||||||||||||||||||||
| 57.00 | X | • | 57.00 | ||||||||||||||||||||||||||
| 56.00 | X | • | 56.00 | ||||||||||||||||||||||||||
| 55.00 | X | X | • | 55.00 | |||||||||||||||||||||||||
| 54.00 | X | O | X | X | • | Bot | 54.00 | ||||||||||||||||||||||
| 53.00 | X | O | 6 | O | X | • | 53.00 | ||||||||||||||||||||||
| 52.00 | 5 | O | X | O | X | • | 52.00 | ||||||||||||||||||||||
| 51.00 | O | X | O | X | O | • | 51.00 | ||||||||||||||||||||||
| 50.00 | O | X | O | • | 50.00 | ||||||||||||||||||||||||
| 49.00 | O | • | 49.00 |
| DVA DaVita, Inc. ($113.57) - Healthcare - DVA inched down lower to break a double bottom at $114, marking the fifth consecutive buy signal. The 2 for 5'er moved down from a 3 in September after reversing back into Os against its peers. Additionally, the stock ranks near the bottom of the healthcare sector matrix. A sell can be considered. Initial strong resistance can be seen at $122, with additional resistance at $124. |
| JBL Jabil Circuit, Inc. ($234.70) - Electronics - JBL rose Wednesday to break a double top at $236, matching its all-time high from September. This 4 for 5'er moved to a positive trend in May and has maintained an RS buy signal against the market since 2019. The weight of the technical evidence is favorable and improving. Initial support can be seen at $208 with further support at $190. |
| LMT Lockheed Martin Corporation ($488.70) - Aerospace Airline - LMT returned to a buy signal today, but the overall technical picture leaves much to be desired. The stock remains a technically unfavorable 2/5'er... now closing on a roughly flat 2025. Those looking to take a flier position on the name should continue to watch for further improvements in TA score or a break past some stubborn resistance between $504-$512. For now, set an alert for a breakout passed $520. |
| SNDK SanDisk Corp ($252.92) - Computers - SNDK pushed higher Wednesday to break a double top at $256 before reaching $260 intraday. This 4 for 5'er moved to a positive trend in June and just moved back to a column of Xs against the market this week. The weight of the technical evidence is favorable and improving. Initial support can be seen at $236 with further support at $200. |
| Name | Option Symbol | Action | Stop Loss |
|---|---|---|---|
| Caterpillar, Inc. - $583.66 | O: 26C580.00D20 | Buy the March 580.00 calls at 44.25 | 536.00 |
| Name | Option | Action |
|---|---|---|
| Bank of America ( BAC) | Jan. 52.50 Calls | Raise the option stop loss to 2.40 (CP: 4.40) |
| J.P. Morgan Chase & Co. ( JPM) | Feb. 320.00 Calls | Raise the option stop loss to 15.55 (CP: 17.55) |
| Bank of America ( BAC) | Mar. 52.50 Calls | Raise the option stop loss to 3.25 (CP: 5.25) |
| Johnson Controls International PLC ( JCI) | Feb. 115.00 Calls | Raise the option stop loss to 7.40 (CP: 9.40) |
| Citigroup, Inc. ( C) | Mar. 100.00 Calls | Raise the option stop loss to 21.80 (CP: 23.80) |
| Apple Inc. ( AAPL) | Mar. 270.00 Calls | Initiate an option stop loss of 12.95 (CP: 15.95) |
| Name | Option Symbol | Action | Stop Loss |
|---|---|---|---|
| The Kroger Co. - $62.89 | O: 26O62.50D20 | Buy the March 62.50 puts at 2.82 | 70.00 |
| Name | Option | Action |
|---|---|---|
| NIKE, Inc. ( NKE) | Feb. 67.50 Puts | Stopped at 8.15 (CP: 7.55) |
| Name | Option Sym. | Call to Sell | Call Price | Investment for 500 Shares | Annual Called Rtn. | Annual Static Rtn. | Downside Protection |
|---|---|---|---|---|---|---|---|
| Lemonade Inc $ 78.92 | O: 26B80.00D20 | Feb. 80.00 | 8.70 | $ 36,027.85 | 62.41% | 68.25% | 9.78% |
| Name | Action |
|---|---|
| SoFi Technologies Inc. ( SOFI) - 27.19 | Sell the February 30.00 Calls. |
| Amphenol Corporation ( APH) - 137.12 | Sell the March 140.00 Calls. |
| Las Vegas Sands Corp. ( LVS) - 66.20 | Sell the February 67.50 Calls. |
| Wayfair Inc. ( W) - 101.60 | Sell the January 100.00 Calls. |
| Micron Technology, Inc. ( MU) - 276.27 | Sell the March 260.00 Calls. |
| Hewlett Packard Enterprise Company ( HPE) - 24.58 | Sell the February 25.00 Calls. |
| Fortinet Inc. ( FTNT) - 80.66 | Sell the March 85.00 Calls. |
| APA Corp ( APA) - 24.36 | Sell the March 25.00 Calls. |
| Name | Covered Write |
|---|---|
|
|
|
Daily Equity & Market Analysis
NDW MORNING UPDATE
Dec 26, 2025
Loading, Please Wait...
