Odds and Ends: The US Dollar saw a bounce and the latest real estate data is showing signs of economic strength
Remember, these are technical comments only. Just as you must be aware of fundamental data for the stocks we recommend based on technical criteria in the report, so too must you be aware of important data regarding delivery, market moving government releases, and other factors that may influence commodity pricing. We try to limit our technical comments to the most actively traded contracts in advance of delivery, but some contracts trade actively right up to delivery while others taper off well in advance. Be sure you check your dates before trading these contracts. For questions regarding this section or additional coverage of commodities email james.west@dorseywright.com.
Data represented in the table below is through 3/9/2021:
Broad Market Commodities Report
Portfolio View - Commodity Indices
| Symbol | Name | Price | PnF Trend | RS Signal | RS Col. | 200 Day MA | Weekly Mom |
|---|---|---|---|---|---|---|---|
| CL/ | Crude Oil Continuous | 64.01 | Positive | Buy | X | 44.55 | +6W |
| DBLCIX | Deutsche Bank Liquid Commodities Index | 360.24 | Positive | Sell | O | 288.08 | +6W |
| DWACOMMOD | DWA Continuous Commodity Index | 649.71 | Positive | Buy | O | 536.16 | +210W |
| GC/ | Gold Continuous | 1716.90 | Negative | Buy | O | 1859.84 | -8W |
| HG/ | Copper Continuous | 4.02 | Positive | Buy | X | 3.18 | +4W |
| ZG/ | Corn (Electronic Day Session) Continuous | 545.75 | Positive | Buy | X | 406.43 | -5W |
It was a hectic week for both equities and commodities. Oil (CL/) pushed higher to $66, Natural Gas (NG/) pulled back after a sharp bounce to the upside, copper gave its first Point and Figure sell signal since March of last year, gold continued to lag, and platinum ticked higher (PL/). With an active commodities market ripe for investors note that we recently wrote a piece on How to Gain Commodities Exposure Through ETFs, where we highlighted concentrated plays as well as actively managed products like the First Trust Global Tactical Commodity Strategy Fund (FTGC) for those seeking a core play.
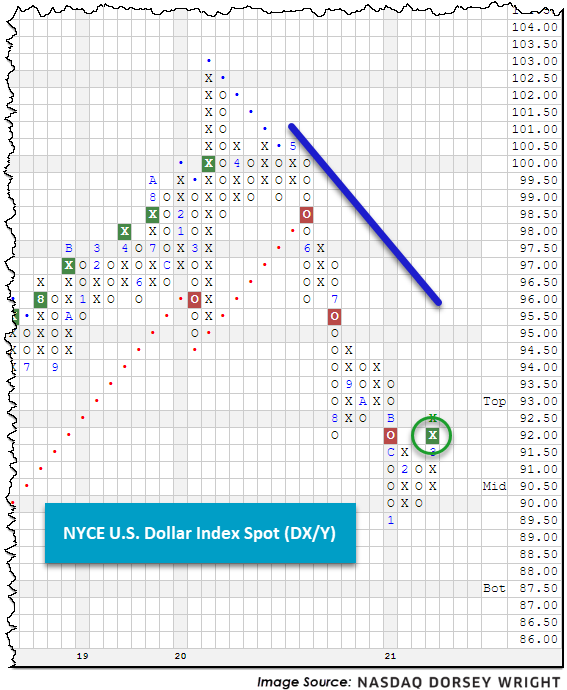
We also saw notable movement this week on the currencies front as the US dollar seems to have found a near-term bottom, returning to a Point and Figure buy signal for the first time since the beginning of March last year. Although the signal comes well within a defined downtrend, DX/Y also experienced a flip to positive monthly momentum following eight months of negative monthly momentum, suggesting the potential for additional recovery. The trade was noticeably oversold, so we will need to see further price action to determine if this is mostly a mean reversion or a change of tide. Do note that weekly momentum has been positive going on ten weeks now. In years past the US Dollar, commodity prices, and inflation were believed to correlate with greater predictive power; however, this relationship appears to have deteriorated in recent years (Source: Federal Reserve Bank of St. Louis and San Francisco). Those currently looking to these asset classes for signs of inflation, or expectation for such, may also consider weighing factors like employment, exchange rate fluctuations, and temporary supply/demand imbalances in the commodities market because of coronavirus shutdowns.
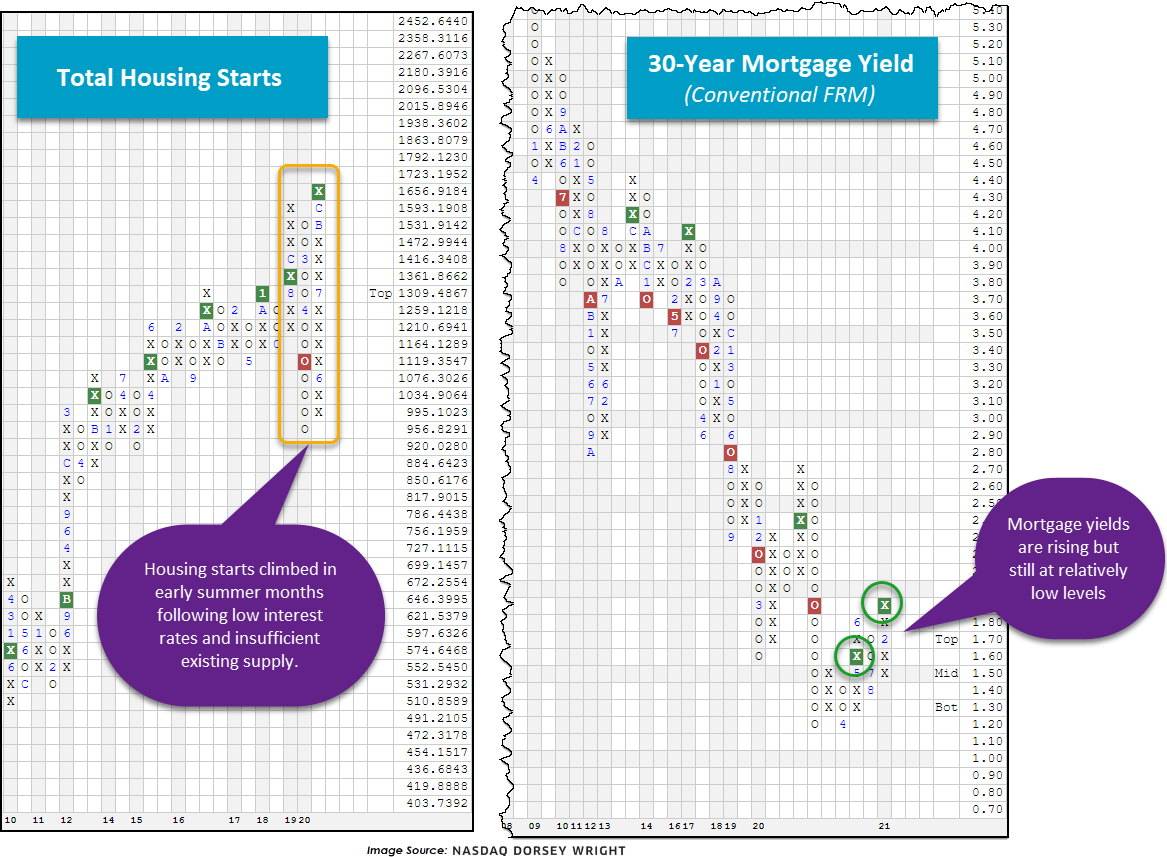
In addition to the dollar breakout and commodities movement, we recently saw positive economic data regarding the housing market. According to the National Association of Realtors, January existing home sales jumped almost 24% YoY and home prices were up 10% in 2020. The latest figures also show historically low inventory levels (about four months vs an average of six months) following years of “underbuilding” according to Realtor.com. Interest rates, and mortgage rates alike, have climbed lately but remain at relatively low levels – still acting as a tailwind for potential buyers along with favorably shifting demographics. Point being - a strong housing market has, historically, been a reliable leading indicator of economic growth which confirms technical readings we’re seeing in the commodities and equities market. At NDW we update many economic indicator charts daily, found under Security Selection > Chart Lists > Economic Indicator Charts. Below we’re showing the 30-Year Mortgage Yield (Conventional FRM) as well as the Total Housing Starts.