
Most Requested Symbols

Commodities close the gap on International Equities in the asset class ranking, and Energy overtakes Technology in the Domestic Equity sector breakdown.
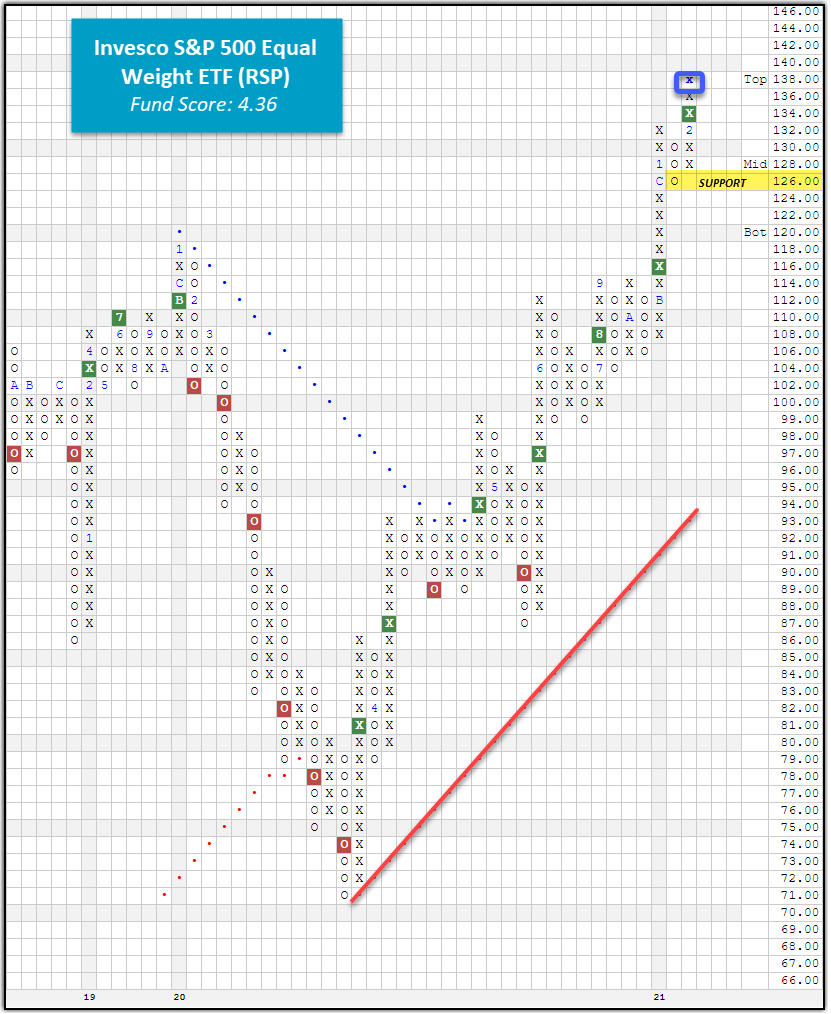
With today’s market action, the Invesco S&P 500 Equal Weight ETF [RSP] printed a new all-time high at $138.
Today's featured stock is Cameco Corporation (CCJ).
CADE, MKSI, PAYX, THC, STX, MS, ITRI, AAL, AEO, GPI, TDG, LAD, LYV, MTN, PII, UAL, APA, CE, & FANG.
Call: General Motors (GM), Put: Dominion Energy (D), Covered Write: Alcoa (AA)
2021 Market Outlook Webinar: The team at Nasdaq Dorsey Wright (NDW) will discuss the outlook for H1 2021 through a technical lens. Leave your emotions behind and join us for an objective look at the markets. Register Here
Topics We Will Cover:
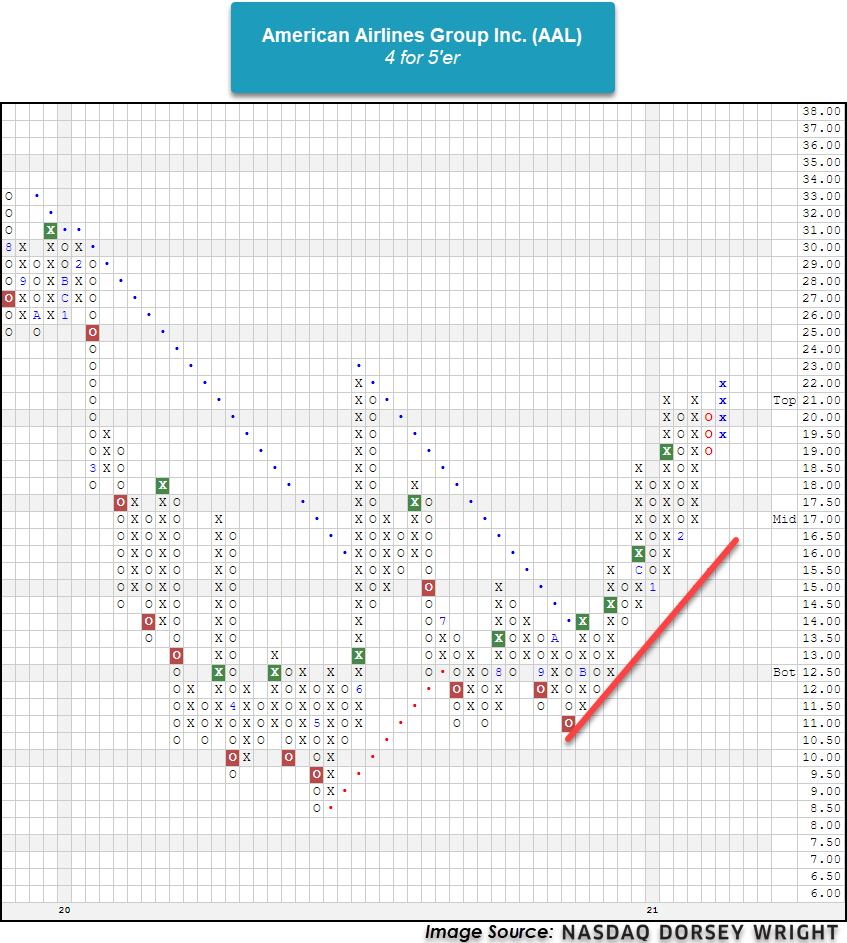
Countries around the world have started to announce reopening plans, sending investors sprawling towards “reopening” stocks in the travel and entertainment sectors (Bloomberg). In particular, airline stocks have rallied on the news. For those looking for broad exposure to airline stocks, the U.S. Global Jets ETF JETS offers exposure to both domestic and international airlines and has an acceptable fund score of 3.83. Its largest holding, American Airlines AAL, will print its fifth consecutive buy signal after today’s market action, which is now testing resistance dating back to June of last year. AAL is a 4 for 5’er having been in a positive trend since November and moving to an RS buy signal versus the market this past Monday. The rally has put AAL into overbought territory with a weekly overbought/oversold reading of 80%, so those looking to initiate new positions may be best served to scale in at current levels. From here, support is offered at $19.

Each week the analysts at DWA review and comment on all major asset classes in the global markets. Shown below is the summary or snapshot of the primary technical indicators we follow for multiple areas. Should there be changes mid-week we will certainly bring these to your attention via the report.
| Universe | BP Col & Level (actual) | BP Rev Level | PT Col & Level (actual) | PT Rev Level | HiLo Col & Level (actual) | HiLo Rev Level | 10 Week Col & Level (actual) | 10 Week Rev Level | 30 Week Col & Level (actual) | 30 Week Rev Level |
|---|---|---|---|---|---|---|---|---|---|---|
| ALL |
|
70% |
|
64% |
|
92% |
|
78% |
|
82% |
| NYSE |
|
76% |
|
72% |
|
92% |
|
80% |
|
84% |
| OTC |
|
66% |
|
60% |
|
98% |
|
78% |
|
88% |
| World |
|
52% |
|
54% |
|
|
|
60% |
|
70% |
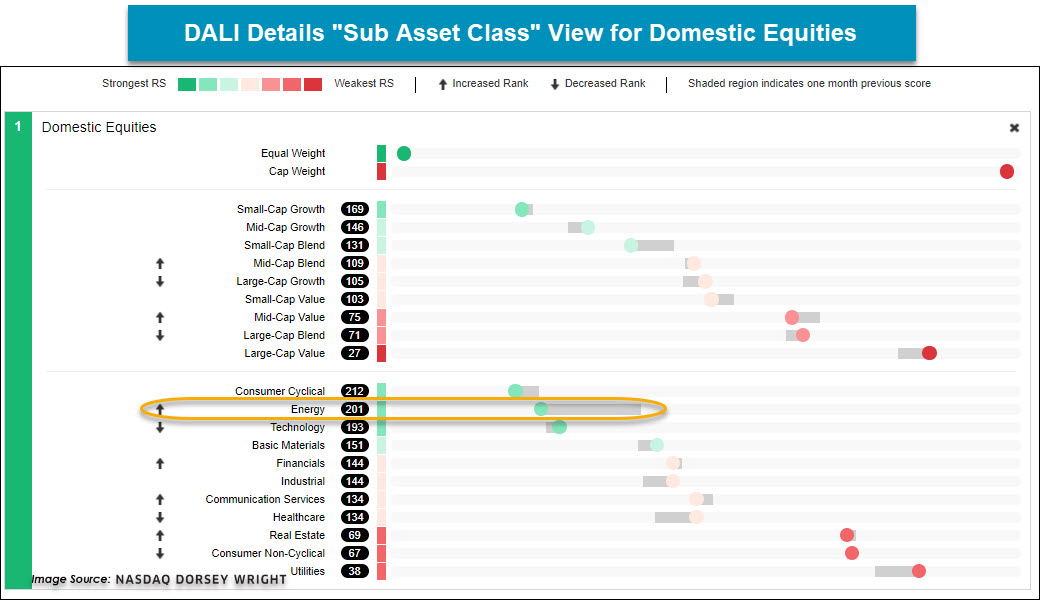
There have been a number of notable developments within the DALI rankings over the course of the past week, so we’ll start with the broad asset class rankings. One of the big stories we have continued to watch this year has been the improvement of Commodities after moving into the third position at the end of 2020. So far this year, Commodity has added a net of 82 buy signals, bringing the tally signal count up to 242, now just nine signals away from the second-ranked asset class of International Equity. However, what is perhaps more noteworthy is the fact that the current signal count of 242 for Commodity is the highest reading we’ve seen for this asset in nearly 10 years! The last time the tally count for Commodity was this high was back in the late-2011 time period, which was a period where Crude Oil prices spent a majority of the time in the upper $80’s to lower $100’s. The improvement for Commodity over the past few months has primarily come at the expense of the more defensive asset classes, namely Fixed Income and Cash. As we have seen interest rates rise recently, that has negatively impacted bond prices and has pushed the tally reading for Fixed Income down to 251, which is the lowest reading Fixed Income has seen in nearly 10 years! So, as the Commodity asset class has emerged as a leader in this market, Fixed Income has fallen to multi-year lows in terms of the relative strength picture within DALI.

The strength in the Commodity market has also spilled over into the commodity-related equities to the extent that the Energy sector is now the number two ranked sector within the DALI sector rankings as Technology has slipped to number three. Technology would still be viewed as a leadership group, however, the move down to number three is the first time the sector has not been ranked within the top two since October 2016. So, while sectors like Energy and Consumer Discretionary have been moving up the ranking, Technology has been weakening. Again, Technology has not fallen out of what we consider to be a leadership position, but it is one that you will want to monitor exposure in for any further deterioration.

| Symbol | Name | Price | Yield | PnF Trend | RS Signal | RS Col. | Fund Score | 200 Day MA | Weekly Mom |
|---|---|---|---|---|---|---|---|---|---|
| DIA | SPDR Dow Jones Industrial Average ETF Trust | 315.39 | 1.91 | Positive | O | 2.91 | 281.91 | -10W | |
| EEM | iShares MSCI Emerging Markets ETF | 56.09 | 1.40 | Positive | Sell | O | 5.49 | 46.32 | -2W |
| EFA | iShares MSCI EAFE ETF | 76.13 | 2.14 | Positive | Sell | O | 3.06 | 66.58 | -10W |
| FM | iShares MSCI Frontier 100 ETF | 29.31 | 2.80 | Positive | Sell | O | 1.11 | 26.16 | -3W |
| IJH | iShares S&P MidCap 400 Index Fund | 252.66 | 1.26 | Positive | Buy | O | 4.42 | 202.35 | -5W |
| IJR | iShares S&P SmallCap 600 Index Fund | 106.03 | 1.05 | Positive | Buy | X | 4.46 | 79.24 | -3W |
| QQQ | Invesco QQQ Trust | 321.48 | 0.55 | Positive | Buy | X | 4.56 | 280.93 | -1W |
| RSP | Invesco S&P 500 Equal Weight ETF | 136.19 | 1.65 | Positive | Buy | X | 4.36 | 114.30 | -10W |
| SPY | SPDR S&P 500 ETF Trust | 387.50 | 1.54 | Positive | O | 3.15 | 342.70 | -1W | |
| XLG | Invesco S&P 500 Top 50 ETF | 292.76 | 1.26 | Positive | O | 4.21 | 263.56 | -1W |
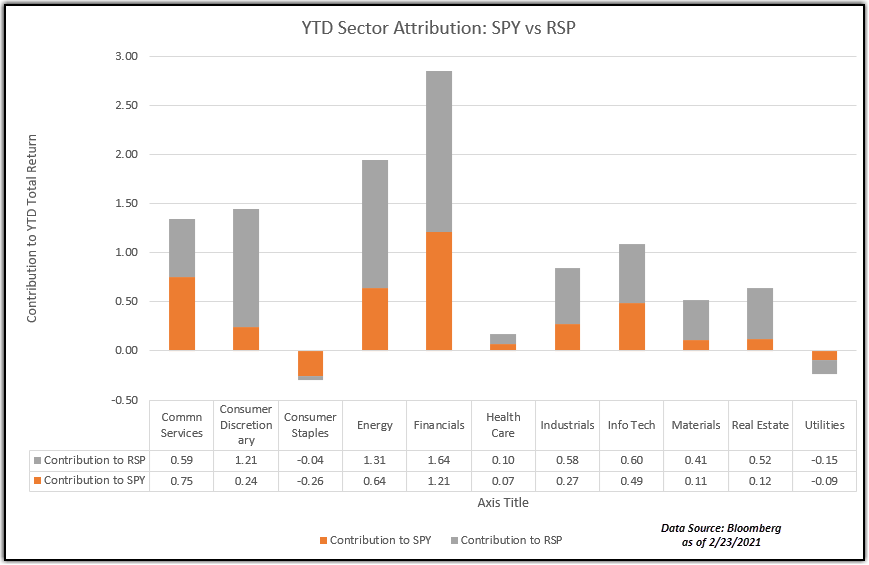
Over the last week of action, the Invesco S&P 500 Equal Weight ETF RSP was the only major market fund to finish in positive territory with a 7-day gain of 0.58%. This upward price action has carried over to today’s trading session where RSP has added a new X at the $138 level, marking a new all-time high for the equal-weight proxy. Furthermore, RSP has given a total of four consecutive buy signals with the last occurring earlier this month at $134, signaling that demand is in control. Despite yesterday’s elevated volatility, RSP posted a daily gain of 0.27% and is now up over 6.7% for the year through 2/23, a year-to-date gain that is outperforming the cap-weighted SPY’s by a margin of 314bps. Although these two funds own the exact same 500 stocks and both sit at all-time highs, the equal-weighting methodology has enabled RSP to take advantage of the high-flying names outside of the large and mega caps stocks that drive the majority of the S&P 500 cap-weighted index. While we haven’t seen those large and mega-cap names such as Amazon AMZN and Apple AAPL deteriorate significantly enough to change their overall technical outlook, we have seen them stall out performance-wise after a stellar 2020 when compared to their small and mid-cap counterparts. From a sector attribution standpoint between RSP and SPY, we find that the major difference in YTD performance between the two funds comes from the consumer discretionary sector which has added 1.21% to RSP’s total return versus adding just 0.24% to that of SPY. The energy sector is another big differentiator as it has accounted for 1.31% of RSP’s total return so far this year while it has only accounted for 0.64% of SPY’s. Additionally, communication services and utilities are the only two sectors that have contributed more to SPY’s total return versus that of RSP. Financials is the highest contributing sector in both SPY and RSP as it has added 1.21% and 1.64%, respectively, on a total return basis. Overall, the weight of the evidence is positive for RSP. Initial support sits at $126, with additional support available at $106.
SECTOR BULLISH PERCENT CHANGES
| Reversed to X | Reversed to O |
|---|---|
| 1 (BPBANK | 86), |
24 (BPAUTO | 62), (BPBIOM | 44), (BPBUIL | 74), (BPBUSI | 70), (BPCHEM | 74), (BPCOMP | 52), (BPDRUG | 50), (BPELEC | 66), (BPFINA | 66), (BPFOOD | 62), (BPHEAL | 54), (BPHOUS | 62), (BPINET | 50), (BPMACH | 70), (BPMEDI | 74), (BPMETA | 72), (BPPREC | 46), (BPPROT | 52), (BPREST | 76), (BPRETA | 56), (BPSEMI | 56), (BPSOFT | 44), (BPWALL | 48), (BPWAST | 60), |
| To Xs | To Os |
|---|
Average Level
64.45
| Sector |
|---|
| None |
| Sector |
|---|
| None |
| Sector |
|---|
| Autos & Parts (62%) - Bear Confirmed |
| Building (74%) - Bull Confirmed |
| Business Products (70%) - Bull Confirmed |
| Chemicals (74%) - Bull Confirmed |
| Computers (52%) - Bear Confirmed |
| Drugs (50%) - Bull Correction |
| Electronics (66%) - Bear Confirmed |
| Finance (66%) - Bear Alert |
| Foods Beverages/Soap (62%) - Bull Correction |
| Healthcare (54%) - Bear Confirmed |
| Household Goods (62%) - Bear Confirmed |
| Internet (50%) - Bear Confirmed |
| Machinery and Tools (70%) - Bear Confirmed |
| Media (74%) - Bull Confirmed |
| Metals Non Ferrous (72%) - Bull Confirmed |
| Protection Safety Eq (52%) - Bear Confirmed |
| Restaurants (76%) - Bull Confirmed |
| Retailing (56%) - Bear Confirmed |
| Semiconductors (56%) - Bear Confirmed |
| Telephone (58%) - Bear Alert |
| Waste Management (60%) - Bull Correction |
SECTOR INDICATOR CHART CHANGES
PT is the percentage of stocks within a sector that are trading above their bullish support lines. RSX is the percentage of stocks within a sector whose relative strength charts are in a column of Xs. RSP is the percentage of stocks within a sector whose relative strength charts are on a buy signal. The strongest sectors, i.e. market leaders, will have most of these indicators positive and moving higher in a column of Xs.
|
There were mostly PT charts rising this week, with 8 rising and 4 moving lower. The following sector charts rose: Aerospace Airline [^PTAERO], Building [^PTBUIL], Gaming [^PTGAME]-Rev. , Gas Utilities [^PTGUTI], Media [^PTMEDI], Oil Service [^PTOILS], Real Estate [^PTREAL], Steel/Iron [^PTSTEE]. The following sector charts fell: Utilities/Electricity [^PTEUTI], Software [^PTSOFT]-Rev. , Wall Street [^PTWALL]-Rev. , Waste Management [^PTWAST]-Rev. . There were 1 that reversed to X and 3 that reversed to O. |
|
| ^PT Charts Reversing Up - | ^PT Charts Reversing Down - |
|
|
| ^PT Charts Moving Higher - | ^PT Charts Moving Lower - |
|
|
|
There were mostly falling sector RSX charts this week, with 28 falling and 3 rising. The following sector charts rose: Gaming [^RSXGAME], Oil [^RSXOIL], Savings & Loans [^RSXSAVI]. The following sector charts fell: Aerospace Airline [^RSXAERO], Autos and Parts [^RSXAUTO]-Rev. , Biomedics/Genetics [^RSXBIOM]-Rev. , Business Products [^RSXBUSI]-Rev. , Chemicals [^RSXCHEM]-Rev. , Computers [^RSXCOMP]-Rev. , Drugs [^RSXDRUG]-Rev. , Electronics [^RSXELEC]-Rev. , Utilities/Electricity [^RSXEUTI], Finance [^RSXFINA]-Rev. , Food Beverages/Soap [^RSXFOOD]-Rev. , Forest Prods/Paper [^RSXFORE]-Rev. , Healthcare [^RSXHEAL]-Rev. , Household Goods [^RSXHOUS], Internet [^RSXINET]-Rev. , Machinery and Tools [^RSXMACH], Media [^RSXMEDI]-Rev. , Oil Service [^RSXOILS], Precious Metals [^RSXPREC], Protection Safety Equipment [^RSXPROT], Restaurants [^RSXREST]-Rev. , Retailing [^RSXRETA], Semiconductors [^RSXSEMI]-Rev. , Software [^RSXSOFT]-Rev. , Telephone [^RSXTELE]-Rev. , Textiles/Apparel [^RSXTEXT]-Rev. , Wall Street [^RSXWALL]-Rev. , Waste Management [^RSXWAST]. There were 0 that moved to buy signals and 5 that moved to sell signals. The following were buy signals: . The following were sell signals: Biomedics/Genetics [^RSXBIOM],Utilities/Electricity [^RSXEUTI],Household Goods [^RSXHOUS],Media [^RSXMEDI],Protection Safety Equipment [^RSXPROT]. |
|
| ^RSX Charts Reversing Up - | ^RSX Charts Reversing Down - |
|
|
|
| ^RSX Charts Moving Higher - | ^RSX Charts Moving Lower - |
|
|
|
There were mostly RSP charts rising this week, with 11 rising and 2 moving lower. The following sector charts rose: Aerospace Airline [^RSPAERO], Computers [^RSPCOMP], Finance [^RSPFINA], Forest Prods/Paper [^RSPFORE], Leisure [^RSPLEIS], Metals Non Ferrous [^RSPMETA], Oil [^RSPOIL], Restaurants [^RSPREST], Steel/Iron [^RSPSTEE], Telephone [^RSPTELE], Textiles/Apparel [^RSPTEXT]. The following sector charts fell: Utilities/Electricity [^RSPEUTI], Protection Safety Equipment [^RSPPROT]-Rev. . There were 1 that reversed to O. |
|
| ^RSP Charts Reversing Up - | ^RSP Charts Reversing Down - |
|
|
|
| ^RSP Charts Moving Higher - | ^RSP Charts Moving Lower - |
|
|
FAVORED SECTOR STATUS CHANGES
A sector is considered to be Favored if it has 3 or 4 of the sector indicators (Relative Strength, RSX, RSP, & PT) positive, Average if it has 2 of the 4 indicators positive, & Unfavored if it has 0 or 1 of the indicators positive. The table below contains those sectors that have experienced a Favored Sector Status change over the past week. It is best to focus on sectors that are about 50% or lower on their Bullish Percent charts & are in Xs. Note: If a sector moves from Favored to Average, it doesn't necessarily mean that the sector in question has to be sold - it just means you need to evaluate your individual positions with exposure to that sector.
| Changes since 02/17/2021 | Full Report |
|
|
|
|
|||||||||||
|
|
|
|
|
|
|||||||||
|
|
|
|
|
|||||||||
|
|
|
|
|
|
|||||||||

The broad international equity space remained relatively steady with the market volatility in domestic equity markets over the past few days, with the iShares MSCI ACWI ex US ETF ACWX actually advancing 0.20% in trading Tuesday. Emerging markets saw a bit more movement, with EEM reversing down into a column of Os from overbought territory, while the broad developed market representative EFA remained steady in a column of X's. Although international equities have not shown that much movement to the downside, the asset class has shown some weakening in relative strength over the past few days in the DALI asset class breakdown to now only be sitting nine buy signals ahead of commodities. This is not due to the technical deterioration of international equities, but rather the technical improvement from the broader commodities space, as that asset class has picked up 20 buy signals since last Friday alone. Much of this stems from the price appreciation of Crude Oil CL/, which broke a second consecutive double top at $63 in trading Monday. The combination of a cold winter harming domestic crude oil production as well as the continued positive expectations surrounding potential increases in travel has boded well for crude oil, which sits atop the 21 representatives in our Continuous Commodity Matrix rankings.
In order to see which countries may be more or less affected by crude oil prices, we ran correlations on each of the 43 NDW country indices compared with CL/ over a 36-month trailing timeframe ending February 23. The results of these comparisons can be found below, along with some observations.

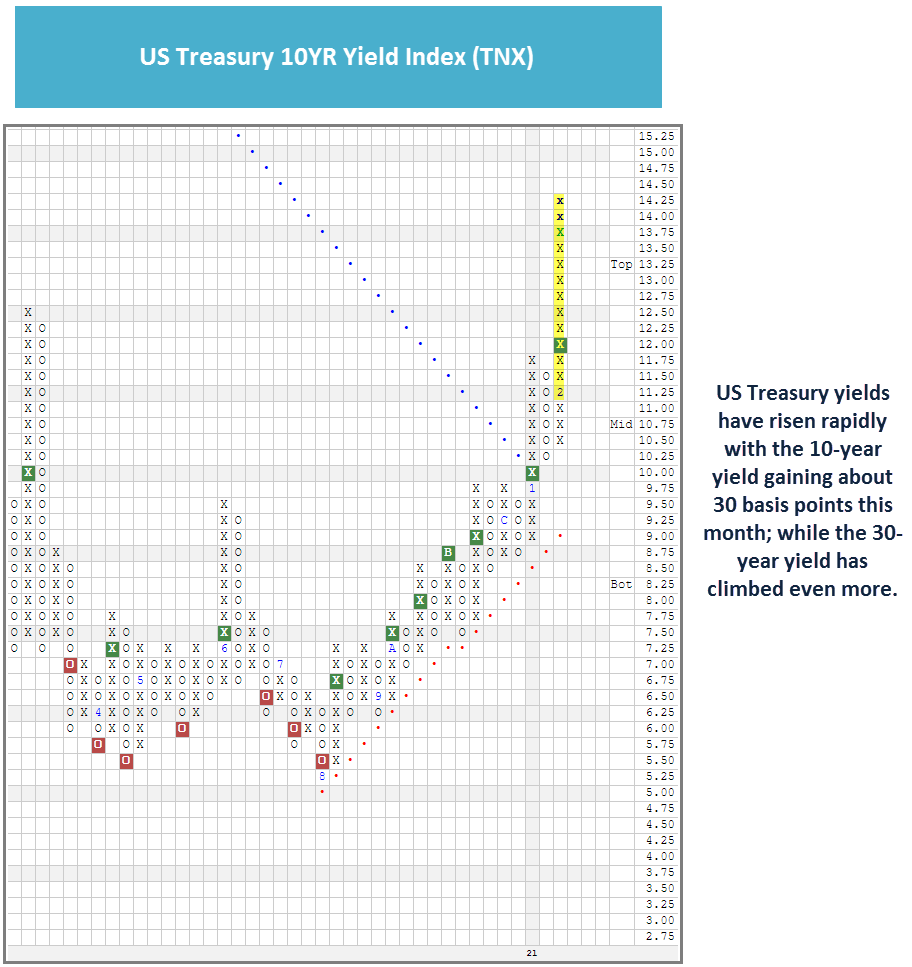
Little has changed in terms of the overall trend in the fixed income market. US Treasury yields have continued to rise and have done so with notable speed. Rising yields have weakened several segments of the fixed income market like investment-grade bonds and Treasuries.
Remember, these are technical comments only. Just as you must be aware of fundamental data for the stocks we recommend based on technical criteria in the report, so too must you be aware of important data regarding delivery, market moving government releases, and other factors that may influence commodity pricing. We try to limit our technical comments to the most actively traded contracts in advance of delivery, but some contracts trade actively right up to delivery while others taper off well in advance. Be sure you check your dates before trading these contracts. For questions regarding this section or additional coverage of commodities email james.west@dorseywright.com.
Data represented in the table below is through 2/23/2021:
Broad Market Commodities Report
| Symbol | Name | Price | PnF Trend | RS Signal | RS Col. | 200 Day MA | Weekly Mom |
|---|---|---|---|---|---|---|---|
| CL/ | Crude Oil Continuous | 61.67 | Positive | Buy | X | 42.86 | +4W |
| DBLCIX | Deutsche Bank Liquid Commodities Index | 354.67 | Positive | Sell | O | 282.02 | +4W |
| DWACOMMOD | DWA Continuous Commodity Index | 660.88 | Positive | Buy | O | 525.14 | -209W |
| GC/ | Gold Continuous | 1805.90 | Negative | Buy | O | 1859.93 | -6W |
| HG/ | Copper Continuous | 4.18 | Positive | Buy | X | 3.09 | +2W |
| ZG/ | Corn (Electronic Day Session) Continuous | 553.75 | Positive | Buy | X | 394.94 | -3W |
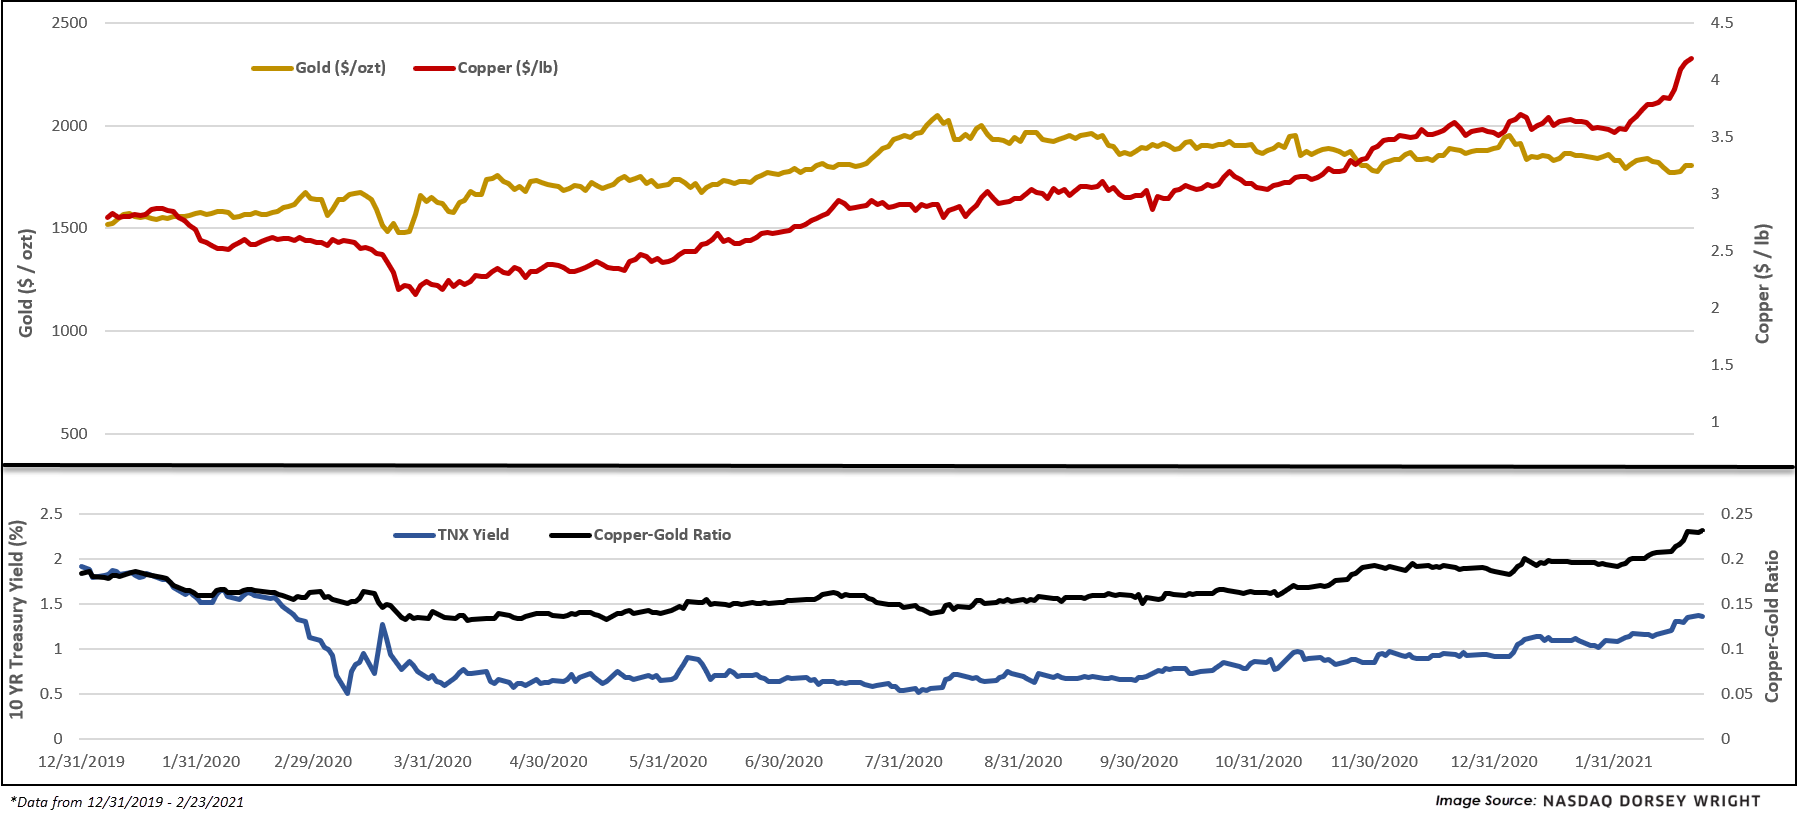
Copper reached its highest level since 2011 this week, climbing over $9,000 per metric ton. The seemingly sustained surge in price for the bellwether industrial metal is attributed to a variety of things, a couple being: expectations for tightening supply as the world continues to reopen after the coronavirus pandemic (especially from China as of late) and bets on increased spending on renewable energy/electric-vehicle infrastructure (of which require large amounts of raw materials). The prior list is certainly not exhaustive, evidenced by the chart of copper (HG/) where investors are seeming to find countless tailwinds for the commodity going forward, pushing the base metal’s YTD return to nearly 19% (as of 2/23).
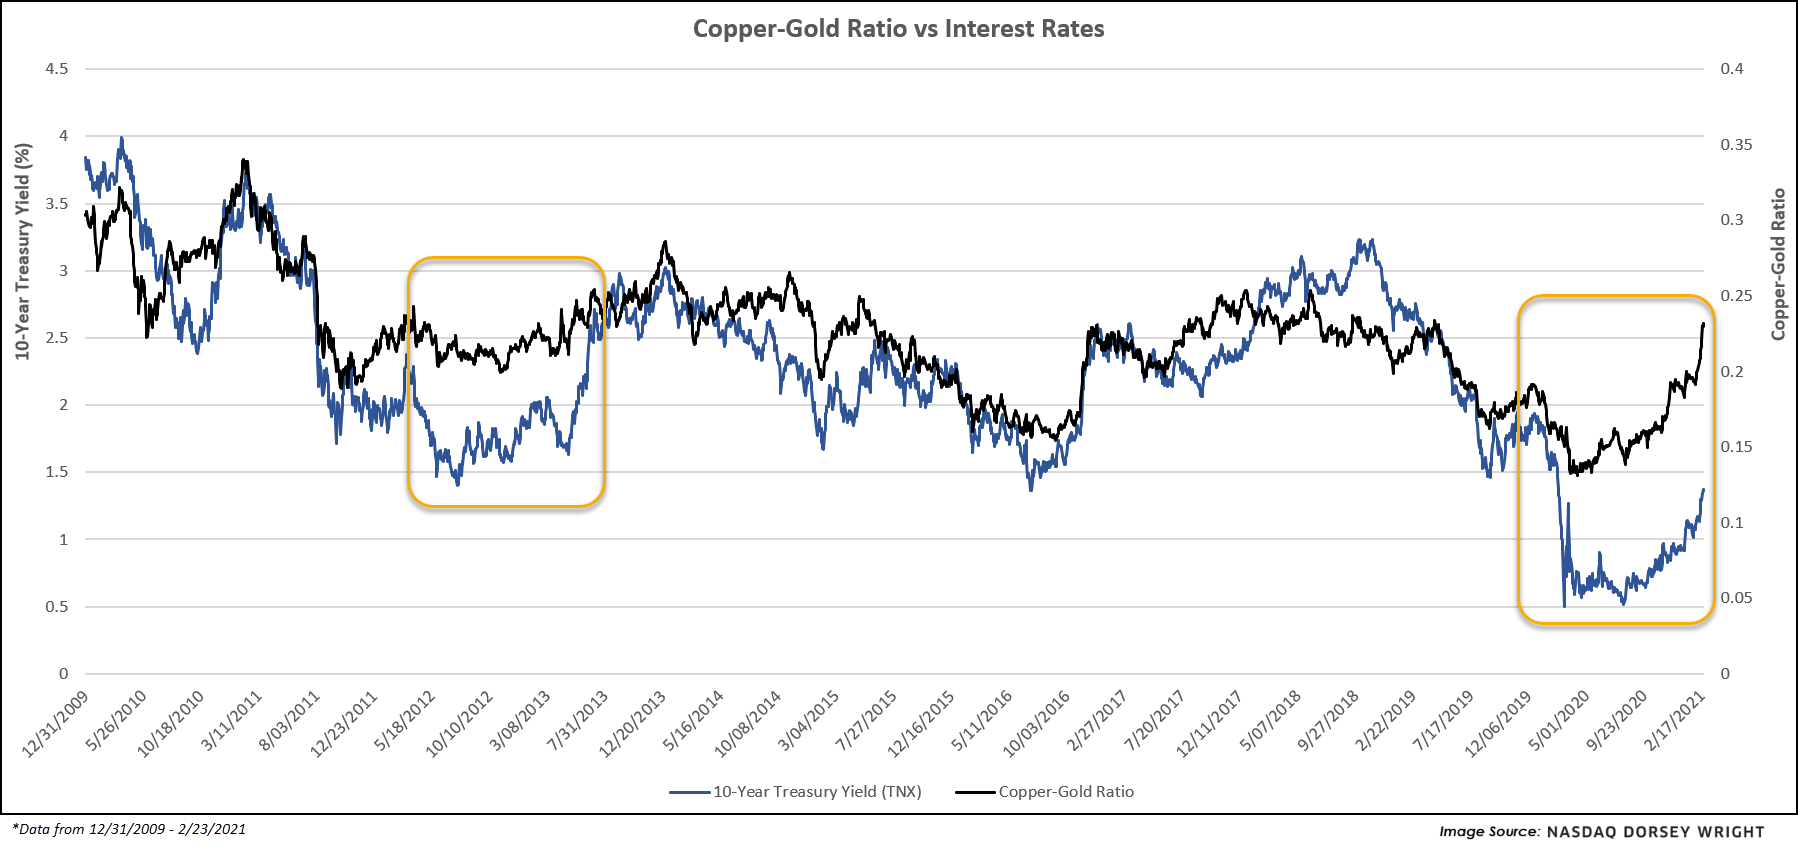
Dr. Copper’s strength is further highlighted in the copper-gold ratio, which compares the price per pound of copper to the price per troy ounce of gold. The absolute value derived from this simple calculation is irrelevant, but the direction of this relationship can be very useful – just like individual relative strength values are useless in and of themselves until aggregating and plotting their trends over time. The direction of the copper-gold ratio is useful because gold, being one of the most recognized safe-haven assets among investors, tends to perform well during times of economic hardship while copper tends to do quite the opposite, performing best during periods of economic expansion (or at least leading up to such). A rising ratio can thus tell us expectations for global economic health are on the rise, and vice versa. However, perhaps of greater interest, the copper-gold ratio tends to correlate with interest rates over longer periods of time, as shown below. That said, the current dislocation/spread can help us think through a few possible scenarios and even frame several viable scenarios, being – copper cools off, gold rebounds, or interest rates continue sharply higher (all of these could become true in some fashion). It is worth noting that copper is heavily overbought through trading yesterday, posting an OBOS% value north of 150% while gold is relatively oversold with an OBOS% value of -30%, perhaps adding some loose probabilities to the formerly mentioned scenarios.
Average Level
20.66
| AGG | iShares US Core Bond ETF |
| USO | United States Oil Fund |
| DIA | SPDR Dow Jones Industrial Average ETF |
| DVY | iShares Dow Jones Select Dividend Index ETF |
| DX/Y | NYCE U.S.Dollar Index Spot |
| EFA | iShares MSCI EAFE ETF |
| FXE | Invesco CurrencyShares Euro Trust |
| GLD | SPDR Gold Trust |
| GSG | iShares S&P GSCI Commodity-Indexed Trust |
| HYG | iShares iBoxx $ High Yield Corporate Bond ETF |
| ICF | iShares Cohen & Steers Realty ETF |
| IEF | iShares Barclays 7-10 Yr. Tres. Bond ETF |
| LQD | iShares iBoxx $ Investment Grade Corp. Bond ETF |
| IJH | iShares S&P 400 MidCap Index Fund |
| ONEQ | Fidelity Nasdaq Composite Index Track |
| QQQ | Invesco QQQ Trust |
| RSP | Invesco S&P 500 Equal Weight ETF |
| IWM | iShares Russell 2000 Index ETF |
| SHY | iShares Barclays 1-3 Year Tres. Bond ETF |
| IJR | iShares S&P 600 SmallCap Index Fund |
| SPY | SPDR S&P 500 Index ETF Trust |
| TLT | iShares Barclays 20+ Year Treasury Bond ETF |
| GCC | WisdomTree Continuous Commodity Index Fund |
| VOOG | Vanguard S&P 500 Growth ETF |
| VOOV | Vanguard S&P 500 Value ETF |
| EEM | iShares MSCI Emerging Markets ETF |
| XLG | Invesco S&P 500 Top 50 ETF |
Relative strength is a measure of how a stock is performing when compared to something else, in this case the S&P 500 Equal Weighted Index (SPXEWI). Each day the stock's closing price is divided by that of the SPXEWI, the resulting numbers decimal is moved two places and then plotted on a Point & Figure chart. Whenever the relative strength chart shows a double top buy signal (e.g. RS Buy or Positive Relative Strength), it suggests the stock is likely to outperform the market for the foreseeable future. Conversely, whenever the relative strength chart gives a double bottom sell signal (e.g. RS Sell or Negative Relative Strength) it suggests the stock will under-perform the market. Relative strength signals tend to last roughly 18 to 24 months on average. Consequently, changes from buy signals to sell signals (and vice versa) are important to be aware of as they are longer-term implications of a stock's likely performance versus the indices. Using the Point & Figure chart along with the relative strength chart will allow you to better ascertain risk-reward and other trade management tools, but we always want to over-weight our portfolios toward those stocks that are on RS buy signals, giving us the best chance of outperforming the broader market.
In the Optionable Universe, this week we saw 50 relative strength buy signals compared to 41 last week. On the sell side, there were 36 relative strength sell signals compared to 15 last week.
| Symbol | Company | Sector | Price | RS vs Market Signal | RS vs Market Column | RS vs Peer Signal | RS vs Peer Column | Tech Attrib |
|---|---|---|---|---|---|---|---|---|
| ALK | Alaska Air Group Inc | Cyclical Goods and Services | 66.520 | Buy | X | Sell | X | 4 |
| TFC | Truist Financial Corp | Banks | 58.730 | Buy | X | Buy | X | 5 |
| BOKF | BOK Financial Corporation | Banks | 88.250 | Buy | X | Sell | X | 4 |
| CAT | Caterpillar, Inc. | Industrial Goods & Svcs | 220.180 | Buy | X | Sell | X | 3 |
| TCF | TCF Financial Corporation | Banks | 45.980 | Buy | X | Buy | X | 5 |
| CRS | Carpenter Technology Corporation | Basic Resources | 42.470 | Buy | X | Sell | X | 4 |
| CSWC | Capital Southwest Corporation | Financial Services | 21.970 | Buy | X | Sell | X | 4 |
| CTB | Cooper Tire & Rubber Company | Automobiles | 57.860 | Buy | X | Buy | X | 5 |
| DLX | Deluxe Corporation | Industrial Goods & Svcs | 42.000 | Buy | X | Buy | X | 5 |
| EPR | EPR Properties | Equity REITs | 46.510 | Buy | X | Sell | X | 4 |
| EXP | Eagle Materials, Inc. | Construction | 125.180 | Buy | X | Sell | X | 3 |
| FBNC | First Bancorp North Carolina | Banks | 40.820 | Buy | X | Buy | X | 5 |
| HA | Hawaiian Holdings, Inc. | Cyclical Goods and Services | 26.640 | Buy | X | Sell | X | 4 |
| DIN | DineEquity, Inc. | Cyclical Goods and Services | 78.790 | Buy | X | Buy | X | 4 |
| DISCK | Discovery Communications Inc. 'C' | Media | 44.140 | Buy | X | Buy | X | 5 |
| CDXC | Chromadex Corp. | Media | 9.540 | Buy | X | Buy | X | 5 |
| CSOD | Cornerstone Ondemand | Software | 52.850 | Buy | X | Sell | X | 4 |
| HMST | Homestreet Inc | Banks | 44.010 | Buy | X | Buy | X | 4 |
| JBLU | JetBlue Airways Corporation | Cyclical Goods and Services | 19.150 | Buy | X | Sell | X | 3 |
| MRO | Marathon Oil Corporation | Oil Companies Major | 11.160 | Buy | X | Buy | X | 4 |
| PSEC | Prospect Capital Corporation | Financial Services | 7.440 | Buy | X | Sell | X | 4 |
| PXD | Pioneer Natural Resources | Oil Companies Secondary | 145.240 | Buy | X | Buy | X | 5 |
| PEB | Pebblebrook Hotel Trust | Equity REITs | 22.700 | Buy | X | Buy | X | 5 |
| MPC | Marathon Petroleum Corp. | Oil Companies Major | 55.770 | Buy | X | Buy | X | 5 |
| RAVN | Raven Industries Inc | Industrial Goods & Svcs | 40.480 | Buy | X | Sell | X | 4 |
| RRC | Range Resources Corp | Oil Companies Secondary | 10.430 | Buy | X | Buy | X | 5 |
| VNDA | Vanda Pharmaceuticals Inc. | Pharmaceuticals | 18.690 | Buy | X | Sell | X | 4 |
| VET | Vermilion Energy Inc | Oil Companies Major | 6.060 | Buy | X | Sell | X | 3 |
| VAC | Marriott Vacations Worldwide Corporation | Cyclical Goods and Services | 164.690 | Buy | X | Sell | X | 4 |
| FNHC | FedNat Holding Co | Insurance | 7.080 | Buy | X | Sell | X | 3 |
| FPRX | Five Prime Therapeutics, Inc. | Biotechnology | 23.430 | Buy | X | Buy | X | 5 |
| AAL | American Airlines Group Inc. | Cyclical Goods and Services | 20.660 | Buy | X | Sell | X | 4 |
| BRX | Brixmor Property Group Inc | Equity REITs | 20.100 | Buy | X | Buy | X | 5 |
| TPCO | Tribune Publishing Co | Media | 16.990 | Buy | X | Buy | X | 5 |
| UE | Urban Edge Properties | Equity REITs | 16.970 | Buy | X | Buy | X | 5 |
| XHR | Xenia Hotels and Resorts Inc. | Cyclical Goods and Services | 19.490 | Buy | X | Sell | X | 4 |
| PVAC | Penn Virginia Corp. | Oil Companies Major | 14.580 | Buy | X | Sell | X | 4 |
| ARD | Ardagh Group SA | Industrial Goods & Svcs | 24.000 | Buy | X | N/A | X | 4 |
| EQH | Equitable Holdings Inc | Insurance | 29.050 | Buy | X | Buy | X | 5 |
| GSKY | GreenSky, Inc. Class A | Industrial Goods & Svcs | 5.530 | Buy | O | Sell | O | 3 |
| JBLU.TR | JetBlue Airways Corporation TR | Cyclical Goods and Services | 19.150 | Buy | X | Sell | X | 3 |
| CTB.TR | Cooper Tire & Rubber Company TR | Automobiles | 59.134 | Buy | X | Buy | X | 5 |
| JCI.TR | Johnson Controls International PLC TR | Industrial Goods & Svcs | 58.378 | Buy | X | Buy | X | 5 |
| MRO.TR | Marathon Oil Corporation TR | Oil Companies Major | 11.405 | Buy | X | Buy | X | 5 |
| RRC.TR | Range Resources Corp TR | Oil Companies Secondary | 10.526 | Buy | X | Buy | X | 5 |
| PEB.TR | Pebblebrook Hotel Trust TR | Equity REITs | 22.769 | Buy | X | Buy | X | 5 |
| TWO.TR | Two Harbors Investment Corporation TR | Financial Services | 7.703 | Buy | X | Buy | X | 4 |
| XHR.TR | Xenia Hotels and Resorts Inc. TR | Cyclical Goods and Services | 20.019 | Buy | X | Sell | X | 4 |
| SLQT | SelectQuote Inc | Insurance | 29.940 | Buy | X | Sell | X | 4 |
| AIRO | Airspan Networks Inc. | Communications Technology | 14.000 | Buy | O | N/A | O |
| Symbol | Company | Sector | Price | RS vs Market Signal | RS vs Market Column | RS vs Peer Signal | RS vs Peer Column | Tech Attrib |
|---|---|---|---|---|---|---|---|---|
| CMS | CMS Energy Corporation | Electric Utilities | 55.690 | Sell | O | Buy | O | 1 |
| CVM | Cel-Sci Corp | Biotechnology | 18.060 | Sell | O | Sell | O | 1 |
| DGX | Quest Diagnostics Incorporated | Healthcare Providers | 117.490 | Sell | O | Sell | O | 1 |
| EBIX | ebix.com Inc. | Software | 23.200 | Sell | O | Buy | O | 1 |
| ECL | Ecolab Inc. | Chemicals | 211.160 | Sell | O | Sell | O | 1 |
| EFX | Equifax Inc. | Industrial Goods & Svcs | 171.870 | Sell | O | Sell | O | 1 |
| HSIC | Henry Schein, Inc. | Medical Products | 65.620 | Sell | O | Sell | O | 0 |
| BSQR | BSQUARE Corporation | Software | 5.250 | Sell | O | Buy | O | 2 |
| ISIG | Insignia Systems Inc | Software | 7.080 | Sell | O | Sell | O | 0 |
| MBT | Mobile Telesystems (Russia) ADR | Wireless Communications | 8.490 | Sell | O | Sell | O | 0 |
| PHI | Philippine Long Distance Telephone (Philippines) ADR | Fixed Line Communications | 26.780 | Sell | O | Sell | O | 1 |
| LL | Lumber Liquidators Holdings Inc | Construction | 25.800 | Sell | O | Sell | O | 1 |
| LUMO | Lumos Pharma Inc | Biotechnology | 14.970 | Sell | O | Sell | O | 0 |
| QDEL | Quidel Corporation | Medical Products | 167.420 | Sell | O | Sell | O | 0 |
| SGMO | Sangamo Therapeutics Inc. | Biotechnology | 12.330 | Sell | O | Sell | O | 0 |
| SJW | SJW Group | Water Utilities | 66.550 | Sell | O | Sell | O | 1 |
| ONVO | Organovo Holdings, Inc. | Biotechnology | 11.300 | Sell | O | Sell | O | 0 |
| SRNE | Sorrento Therapeutics, Inc. | Biotechnology | 11.005 | Sell | O | Sell | O | 1 |
| GRUB | Grubhub Inc. | Technology Services | 65.830 | Sell | O | Sell | O | 0 |
| BLNK | Blink Charging Co | Automobiles | 38.790 | Sell | O | Sell | O | 1 |
| WPG | Washington Prime Group Inc. | Equity REITs | 6.640 | Sell | O | Sell | O | 0 |
| SUNW | Sunworks Inc. | Industrial Goods & Svcs | 11.590 | Sell | O | Buy | O | 2 |
| SYRS | Syros Pharmaceuticals Inc | Biotechnology | 9.180 | Sell | O | Sell | O | 0 |
| AQUA | Evoqua Water Technologies Corp | Water Utilities | 24.570 | Sell | O | Buy | O | 2 |
| EIX.TR | Edison International TR | Electric Utilities | 63.108 | Sell | O | Buy | O | 1 |
| SVMK | SVMK, Inc. | Technology Services | 19.290 | Sell | O | Sell | O | 1 |
| WMT.TR | Wal-Mart Stores Inc. TR | Retail | 139.030 | Sell | O | Sell | O | 1 |
| MCD.TR | McDonald s Corporation TR | Cyclical Goods and Services | 220.711 | Sell | O | Buy | O | 2 |
| FSLY | Fastly, Inc. Class A | Technology Services | 77.910 | Sell | O | Sell | O | 0 |
| DGX.TR | Quest Diagnostics Incorporated TR | Healthcare Providers | 121.294 | Sell | O | Sell | O | 0 |
| AQUA.TR | Evoqua Water Technologies Corp (TR) | Water Utilities | 24.570 | Sell | O | Buy | O | 2 |
| CONE.TR | CyrusOne Inc TR | Equity REITs | 67.627 | Sell | O | Sell | O | 0 |
| CSR.TR | Centerspace TR | Equity REITs | 74.043 | Sell | O | Buy | O | 1 |
| LI | Li Auto, Inc. Sponsored ADR Class A | Automobiles | 26.990 | Sell | O | Buy | O | 1 |
| CLOV | Clover Health Investments Corp. | Healthcare Providers | 10.130 | Sell | O | Sell | O | 0 |
| TPGY | TPG Pace Beneficial Finance Corporation Class A | Financial Services | 21.190 | Sell | O | Sell | O | 1 |
| Symbol | Company | Sector | Current Price | Action Price | Target | Stop | Notes |
|---|---|---|---|---|---|---|---|
| NYT | The New York Times Company | Media | $52.57 | low-to-mid 50s | 83 | 47 | 4 for 5'er, favored MEDI sector, LT pos mkt RS, triple top, pullback from ATH, pos monthly mom flip |
| NSC | Norfolk Southern Corporation | Transports/Non Air | $257.89 | high 230s to low 260s | 316 | 196 | 5 for 5'er, pullback from ATH, LT market RS buy signal, pos trend |
| HON | Honeywell International, Inc. | Aerospace Airline | $205.04 | 198 - 220 | 270 | 162 | 4 for 5'er, pullback from ATH, fav DWAAERO, consec buy signals, LT market RS buy |
| HCA | HCA Healthcare Inc. | Healthcare | $175.07 | 170s - low 180s | 222 | 142 | 4 for 5'er, top half of favored HEAL sector matrix, LT pos mkt RS, pullback from ATH, 1.1% yield, pot. cov. write |
| ADTN | ADTRAN, Inc. | Telephone | $16.38 | 16 - 18 | 25 | 13.50 | 5 for 5'er, top 25% of TELE sector matrix, multiple buy signals, pullback from multi-year high, 2.2% yield, R-R>3.0 |
| MDC | M.D.C. Holdings, Inc. | Building | $57.43 | mid-to-upper 50s | 85 | 46 | 4 for 5'er, favored BUIL sector matrix, pullback from multi-year high, 2.4% yield, pot. cov write, R-R>2.0 |
| EVR | Evercore Inc. | Finance | $121.39 | mid 110s - mid 120s | 172 | 102 | 4 for 5'er, 8th of 70 names in favored FINA sector matrix, pullback from ATH, 2% yield |
| CENX | Century Aluminum Co | Metals Non Ferrous | $13.71 | 14 - 16 | 26.50 | 11.50 | 5 for 5'er, top 20% of favored META sector matrix, pos wkly & mnthly mom flips, R-R>3.0 |
| CSX | CSX Corporation | Transports/Non Air | $91.69 | high 80s to mid 90s | 106 | 75 | 4 for 5'er, LT market & Peer RS buy, pos trend, pullback from ATH, pos weekly mom flip |
| CCJ | Cameco Corporation | Metals Non Ferrous | $16.02 | 15 - 17 | 25.50 | 13 | 5 for 5'er, top quartile of favored META sector matrix. pos wkly mom flip, R-R~3.0 |
| Symbol | Company | Sector | Current Price | Action Price | Target | Stop | Notes |
|---|
| Symbol | Company | Sector | Current Price | Action Price | Target | Stop | Notes |
|---|---|---|---|---|---|---|---|
| BPOP | Popular, Inc. | Banks | $66.65 | low-to-mid 60s | 76 | 54 | See follow up comment below. |
| Comment |
|---|
| VRSK Verisk Analytics, Inc. R ($169.71) - Business Products - VRSK hit our $168 stop in Wednesday's trading. |
| Z Zillow Group Inc. Class C R ($163.64) - Real Estate - Z hit our $160 stop yesterday. In today's trading the stock reversed up, offering a potential exit opportunity for any with open long exposure. |
| CMI Cummins Inc. R ($258.86) - Machinery and Tools - We will now raise our stop to $212, which would take out multiple levels of support on CM's default chart. |
| MLM Martin Marietta Materials In R ($346.84) - Building - We will now raise our stop to $280, the third potential sell signal on MLM's default chart. |
| PWR Quanta Services, Inc. R ($80.95) - Electronics - We will now raise our stop to $69, the third potential sell signal on PWR's default chart. |
| EAT Brinker International Inc R ($73.12) - Restaurants - We will now raise our stop to $63, the second potential sell signal on EAT's default chart. |
| LB L Brands Inc. R ($51.93) - Retailing - With no support between $48 and $37, we will raise our stop to $47, the first potential sell signal on LB's default chart. |
| CAKE The Cheesecake Factory Incorporated R ($55.64) - Restaurants - We will now raise our stop to $47, the second potential sell signal on CAKE's default chart. |
| HIBB Hibbett Sports, Inc. R ($67.44) - Retailing - We will now raise our stop to $60, the first potential sell signal on HIBB's default chart. |
| BPOP Popular, Inc. R ($69.17) - Banks - BPOP had moved above the actionable range. OK to hold here. raise stop to $56, the first potential sell signal on BPOP's default chart. |
CCJ Cameco Corporation R ($16.16) - Metals Non Ferrous - CCJ is a 5 for 5'er that ranks in the top quartile of the favored metals non ferrous sector matrix. On its default chart, CCJ has given four consecutive buy signals and pulled back slightly from a multi-year high in trading earlier this week. A recent flip to positive weekly momentum is a positive sign for CCJ's prospects for additional upside. Long exposure may be added in the $15-$17 range. We will set our stop at $13, the first potential sell signal on CCJ's default chart, which combined with the bullish price objective of $25.50, gives a reward-to-risk ratio of about 3.0.
| 15 | 16 | 17 | 18 | 19 | 20 | 21 | |||||||||||||||||||||||||||||||||||||||||||||||
| 20.00 | O | • | 20.00 | ||||||||||||||||||||||||||||||||||||||||||||||||||
| 19.50 | O | X | • | 19.50 | |||||||||||||||||||||||||||||||||||||||||||||||||
| 19.00 | 8 | X | O | • | 19.00 | ||||||||||||||||||||||||||||||||||||||||||||||||
| 18.50 | 9 | X | O | • | 18.50 | ||||||||||||||||||||||||||||||||||||||||||||||||
| 18.00 | O | B | C | • | Top | 18.00 | |||||||||||||||||||||||||||||||||||||||||||||||
| 17.50 | O | X | O | X | • | 17.50 | |||||||||||||||||||||||||||||||||||||||||||||||
| 17.00 | A | X | O | X | O | • | X | 17.00 | |||||||||||||||||||||||||||||||||||||||||||||
| 16.50 | O | X | O | X | X | O | • | X | O | 16.50 | |||||||||||||||||||||||||||||||||||||||||||
| 16.00 | O | O | X | O | X | X | 5 | • | X | O | 16.00 | ||||||||||||||||||||||||||||||||||||||||||
| 15.50 | O | X | O | 2 | O | 4 | O | • | X | O | 15.50 | ||||||||||||||||||||||||||||||||||||||||||
| 15.00 | O | 1 | X | O | X | O | • | X | X | 15.00 | |||||||||||||||||||||||||||||||||||||||||||
| 14.50 | O | X | 3 | X | 6 | 8 | 9 | X | • | 1 | X | O | X | 14.50 | |||||||||||||||||||||||||||||||||||||||
| 14.00 | O | O | 7 | X | O | X | O | X | O | • | • | X | O | 2 | O | X | Mid | 14.00 | |||||||||||||||||||||||||||||||||||
| 13.50 | O | X | O | X | O | A | O | • | X | X | • | • | • | • | X | O | X | O | 13.50 | ||||||||||||||||||||||||||||||||||
| 13.00 | O | O | X | O | X | B | X | O | X | O | X | • | X | • | X | • | X | O | X | 13.00 | |||||||||||||||||||||||||||||||||
| 12.50 | O | O | X | O | 2 | 3 | O | X | O | X | O | X | O | • | X | 2 | O | • | X | O | 12.50 | ||||||||||||||||||||||||||||||||
| 12.00 | O | O | X | O | X | 4 | 5 | X | O | X | O | X | • | 6 | A | B | O | X | O | • | X | X | 12.00 | ||||||||||||||||||||||||||||||
| 11.50 | C | X | O | X | • | O | X | O | X | 2 | X | O | • | X | O | X | O | X | O | X | 3 | • | 7 | O | X | 11.50 | |||||||||||||||||||||||||||
| 11.00 | 1 | X | O | X | • | 6 | 1 | O | O | X | O | • | X | 5 | O | X | O | X | C | • | 4 | • | X | O | C | 11.00 | |||||||||||||||||||||||||||
| 10.50 | O | O | • | O | X | O | 4 | 7 | C | O | X | 7 | X | O | • | • | 5 | 5 | O | X | 10.50 | ||||||||||||||||||||||||||||||||
| 10.00 | • | 7 | X | O | X | O | X | O | 4 | 9 | X | • | O | B | X | 9 | X | Bot | 10.00 | ||||||||||||||||||||||||||||||||||
| 9.50 | O | C | O | X | O | B | O | X | O | • | 7 | X | O | X | X | A | 9.50 | ||||||||||||||||||||||||||||||||||||
| 9.00 | 9 | B | 6 | A | X | 1 | X | • | O | X | O | X | O | X | • | 9.00 | |||||||||||||||||||||||||||||||||||||
| 8.50 | O | X | O | X | 2 | • | 8 | 1 | X | O | X | • | 8.50 | ||||||||||||||||||||||||||||||||||||||||
| 8.00 | A | X | O | • | • | 2 | O | 4 | • | 8.00 | |||||||||||||||||||||||||||||||||||||||||||
| 7.50 | O | • | 3 | X | • | 7.50 | |||||||||||||||||||||||||||||||||||||||||||||||
| 7.00 | O | X | • | 7.00 | |||||||||||||||||||||||||||||||||||||||||||||||||
| 6.50 | O | X | • | 6.50 | |||||||||||||||||||||||||||||||||||||||||||||||||
| 6.00 | O | X | • | 6.00 | |||||||||||||||||||||||||||||||||||||||||||||||||
| 5.50 | O | • | 5.50 | ||||||||||||||||||||||||||||||||||||||||||||||||||
| 15 | 16 | 17 | 18 | 19 | 20 | 21 |
| AAL American Airlines Group Inc. ($21.82) - Aerospace Airline - AAL broke a triple top at $22, marking the stock’s fifth consecutive buy signal. AAL is a 4 for 5’er within the favored aerospace airline sector that ranks 11th out of 44 names in the sector stock matrix. From here, support sits at $19. |
| AEO American Eagle Outfitters, Inc. ($26.71) - Retailing - AEO broke a double top at $26, marking a new 52 week high as well as the fourth consecutive buy signal. AEO is a perfect 5 for 5’er within the favored retailing sector hat expects earnings on 3/3. Support sits at $22. |
| APA Apache Corporation ($20.81) - Oil - APA gave a second consecutive buy signal when it completed a bullish catapult in Wednesday's trading. APA's technical picture has improved in recent days as the stock is now a favorable 3 for 5'er; it also ranks in the top third of the oil sector matrix. Those interested in adding exposure should note that today's move puts APA in heavily overbought territory. |
| CADE Cadence Bancorporation Class A ($21.68) - Banks - CADE shares moved higher today to break a double top at $22 to mark its fifth consecutive buy signal. This 4 for 5'er has been in a positive trend since November and on an RS buy signal versus the market since May. Recent price action has put CADE into heavily overbought territory, so those wishing to initiate a position may be best served to scale in at current levels. From here, support is offered at $18. Note that CADE offers a 2.82% yield. |
| CE Celanese Corporation ($141.21) - Chemicals - CE returned to a buy signal in Wednesday's trading with a double top break at $142. The weight of the evidence is positive for CE as it is a 3 for 5'er trading in a positive trend. However, it ranks in the bottom half of the chemicals sector matrix, so those looking for exposure to sector may be able to find a stronger name. CE also carries a 2% yield. |
| FANG Diamondback Energy Inc ($73.80) - Oil - FANG returned to a buy signal in Wednesday's trading when it broke a double top at $73. FANG's outlook is positive a is it is a 4 for 5'er that ranks in the top quintile of the favored oil sector matrix. However, potential longs should note that today's move puts the stock in heavily overbought territory. FAN carries a 2.25% yield. |
| GPI Group 1 Automotive, Inc. ($157.67) - Autos and Parts - GPI broke a double top at $152 on Wednesday before moving higher to $158. GPI is a strong 4 for 5’er within the favored autos and parts sector that has maintained a long-term peer RS buy signal since May 2019. From here, support sits at $142 while GPI faces resistance at $160. |
| ITRI Itron Inc ($115.28) - Electronics - ITRI moved higher after its earnings release Wednesday to break a double top at $108 before reaching a new all-time high at $118 intraday. This 3 for 5'er moved to a positive trend in October and ranks in the top half of the favored electronics sector RS matrix. While the weight of the evidence is positive here, those looking to add exposure may be best served to wait for a pullback or normalization of the trading band as the stock has now entered overbought territory. Initial support can be found at $95. |
| LAD Lithia Motors Inc-Cl A ($387.15) - Autos and Parts - LAD returned to a buy signal at $384 before moving higher to $388. This stock is a 4 for 5’er within the autos and parts sector that has maintained a long-term market and peer RS buy signal since April 2019. Monthly momentum just flipped positive, suggesting the potential for higher prices. From here, support sits at $348. |
| LYV Live Nation Entertainment Inc. ($90.49) - Leisure - LYV broke a double top at $92, marking a new all-time high on the chart a day ahead of expected earnings. This stock is a 3 for 5’er within the favored leisure sector that has maintained a long-term market RS buy signal since June 2013. Weekly momentum has been positive for three weeks, suggesting the potential for higher prices. From here, support sits at $87. Note LYV is heavily overbought at current levels. |
| MKSI MKS Instrument, Inc. ($176.60) - Electronics - MKSI moved higher Wednesday to complete a bullish triangle at $172 before moving to $176 intraday. This 3 for 5'er moved to a positive trend in April and ranks in the top half of the favored electronics sector RS matrix. The weight of the technical evidence is positive here. Initial support can be found at $162, with further support offered at $158 and $148. |
| MS Morgan Stanley ($79.88) - Wall Street - MS shares moved higher to break a double top at $78 and continued higher to $80 to mark its third consecutive buy signal. This 5 for 5'er has been in a positive trend since May and on an RS buy signal versus the market since June of 2013. MS is actionable at current levels with a weekly overbought/oversold reading of 55%. From here, support is offered at $67. |
| MTN Vail Resorts Inc ($319.72) - Leisure - MTN broke a double top at $316 before moving higher to $320, marking a new all-time high on the chart. MTN is a perfect 5 for 5’er within the favored leisure sector that has maintained a long-term market RS buy signal since March 2015. Furthermore, MTN is trading well above the bullish support line. From here, support sits at $300. Earnings are expected on 3/11. |
| PAYX Paychex, Inc. ($93.36) - Business Products - PAYX advanced Wednesday to break a second consecutive double top at $93. This 3 for 5'er moved to a positive trend in April and saw weekly momentum recently flip positive, suggesting the potential for further upside from here. The overall weight of the evidence is positive here and improving. Exposure may be considered at current levels, with initial support offered at $88. Further support can be found at $87 and $86 with the bullish support line currently found at $85. Note that PAYX also carries a 2.74% yield. |
| PII Polaris Inc. ($126.11) - Leisure - PII is a perfect 5 for 5’er within the favored leisure sector that completed a bullish triangle pattern today with a double top buy signal at $126. From here, support sits at $116 while PII faces overhead resistance at $128. |
| STX Seagate Technology ($74.34) - Computers - Shares of STX pushed higher Wednesday to complete a bullish triangle at $75 before reaching $76 intraday. This 3 for 5'er moved to a positive trend in October and ranks in the top third of the favored computers sector RS matrix. The stock has also maintained an RS buy signal against the market since early-2017. Weekly and monthly momentum are each positive, which suggests the potential for further upside from here. Those looking to add exposure may consider STX on this breakout, with initial support offered at $71. Further support can be found at $66. Note that the stock also carries a 3.65% yield. |
| TDG TransDigm Group, Inc. ($609.15) - Aerospace Airline - Shares of TDG climbed higher on Wednesday, breaking a sextuple top at $624, returning the stock to a buy signal after an elongated period of consolidation. The 4 for 5'er resides in the now favored aerospace airline sector and demonstrates favorable long-term relative strength versus the market, remaining on an RS buy signal since November of 2008. In addition, weekly momentum recently flipped to positive, furthering the positive technical picture. Demand is in control and TDG is actionable at current levels. Initial support is offered at around $568. |
| THC Tenet Healthcare Corporation ($52.85) - Healthcare - THC shares moved higher today to break a double top at $53 to mark its sixth consecutive buy signal. This 5 for 5'er has been in a positive trend and on an RS buy signal versus the market since July. THC is actionable at current levels with a weekly overbought/oversold reading of 48%. From here, support is offred at $49. |
| UAL United Airlines Holdings Inc. ($54.96) - Aerospace Airline - UAL broke a spread triple top at $52 before moving higher to $55. UAL is a 2 for 5’er within the aerospace airline sector that has experienced two weeks of positive weekly momentum. From here, support sits at $47. |
| Name | Option Symbol | Action | Stop Loss |
|---|---|---|---|
| General Motors - $52.90 | GM2118F50 | Buy the June 50.00 calls at 6.95 | 48.00 |
| Name | Option | Action |
|---|---|---|
| Weyerhaeuser Company ( WY) | Apr. 30.00 Calls | Raise the option stop loss to 3.80 (CP: 5.80) |
| Exxon Mobil Corporation ( XOM) | Jun. 42.50 Calls | Raise the option stop loss to 12.70 (CP: 14.70) |
| Freeport-McMoRan Inc. ( FCX) | May. 25.00 Calls | Raise the option stop loss to 11.35 (CP: 13.35) |
| Morgan Stanley ( MS) | Apr. 65.00 Calls | Raise the option stop loss to 13.95 (CP: 15.95) |
| J.P. Morgan Chase & Co. ( JPM) | Jun. 135.00 Calls | Raise the option stop loss to 19.40 (CP: 21.40) |
| Bank of America ( BAC) | Jun. 30.00 Calls | Initiate an option stop loss of 4.80 (CP: 6.80) |
| Name | Option Symbol | Action | Stop Loss |
|---|---|---|---|
| Dominion Energy Inc. - $71.17 | D2116S72.5 | Buy the July 72.50 puts at 5.60 | 75.00 |
| Name | Option | Action |
|---|---|---|
|
|
||
| Name | Option Sym. | Call to Sell | Call Price | Investment for 500 Shares | Annual Called Rtn. | Annual Static Rtn. | Downside Protection |
|---|---|---|---|---|---|---|---|
| Alcoa Inc. $24.90 | AA2116G30 | Jul. 30.00 | 3.00 | $12,251.00 | 54.82% | 28.30% | 9.92% |
| Name | Action |
|---|---|
| Cree Research Inc (CREE) - 117.92 | Sell the June 125.00 Calls. |
| FireEye, Inc (FEYE) - 19.92 | Sell the June 25.00 Calls. |
| Synchrony Financial (SYF) - 38.48 | Sell the June 40.00 Calls. |
| Micron Technology, Inc. (MU) - 88.23 | Sell the May 90.00 Calls. |
| General Motors (GM) - 51.11 | Sell the June 55.00 Calls. |
| Taiwan Semiconductor Manufacturing Co. (Taiwan) ADR (TSM) - 129.10 | Sell the July 140.00 Calls. |
| Devon Energy Corporation (DVN) - 21.59 | Sell the July 23.00 Calls. |
| Name | Covered Write |
|---|---|
| Cimarex Energy Co. ( XEC - 57.02 ) | June 55.00 covered write. |
| Vale S.A., (Brazil) ADR ( VALE - 17.90 ) | April 18.00 covered write. |
Daily Equity & Market Analysis
Loading, Please Wait...
