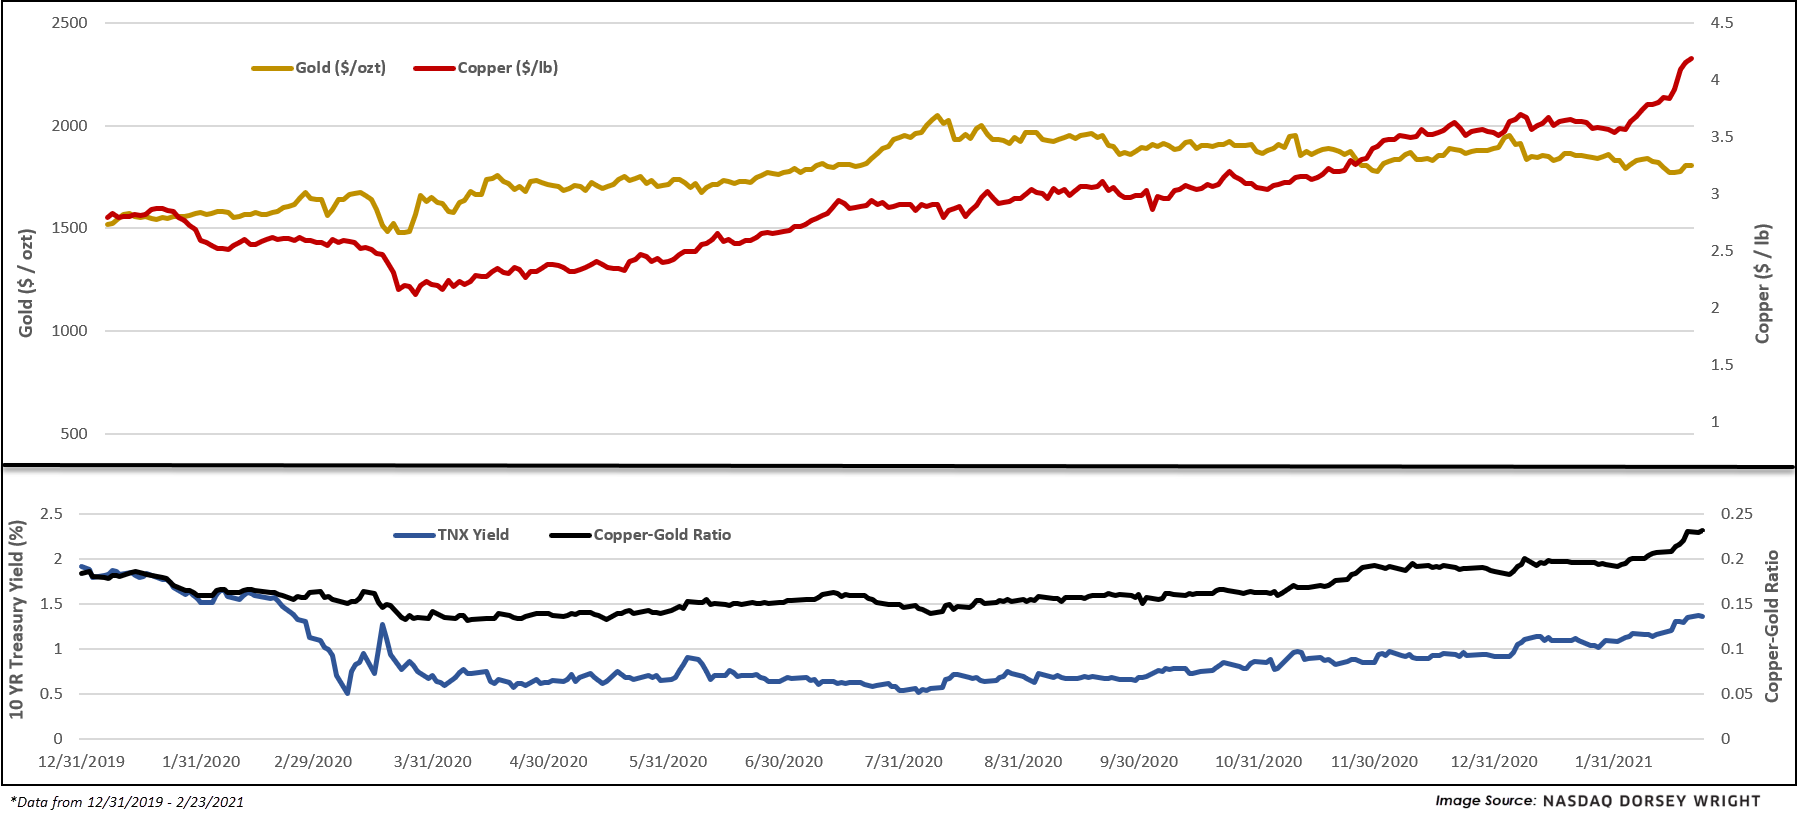
Copper is trading at a nine-year high. The copper-gold ratio, historically correlated to interest rates, is also aggressively climbing.
Remember, these are technical comments only. Just as you must be aware of fundamental data for the stocks we recommend based on technical criteria in the report, so too must you be aware of important data regarding delivery, market moving government releases, and other factors that may influence commodity pricing. We try to limit our technical comments to the most actively traded contracts in advance of delivery, but some contracts trade actively right up to delivery while others taper off well in advance. Be sure you check your dates before trading these contracts. For questions regarding this section or additional coverage of commodities email james.west@dorseywright.com.
Data represented in the table below is through 2/23/2021:
Broad Market Commodities Report
Portfolio View - Commodity Indices
| Symbol | Name | Price | PnF Trend | RS Signal | RS Col. | 200 Day MA | Weekly Mom |
|---|---|---|---|---|---|---|---|
| CL/ | Crude Oil Continuous | 61.67 | Positive | Buy | X | 42.86 | +4W |
| DBLCIX | Deutsche Bank Liquid Commodities Index | 354.67 | Positive | Sell | O | 282.02 | +4W |
| DWACOMMOD | DWA Continuous Commodity Index | 660.88 | Positive | Buy | O | 525.14 | -209W |
| GC/ | Gold Continuous | 1805.90 | Negative | Buy | O | 1859.93 | -6W |
| HG/ | Copper Continuous | 4.18 | Positive | Buy | X | 3.09 | +2W |
| ZG/ | Corn (Electronic Day Session) Continuous | 553.75 | Positive | Buy | X | 394.94 | -3W |
Copper reached its highest level since 2011 this week, climbing over $9,000 per metric ton. The seemingly sustained surge in price for the bellwether industrial metal is attributed to a variety of things, a couple being: expectations for tightening supply as the world continues to reopen after the coronavirus pandemic (especially from China as of late) and bets on increased spending on renewable energy/electric-vehicle infrastructure (of which require large amounts of raw materials). The prior list is certainly not exhaustive, evidenced by the chart of copper (HG/) where investors are seeming to find countless tailwinds for the commodity going forward, pushing the base metal’s YTD return to nearly 19% (as of 2/23).
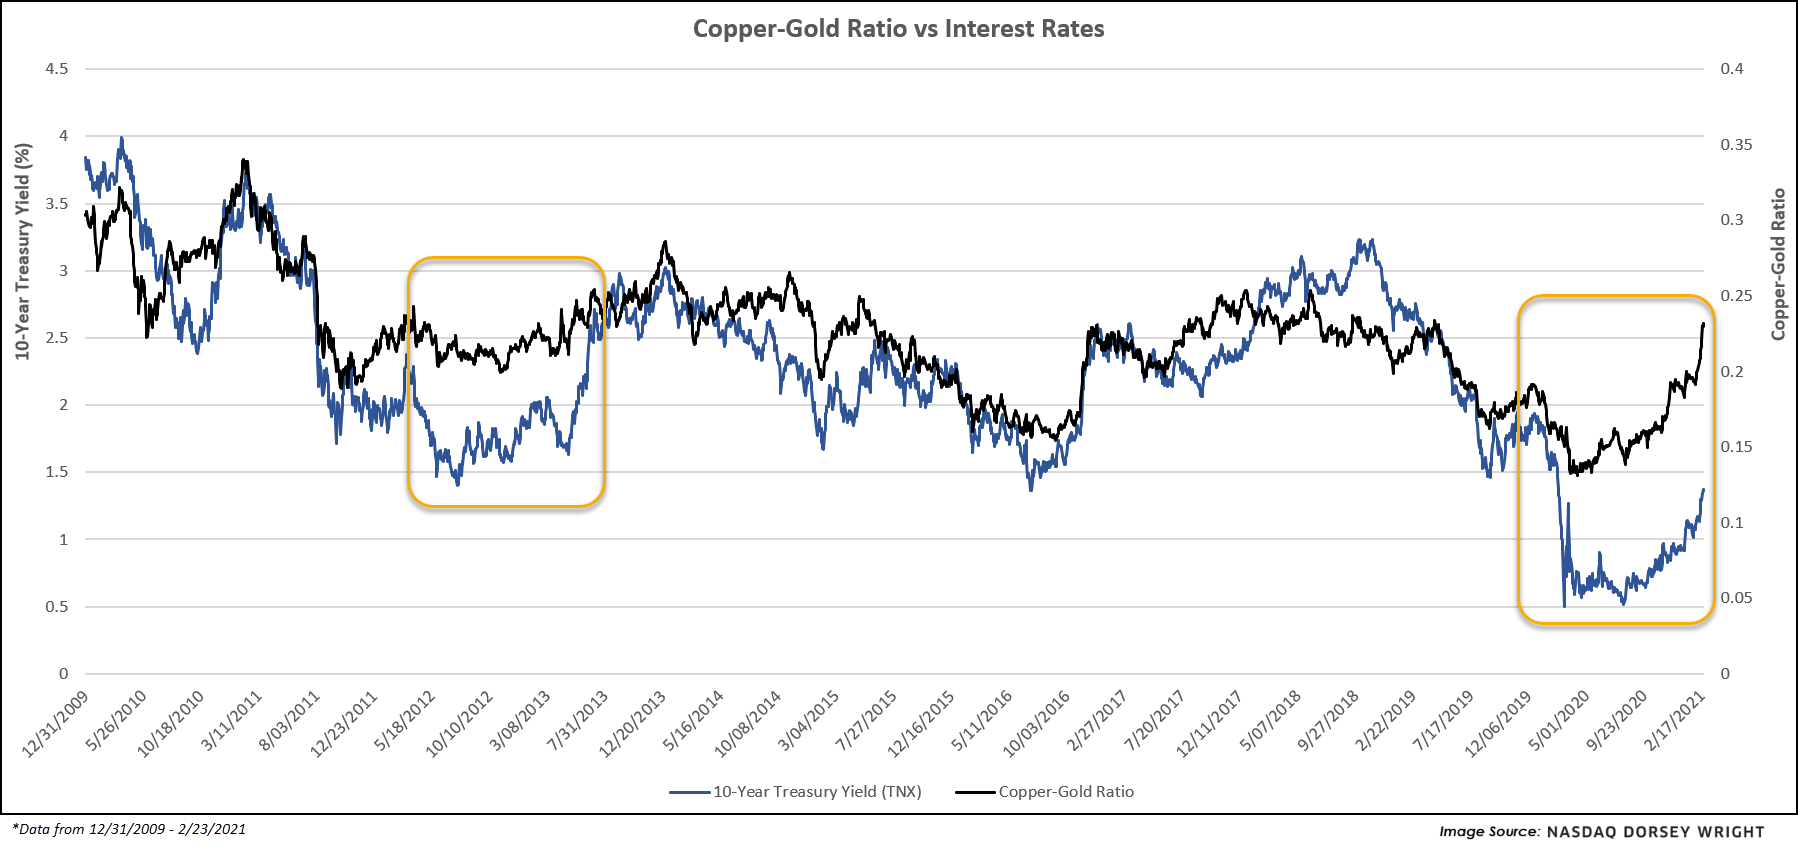
Dr. Copper’s strength is further highlighted in the copper-gold ratio, which compares the price per pound of copper to the price per troy ounce of gold. The absolute value derived from this simple calculation is irrelevant, but the direction of this relationship can be very useful – just like individual relative strength values are useless in and of themselves until aggregating and plotting their trends over time. The direction of the copper-gold ratio is useful because gold, being one of the most recognized safe-haven assets among investors, tends to perform well during times of economic hardship while copper tends to do quite the opposite, performing best during periods of economic expansion (or at least leading up to such). A rising ratio can thus tell us expectations for global economic health are on the rise, and vice versa. However, perhaps of greater interest, the copper-gold ratio tends to correlate with interest rates over longer periods of time, as shown below. That said, the current dislocation/spread can help us think through a few possible scenarios and even frame several viable scenarios, being – copper cools off, gold rebounds, or interest rates continue sharply higher (all of these could become true in some fashion). It is worth noting that copper is heavily overbought through trading yesterday, posting an OBOS% value north of 150% while gold is relatively oversold with an OBOS% value of -30%, perhaps adding some loose probabilities to the formerly mentioned scenarios.