
Most Requested Symbols

A technical update on companies with direct or indirect exposure toward bitcoin.
The average distribution reading is 23.45% overbought.
Today's featured stock is Century Aluminum Co (CENX)
AMCX, APA, ATR, BAC, BOOT, BYD, CHDN, DFS, DOW, FSLY, GES, HES, INMD, NCLH, PLAY, RL, RS, TEX, TXRH, WD & WYNN.
Call: Discover Financial Services (DFS); Put: Walmart (WMT); Covered Write: Vale S.A. (VALE).
2021 Market Outlook Webinar: The team at Nasdaq Dorsey Wright (NDW) will discuss the outlook for H1 2021 through a technical lens. Leave your emotions behind and join us for an objective look at the markets. Register Here
Topics We Will Cover:
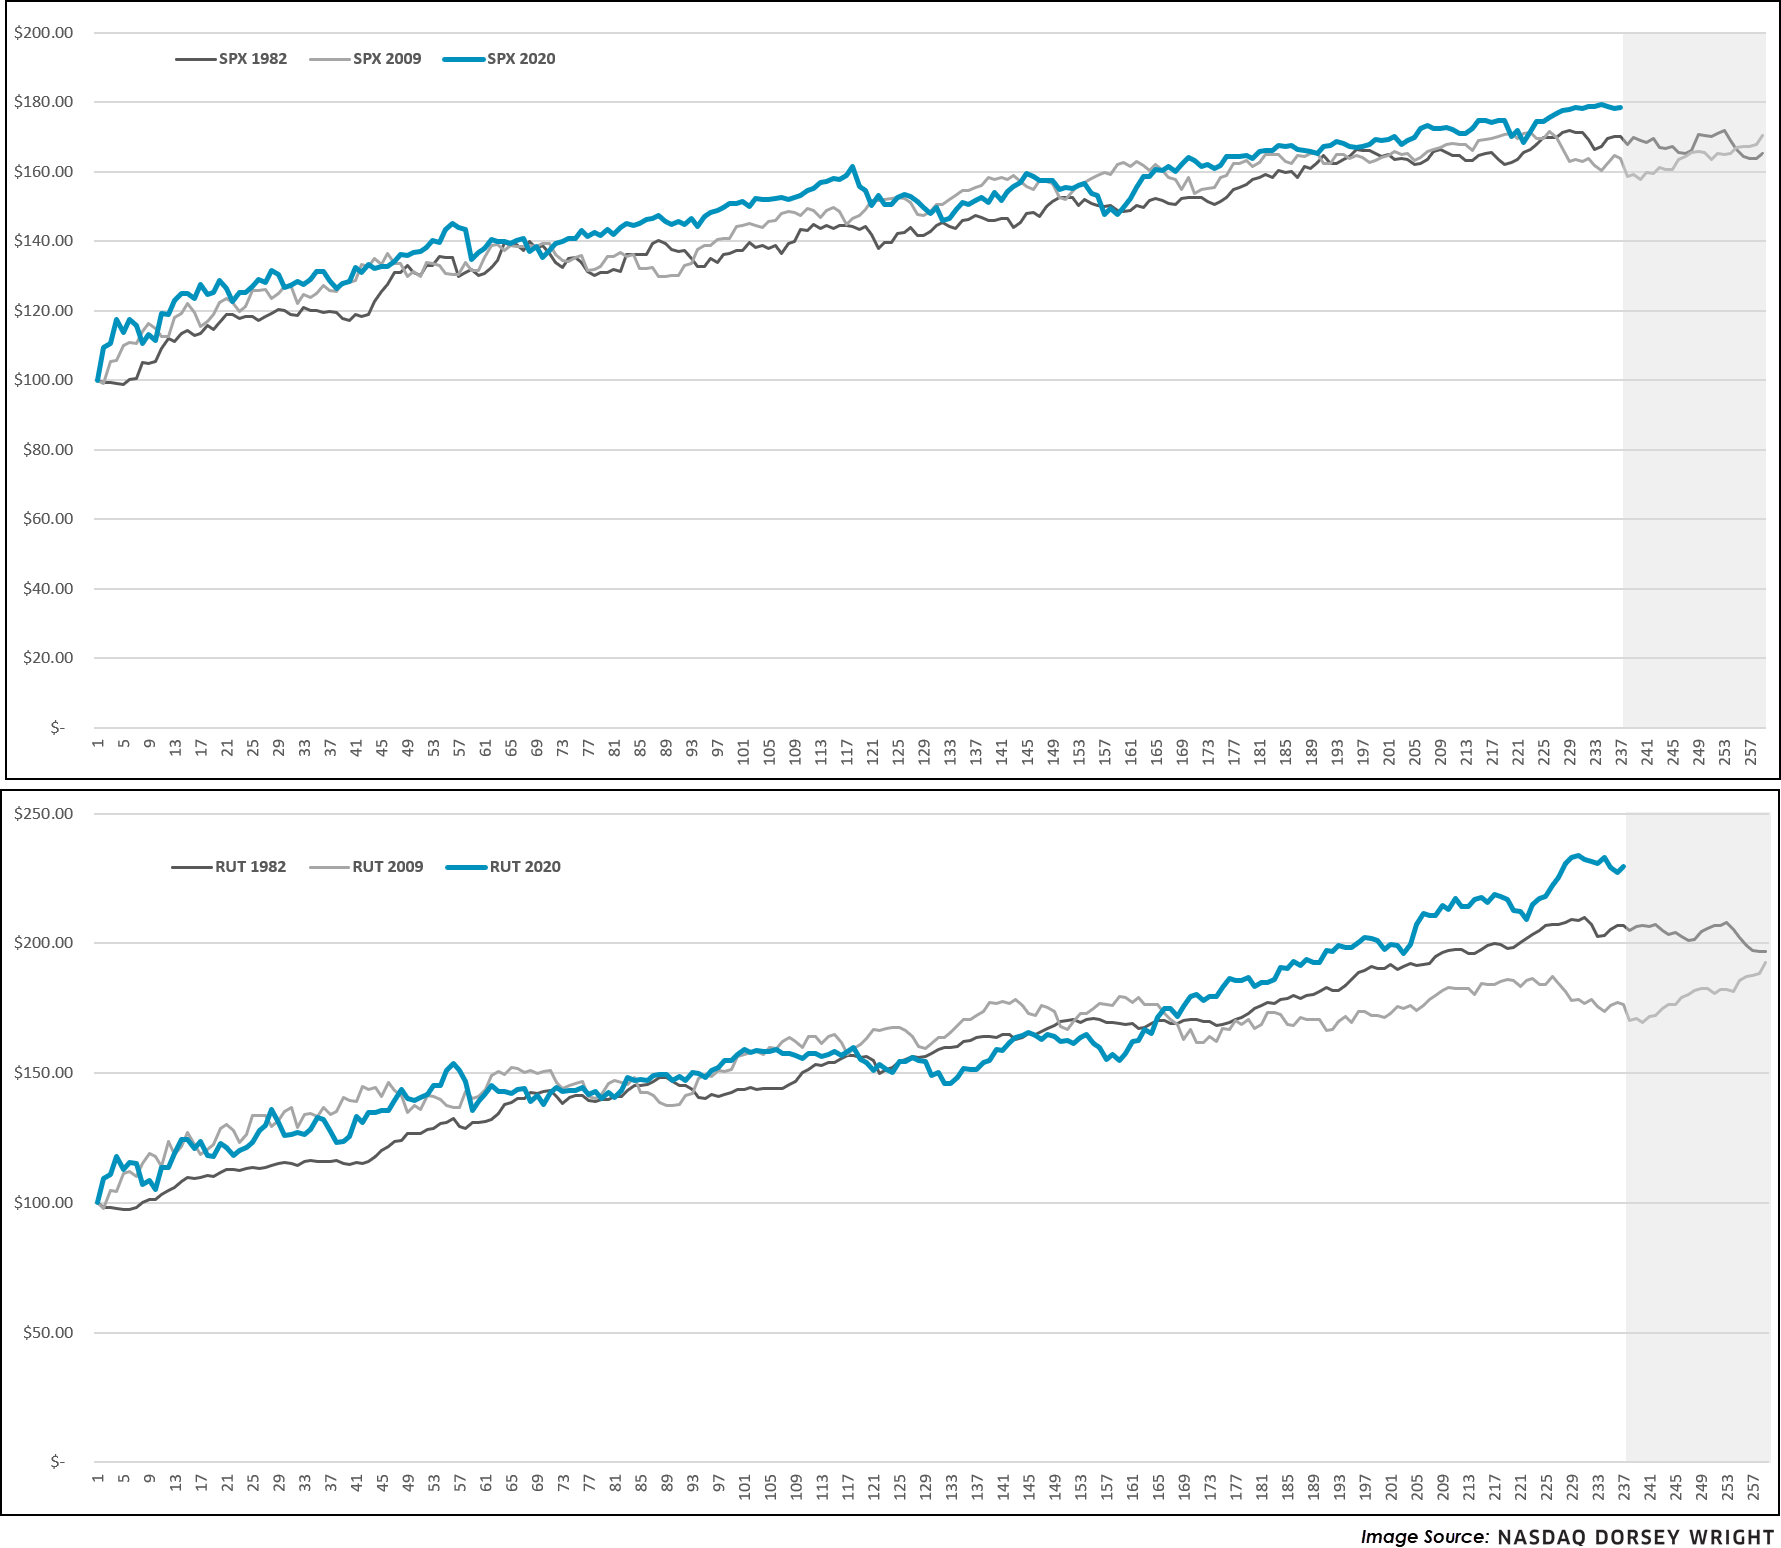
The S&P 500 fell in its fifth straight trading session on Monday (2/22), extending a muted period of returns for the popular benchmark. Although equities and other risk on asset classes remain in the driver seat, questions of market tiredness are near, and perhaps justifiably so after a historic 70% plus run from the S&P 500, 100% plus gain from the Nasdaq Composite, and 125% plus return from the Russell 2000 following the market bottom in March of last year (3/23/2020 – 2/19/2021). Recency bias in the markets can play a large role in today’s climate, so to add some further perspective on the monster returns we’ve seen it can be useful to compare historic market rebounds. Depicted below are hypothetical growth charts of $100 should someone have picked the bottom in each market, and interestingly enough, around this time (roughly 230 trading days after the bottom) both markets consolidated and traded laterally. We note a similar trend with small caps, to an even greater degree at times, but in aggregate the 2020 rebound is still considerably ahead of historic market runs. While history is most certainly not always a predictor of the future, it tell us that the current consolidation or a future pullback could be very normal, even healthy perhaps. Our indicators remain in offensive position, suggesting material pullbacks could serve as viable buying opportunities for those with extra cash on the sidelines.

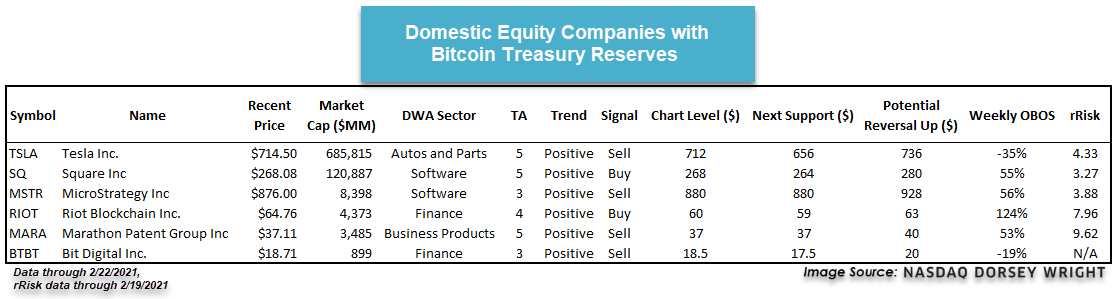
It has been hard to ignore the meteoric price appreciation of Bitcoin $BTC over the first several weeks of 2021. As we covered in last Wednesday’s report, the largest cryptocurrency by market cap crossed above $50,000 for the first time before pushing to a new record high north of $58,000 this past weekend. Although Bitcoin pulled back intraday Monday, it still has a market capitalization of more than $980 billion at the time of this writing. If bitcoin were a company, it would be the fifth-largest by market capitalization in the U.S., sitting ahead of companies such as Facebook FB and J.P. Morgan Chase & Co. JPM. Of course, bitcoin is not a publicly-traded company, and it certainly has its fair share of critics across the investment community. This has made it difficult for advisors to gain direct exposure in the leading crypto asset. However, individual companies are increasingly recognizing bitcoin as a legitimate alternative to traditional reserves, with Tesla TSLA being the most famous recent adopter after stating they invested $1.5 billion into bitcoin and will allow customers to purchase vehicles with the cryptocurrency. Other companies have aided the legitimacy of cryptocurrency without direct investment. One such company is Mastercard MA, which announced earlier this month that they would soon support crypto transactions by allowing individuals to convert cryptocurrency into traditional currency for purchasing goods (source: cnn.com). With the growing number of companies jumping on the bitcoin bandwagon, we wanted to provide a technical update on US companies with bitcoin reserves, as well as those companies looking to streamline transactions in cryptocurrencies.
According to bitcointreasuryreserve.com, there are now 19 public companies trading across global markets that have some exposure to bitcoin through their treasury reserves. Today, we are going to focus on the six domestic representatives that are found on the NDW research platform. Through trading on Friday (2/19), each of the six stocks possessed a technical attribute rating of 3 or better, and they averaged a year-to-date gain of 136%. The pullback in bitcoin and broader equity markets Monday led each name to continue lower in a column of X's, however, many of these stocks were retracting from overbought territory, potentially allowing more opportune entry points for those looking to gain exposure. It is worth keeping in mind that many of these companies see enhanced levels of volatility, as shown through the heightened relative-risk (rRisk) readings. We have provided some technical information on each name below, along with near-term support and the chart level needed for a potential reversal higher from current levels.
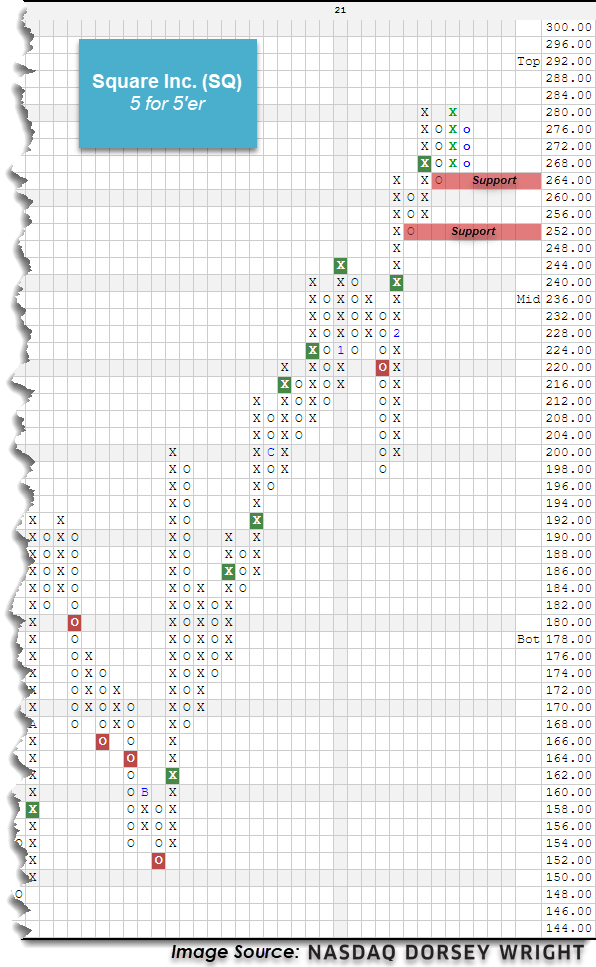
Out of the names included above Square SQ presents one of the more favorable technical pictures. This company announced in October of last year that they were investing in 4,709 bitcoins, which has grown from an initial investment of $50 million to over $250 million at the time of this writing. The stock has moved considerably higher over the last few weeks, with SQ rising to give two consecutive buy signals before forming another double top Friday at $280. This 5 for 5’er also ranks in the top quartile of the favored software sector RS matrix. Movement on Monday led SQ to pullback into a column of Os to $268, which also led to a normalization of the trading band with an intraday weekly overbought/oversold (OBOS) reading of about 62%. Those looking to add exposure may consider the stock at current levels. Initial support can be found at $264 with further support offered at $252.
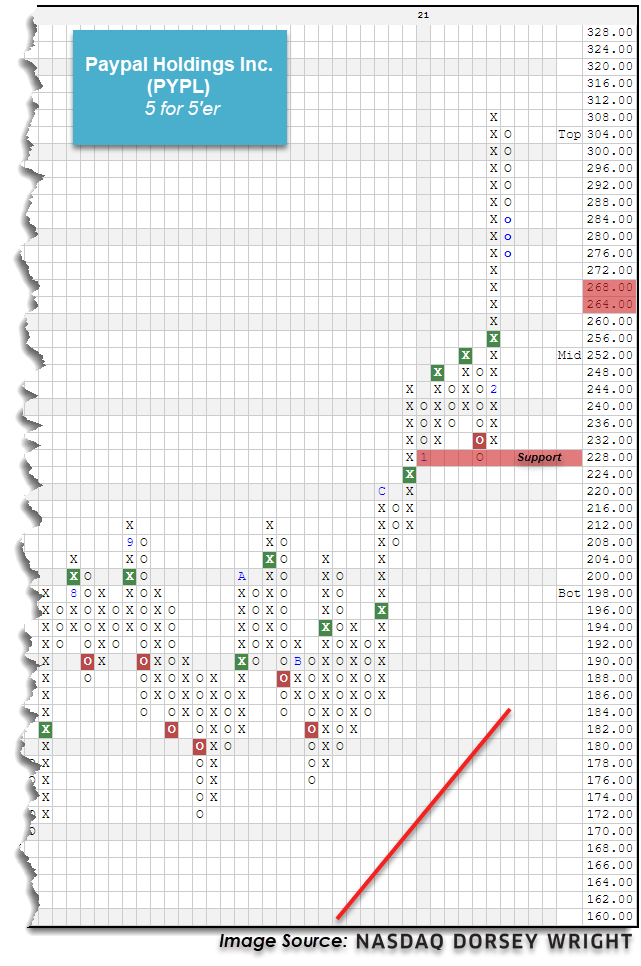
While we have seen several companies partially transition their reserves to bitcoin in the past few months, the adoption across the broader financial and banking institutions has not seen as much traction. As we mentioned earlier, MasterCard is the latest such company to announce its intent to allow transactions in bitcoin at some point in 2021. Another fintech company that has become involved in cryptocurrencies is PayPal PYPL, which is giving users the ability to buy and sell select cryptocurrencies on its platform and will also be allowing merchants to accept bitcoin as payment in the near future (source: PayPal). PYPL moved considerably higher earlier this month, as it gave a buy signal at $256 before continuing to a new all-time high at $308. The stock has since pulled back from overbought territory to a current chart level of $276 intraday Monday while maintaining a 5 out of 5 technical attribute rating. Exposure may be considered at current levels for more aggressive individuals, or upon further pullback/normalization of the trading band. Initial support is not offered on the default chart until $228, while the potential for further near-term support may be seen on the more sensitive 2-point chart at $264.
Average Level
23.45
| AGG | iShares US Core Bond ETF |
| USO | United States Oil Fund |
| DIA | SPDR Dow Jones Industrial Average ETF |
| DVY | iShares Dow Jones Select Dividend Index ETF |
| DX/Y | NYCE U.S.Dollar Index Spot |
| EFA | iShares MSCI EAFE ETF |
| FXE | Invesco CurrencyShares Euro Trust |
| GLD | SPDR Gold Trust |
| GSG | iShares S&P GSCI Commodity-Indexed Trust |
| HYG | iShares iBoxx $ High Yield Corporate Bond ETF |
| ICF | iShares Cohen & Steers Realty ETF |
| IEF | iShares Barclays 7-10 Yr. Tres. Bond ETF |
| LQD | iShares iBoxx $ Investment Grade Corp. Bond ETF |
| IJH | iShares S&P 400 MidCap Index Fund |
| ONEQ | Fidelity Nasdaq Composite Index Track |
| QQQ | Invesco QQQ Trust |
| RSP | Invesco S&P 500 Equal Weight ETF |
| IWM | iShares Russell 2000 Index ETF |
| SHY | iShares Barclays 1-3 Year Tres. Bond ETF |
| IJR | iShares S&P 600 SmallCap Index Fund |
| SPY | SPDR S&P 500 Index ETF Trust |
| TLT | iShares Barclays 20+ Year Treasury Bond ETF |
| GCC | WisdomTree Continuous Commodity Index Fund |
| VOOG | Vanguard S&P 500 Growth ETF |
| VOOV | Vanguard S&P 500 Value ETF |
| EEM | iShares MSCI Emerging Markets ETF |
| XLG | Invesco S&P 500 Top 50 ETF |

| Symbol | Company | Sector | Current Price | Action Price | Target | Stop | Notes |
|---|---|---|---|---|---|---|---|
| NYT | The New York Times Company | Media | $50.99 | low-to-mid 50s | 83 | 47 | 4 for 5'er, favored MEDI sector, LT pos mkt RS, triple top, pullback from ATH, pos monthly mom flip |
| BPOP | Popular, Inc. | Banks | $63.89 | low-to-mid 60s | 76 | 54 | 5 for 5'er, top third of favored BANK sector matrix, LT pos mkt RS, multiple buy signals, bullish triangle |
| NSC | Norfolk Southern Corporation | Transports/Non Air | $258.03 | high 230s to low 260s | 316 | 196 | 5 for 5'er, pullback from ATH, LT market RS buy signal, pos trend |
| HON | Honeywell International, Inc. | Aerospace Airline | $203.56 | 198 - 220 | 270 | 162 | 4 for 5'er, pullback from ATH, fav DWAAERO, consec buy signals, LT market RS buy |
| HCA | HCA Healthcare Inc. | Healthcare | $177.37 | 170s - low 180s | 222 | 142 | 4 for 5'er, top half of favored HEAL sector matrix, LT pos mkt RS, pullback from ATH, 1.1% yield, pot. cov. write |
| ADTN | ADTRAN, Inc. | Telephone | $16.11 | 16 - 18 | 25 | 13.50 | 5 for 5'er, top 25% of TELE sector matrix, multiple buy signals, pullback from multi-year high, 2.2% yield, R-R>3.0 |
| MDC | M.D.C. Holdings, Inc. | Building | $57.57 | mid-to-upper 50s | 85 | 46 | 4 for 5'er, favored BUIL sector matrix, pullback from multi-year high, 2.4% yield, pot. cov write, R-R>2.0 |
| EVR | Evercore Inc. | Finance | $118.55 | mid 110s - mid 120s | 172 | 102 | 4 for 5'er, 8th of 70 names in favored FINA sector matrix, pullback from ATH, 2% yield |
| CENX | Century Aluminum Co | Metals Non Ferrous | $13.20 | 14 - 16 | 26.50 | 11.50 | 5 for 5'er, top 20% of favored META sector matrix, pos wkly & mnthly mom flips, R-R>3.0 |
| Symbol | Company | Sector | Current Price | Action Price | Target | Stop | Notes |
|---|
| Symbol | Company | Sector | Current Price | Action Price | Target | Stop | Notes |
|---|---|---|---|---|---|---|---|
| LPSN | LivePerson, Inc. | Computers | $71.56 | hi 60s - mid 70s | 91 | 59 | LPSN fell to a sell signal in Monday's trading. OK to hold here. Maintain $59 stop. Earn. 2/25 |
| NET | Cloudflare Inc Class A | Computers | $82.17 | mid 80s to high 90s | 136 | 68 | NET fell to a sell signal Monday. OK to hold here. Maintain $68 stop. |
| Comment |
|---|
| FRC First Republic Bank of San Francisco R ($169.32) - Banks - We will now raise our stop to $142, the first potential sell signal on FRC's default chart. |
| KKR KKR & Co. L.P R ($46.01) - Finance - We will now raise our stop to $37, the first potential sell signal on KKR's default chart. |
| ABT Abbott Laboratories R ($122.65) - Drugs - We will now raise our stop to $104 the first potential sell signal on ABT's default chart. |
| TXRH Texas Roadhouse, Inc. R ($91.71) - Restaurants - We will now raise our stop to $76, the potential trend line violation on TXRH's default chart. |
| CLGX CoreLogic, Inc. R ($86.61) - Insurance - We will now raise our stop to $72, which would take out multiple levels of support on CLGX's default chart. |
| AL Air Lease Corp. R ($46.84) - Aerospace Airline - We will now raise our stop to $39, the first potential sell signal on AL's default chart. |
CENX Century Aluminum Co R ($14.14) - Metals Non Ferrous - CENX is a 5 for 5'er that ranks in the top quintile of the favored metals non ferrous sector matrix. The stock returned to a buy signal when it broke a double top at $14.50, also reaching a fresh multi-year high. Recent flips to positive weekly and monthly momentum are a positive indication of the potential for additional upside from here. Long exposure may be added in the $14-$16 range. We will set our initial stop at $11.50, which combined with the bullish price objective of $26.50, gives us a reward-to-risk ratio in excess of 3.0.
| 18 | 19 | 20 | 21 | |||||||||||||||||||||||||||||||||||||||||||||||||||
| 24.00 | X | X | • | 24.00 | ||||||||||||||||||||||||||||||||||||||||||||||||||
| 23.00 | X | O | X | O | • | • | 23.00 | |||||||||||||||||||||||||||||||||||||||||||||||
| 22.00 | X | O | X | O | X | • | X | • | 22.00 | |||||||||||||||||||||||||||||||||||||||||||||
| 21.00 | 1 | 2 | X | O | 3 | O | X | O | • | 21.00 | ||||||||||||||||||||||||||||||||||||||||||||
| 20.00 | X | O | O | X | O | X | O | X | • | 20.00 | ||||||||||||||||||||||||||||||||||||||||||||
| 19.50 | X | O | X | O | O | X | O | • | 19.50 | |||||||||||||||||||||||||||||||||||||||||||||
| 19.00 | • | X | O | O | X | O | • | • | 19.00 | |||||||||||||||||||||||||||||||||||||||||||||
| 18.50 | X | O | X | O | X | • | 18.50 | |||||||||||||||||||||||||||||||||||||||||||||||
| 18.00 | X | O | X | O | X | O | • | Top | 18.00 | |||||||||||||||||||||||||||||||||||||||||||||
| 17.50 | X | O | 4 | O | X | X | O | • | 17.50 | |||||||||||||||||||||||||||||||||||||||||||||
| 17.00 | X | O | X | O | X | O | X | 6 | X | • | 17.00 | |||||||||||||||||||||||||||||||||||||||||||
| 16.50 | X | O | X | O | X | O | X | O | X | O | • | 16.50 | ||||||||||||||||||||||||||||||||||||||||||
| 16.00 | X | • | O | 5 | X | O | O | X | O | • | 16.00 | |||||||||||||||||||||||||||||||||||||||||||
| 15.50 | X | • | O | X | O | O | • | 15.50 | ||||||||||||||||||||||||||||||||||||||||||||||
| 15.00 | X | • | O | X | 7 | • | X | 15.00 | ||||||||||||||||||||||||||||||||||||||||||||||
| 14.50 | O | C | • | O | O | • | X | O | 14.50 | |||||||||||||||||||||||||||||||||||||||||||||
| 14.00 | O | X | • | O | • | X | X | O | x | 14.00 | ||||||||||||||||||||||||||||||||||||||||||||
| 13.50 | O | X | • | O | • | X | O | X | O | x | 13.50 | |||||||||||||||||||||||||||||||||||||||||||
| 13.00 | O | • | O | X | X | • | X | O | X | O | x | 13.00 | ||||||||||||||||||||||||||||||||||||||||||
| 12.50 | • | 8 | X | O | X | O | • | X | X | O | X | O | x | 12.50 | ||||||||||||||||||||||||||||||||||||||||
| 12.00 | O | X | O | X | O | • | X | O | X | O | X | O | Mid | 12.00 | ||||||||||||||||||||||||||||||||||||||||
| 11.50 | O | 9 | O | • | X | O | 1 | O | X | 11.50 | ||||||||||||||||||||||||||||||||||||||||||||
| 11.00 | A | • | X | 9 | C | O | X | O | 2 | 11.00 | ||||||||||||||||||||||||||||||||||||||||||||
| 10.50 | O | • | X | X | O | X | O | X | O | X | O | X | 10.50 | |||||||||||||||||||||||||||||||||||||||||
| 10.00 | O | X | • | X | O | X | O | X | O | X | O | O | X | 10.00 | ||||||||||||||||||||||||||||||||||||||||
| 9.50 | O | B | O | 2 | 4 | • | X | O | X | O | O | X | O | 9.50 | ||||||||||||||||||||||||||||||||||||||||
| 9.00 | O | X | O | X | O | X | O | • | 8 | O | O | X | 9.00 | |||||||||||||||||||||||||||||||||||||||||
| 8.50 | O | X | O | 1 | O | X | O | • | X | O | X | • | 8.50 | |||||||||||||||||||||||||||||||||||||||||
| 8.00 | O | C | X | 3 | X | 5 | X | • | 7 | O | B | • | 8.00 | |||||||||||||||||||||||||||||||||||||||||
| 7.50 | O | X | O | O | 7 | B | O | • | X | O | X | • | 7.50 | |||||||||||||||||||||||||||||||||||||||||
| 7.00 | O | O | X | O | 9 | O | • | X | O | X | • | 7.00 | ||||||||||||||||||||||||||||||||||||||||||
| 6.50 | O | X | O | X | 1 | • | 6 | A | • | Bot | 6.50 | |||||||||||||||||||||||||||||||||||||||||||
| 6.00 | O | X | 8 | X | O | X | • | 6.00 | ||||||||||||||||||||||||||||||||||||||||||||||
| 5.50 | 6 | O | O | X | • | 5.50 | ||||||||||||||||||||||||||||||||||||||||||||||||
| 5.00 | 3 | X | 5 | X | • | 5.00 | ||||||||||||||||||||||||||||||||||||||||||||||||
| 4.75 | O | X | O | X | O | X | • | 4.75 | ||||||||||||||||||||||||||||||||||||||||||||||
| 4.50 | O | X | O | X | X | O | X | • | 4.50 | |||||||||||||||||||||||||||||||||||||||||||||
| 4.25 | O | X | O | X | O | X | O | • | 4.25 | |||||||||||||||||||||||||||||||||||||||||||||
| 4.00 | O | O | X | X | O | X | • | 4.00 | ||||||||||||||||||||||||||||||||||||||||||||||
| 3.75 | O | X | O | X | O | • | 3.75 | |||||||||||||||||||||||||||||||||||||||||||||||
| 3.50 | O | X | O | X | • | 3.50 | ||||||||||||||||||||||||||||||||||||||||||||||||
| 3.25 | O | 4 | X | • | 3.25 | |||||||||||||||||||||||||||||||||||||||||||||||||
| 3.00 | O | • | 3.00 | |||||||||||||||||||||||||||||||||||||||||||||||||||
| 18 | 19 | 20 | 21 |
| AMCX AMC Networks Inc ($54.11) - Media - AMCX returned to a buy signal on Monday with a double top breakout at $54. AMCX is a 3 for 5’er within the favored media sector that ranks in the top half of the sector matrix. From here, support sits at $45 while overhead resistance lies at $73. Earnings are expected on 2/26. |
| APA Apache Corporation ($19.08) - Oil - APA returned to a buy signal when it broke a triple top at $19.50 on Monday as crude rallied nearly 5%. APA's technical picture is improving but the stock remains an unfavorable 2 for 5'er. Support can now be found at $17.50. APA is expected to report earnings on 2/24. |
| ATR Aptargroup Incorporated ($129.10) - Household Goods - ATR fell to a sell signal in Monday's trading. Although the stock remains a favorable 3 for 5'er, it currently sits at $128 on its default chart and shows no additional support until $112, so those with open exposure may wish to monitor the position closely. |
| BAC Bank of America ($35.04) - Banks - BAC shares moved higher today to break a double top at $35 to mark its third consecutive buy signal. This 4 for 5'er has been in a positive trend since June and on an RS buy signal versus the market since March of 2012. BAC is actionable at current levels with a weekly overbought/oversold reading of 61%. From here, support is offered at $30. |
| BOOT Boot Barn Holdings Inc ($62.32) - Retailing - BOOT broke a triple top at $63, marking the stock’s seventh consecutive buy signal on the chart as well as a new all-time high. BOOT is a perfect 5 for 5’er within the favored retailing that ranks in the top quartile of the sector RS matrix. From here, support sits at $59. |
| BYD Boyd Gaming Corp ($57.06) - Gaming - BYD broke a double top at $56 before moving higher to $57, marking the sixth consecutive buy signal on the chart. BYD is a 4 for 5’er that ranks 3rd out of 14 names in the favored gaming sector RS matrix. Demand is in control. From here, support sits at $52. |
| CHDN Churchill Downs Inc ($228.59) - Gaming - CHDN broke a double top at $224 before moving higher to $228, marking a new all-time high on the chart as well as the second consecutive buy signal. CHDN is a 4 for 5’er within the favored gaming sector that has maintained a market RS buy signal since 2015. Demand is in control and support sits at $208. Note earnings are expected on 2/24. |
| DFS Discover Financial Services ($95.89) - Finance - DFS shares moved higher today to break a double top at $97 to mark its second consecutive buy signal. This 4 for 5'er has been in a positive trend since September and on an RS buy signal versus the market since May. DFS is actionable at current levels with a weekly overbought/oversold reading of 14%. From here, support is offered at $89. |
| DOW Dow, Inc. ($62.48) - Chemicals - DOW returned to a buy signal with a double top break at $62 in Monday's trading, which also marked a new all-time for the stock. The technical picture for DOW is mixed. While it has an unfavorable technical attribute rating at 2 for 5, its yield of nearly 5% may tip the scales in its favor. Weekly momentum also recently flipped positive, a positive sign of DOW's potential for additional upside from here. DOW has most recently found support at $52. |
| FSLY Fastly, Inc. Class A ($76.39) - Computers - FSLY moved lower Monday to break a double bottom at $79 before falling to $77 intraday. This 1 for 5'er moved to a negative trend last week and now sits in the bottom third of the computers sector RS matrix. Weekly momentum also recently flipped positive, suggesting the potential for further downside from here. Exposure should be avoided. Note that the stock is at support from December of last year. Initial overhead resistance may come at $83. |
| GES Guess Inc. ($26.64) - Textiles/Apparel - GES broke a double top at $26 before moving higher to $27 on Monday. This marks the fifth consecutive buy signal on the chart as well as a new multi-year high. GES is a 5 for 5’er that ranks 2nd out of 24 names in the favored textiles/apparel sector. From here, support sits at $22. Earnings are expected on 3/16. |
| HES Hess Corporation ($65.41) - Oil - HES rallied on Monday along with most of the energy sector and gave a second consecutive buy signal with a double top break at $65. HES is a favorable 3 for 5'er and carries a 1.65% yield; it has most recently found support at $54. |
| INMD InMode Ltd. ($71.03) - Healthcare - INMD shares moved higher today to complete a bullish triangle at $71 and continued higher to $72 to mark its fifth consecutive buy signal. This 5 for 5'er has been in a positive trend since June and on an RS buy signal versus the market since July. Recent price action has put INMD into heavily overbought territory, so those wishing to initiate a position may be best served to scale in at current levels. From here, support is offered at $67. |
| NCLH Norwegian Cruise Line Holdings Ltd. ($29.03) - Leisure - NCLH broke a double top at $29, marking the third consecutive buy signal on the chart. NCLH is a 3 for 5’er within the favored leisure sector that just experienced a flip to positive weekly momentum. From here, support sits at $22. Earnings are expected on 2/25. |
| PLAY Dave & Busters Entertainment ($40.95) - Restaurants - PLAY broke a double top at $41, marking the eighth consecutive buy signal on the chart. PLAY is a 5 for 5’er that ranks 3rd out of 27 names in the favored restaurants sector RS matrix. From here, support sits at $36. |
| RL Ralph Lauren ($117.68) - Textiles/Apparel - RL broke a spread triple top at $118 on Monday, marking the stock’s second consecutive buy signal. This stock is a healthy 3 for 5’er within the favored textiles/apparel sector that is trading in a positive trend. From here, support sits at $110. |
| RS Reliance Steel & Aluminum Co ($135.37) - Steel/Iron - RS gave a sixth consecutive buy signal when it broke a double top at $136 amid a broad rally of industrial metals producers on Monday; the move also marks a new all-time high for the stock. Although it ranks in the bottom of the steel/iron sector matrix, RS is favorable 4 for 5'er and carries a 2% yield. The stock has move recently found support at $116. |
| TEX Terex Corporation ($41.37) - Machinery and Tools - Shares of TEX reversed up into Xs on Monday, breaking a double top at $42 to give a fourth consecutive buy signal. The 4 for 5'er ranks in the top quartile of the favored machinery and tools stock sector matrix and recently returned to an RS buy signal versus the market earlier this month. Demand is in control and TEX is actionable at current levels. Initial support is offered at around $38. |
| TXRH Texas Roadhouse, Inc. ($91.71) - Restaurants - TXRH broke a double top at $91 before moving higher to $92. TXRH is a 4 for 5’er within the favored restaurants sector that has maintained a long-term market RS buy signal since January 2018. Furthermore, weekly momentum has been positive for four weeks and TXRH is now trading at new all-time highs. From here, support sits at $84. |
| WD Walker & Dunlop, Inc. ($105.92) - Real Estate - Shares of WD reversed back up into Xs on Monday to break a triple top at $106, resulting in a second consecutive buy signal and new all-time high. The 5 for 5'er ranks near the top decile of the real estate stock sector matrix and recently experienced a flip to positive weekly momentum, indicating the potential for additional upside. Demand is in control. Initial support is offered at around $99. |
| WYNN Wynn Resorts, Limited ($128.67) - Gaming - WYNN broke a double top at $126 before moving higher to $130 on Monday. This marks WYNN’s second consecutive buy signal and a new 52 week high. WYNN is a 4 for 5’er within the favored gaming sector that has experienced two weeks of positive weekly momentum. From here, support sits at $118 with additional support available at $99. |

| Name | Option Symbol | Action | Stop Loss |
|---|---|---|---|
| Discover Financial Services - $95.39 | O: 21D95.00D16 | Buy the April 95.00 calls at 6.50 | 88.00 |
| Name | Option | Action |
|---|---|---|
| CBRE Group, Inc. ( CBRE) | Mar. 60.00 Calls | Raise the option stop loss to 13.20 (CP: 15.20) |
| Exxon Mobil Corporation ( XOM) | Jun. 42.50 Calls | Raise the option stop loss to 10.65 (CP: 12.65) |
| Truist Financial Corp ( TFC) | Jun. 45.00 Calls | Raise the option stop loss to 12.60 (CP: 14.60) |
| Freeport-McMoRan Inc. ( FCX) | May. 25.00 Calls | Raise the option stop loss to 11.25 (CP: 13.25) |
| Morgan Stanley ( MS) | Apr. 65.00 Calls | Raise the option stop loss to 12.00 (CP: 14.00) |
| Apple Inc. ( AAPL) | Jun. 125.00 Calls | Stopped at 126.00 (CP: 126.53) |
| Micron Technology, Inc. ( MU) | Jun. 75.00 Calls | Stopped at 18.05 (CP: 16.05) |
| DraftKings Inc Class A ( DKNG) | May. 55.00 Calls | Initiate an option stop loss of 8.55 (CP: 10.55) |
| Name | Option Symbol | Action | Stop Loss |
|---|---|---|---|
| Walmart Inc. - $137.69 | O: 21Q140.00D21 | Buy the May 140.00 puts at 8.50 | 148.00 |
| Name | Option | Action |
|---|---|---|
| New York Community Bancorp, Inc. (NYCB) | Apr. 11.00 Puts | Stopped at 12.00 (CP: 12.08) |
| Advanced Micro Devices, Inc. (AMD) | Jun. 92.50 Puts | Initiate an option stop loss of 11.10 (CP: 13.10) |
| Las Vegas Sands Corp. (LVS) | Apr. 57.50 Puts | Stopped at 61.00 (CP: 62.70) |
| Las Vegas Sands Corp. (LVS) | Jun. 60.00 Puts | Stopped at 61.00 (CP: 62.70) |
| Name | Option Sym. | Call to Sell | Call Price | Investment for 500 Shares | Annual Called Rtn. | Annual Static Rtn. | Downside Protection |
|---|---|---|---|---|---|---|---|
| Vale S.A., (Brazil) ADR $18.22 | O: 21D18.00D16 | Apr. 18.00 | 0.91 | $8,402.20 | 41.81% | 29.74% | 4.14% |
| Name | Action |
|---|---|
| MGM Resorts International (MGM) - 36.42 | Sell the June 35.00 Calls. |
| Cree Research Inc (CREE) - 125.86 | Sell the June 125.00 Calls. |
| FireEye, Inc (FEYE) - 20.81 | Sell the June 25.00 Calls. |
| Cimarex Energy Co. (XEC) - 50.30 | Sell the June 55.00 Calls. |
| Synchrony Financial (SYF) - 38.08 | Sell the June 40.00 Calls. |
| Micron Technology, Inc. (MU) - 90.96 | Sell the May 90.00 Calls. |
| General Motors (GM) - 52.57 | Sell the June 55.00 Calls. |
| Taiwan Semiconductor Manufacturing Co. (Taiwan) ADR (TSM) - 136.66 | Sell the July 140.00 Calls. |
| Comerica Incorporated (CMA) - 66.71 | Sell the April 67.50 Calls. |
| Name | Covered Write |
|---|---|
|
|
|
Daily Equity & Market Analysis
Loading, Please Wait...
