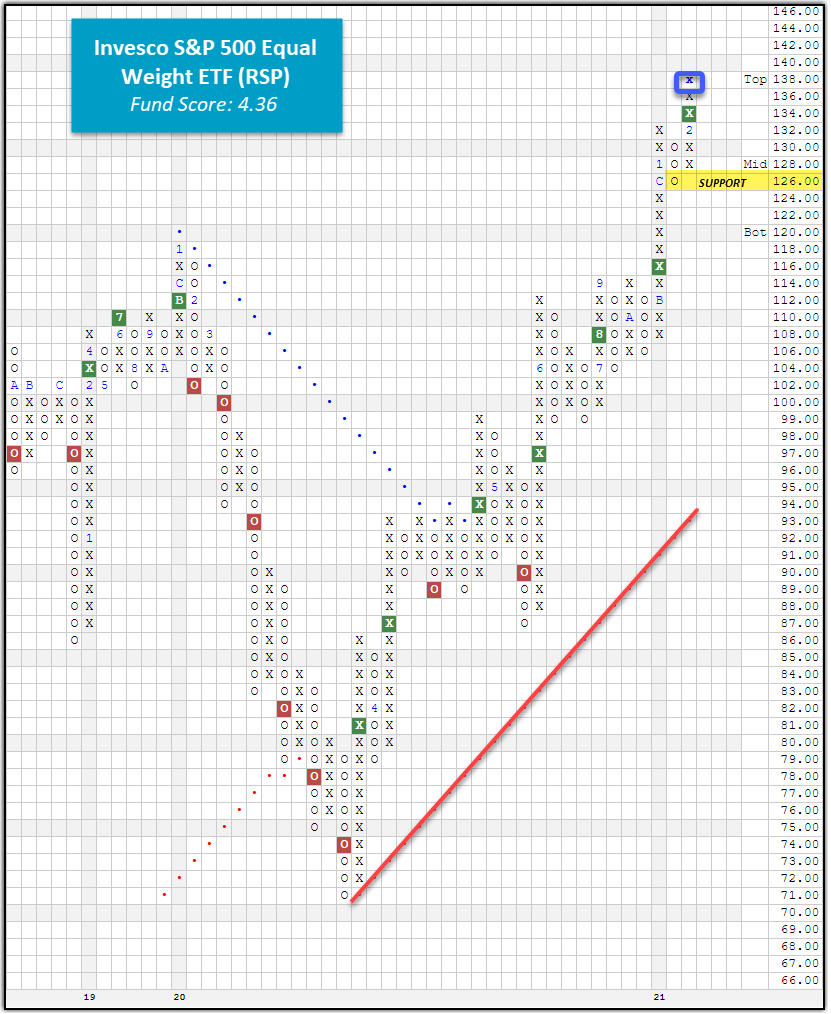
With today’s market action, the Invesco S&P 500 Equal Weight ETF [RSP] printed a new all-time high at $138.
Portfolio View - Major Market ETFs
| Symbol | Name | Price | Yield | PnF Trend | RS Signal | RS Col. | Fund Score | 200 Day MA | Weekly Mom |
|---|---|---|---|---|---|---|---|---|---|
| DIA | SPDR Dow Jones Industrial Average ETF Trust | 315.39 | 1.91 | Positive | O | 2.91 | 281.91 | -10W | |
| EEM | iShares MSCI Emerging Markets ETF | 56.09 | 1.40 | Positive | Sell | O | 5.49 | 46.32 | -2W |
| EFA | iShares MSCI EAFE ETF | 76.13 | 2.14 | Positive | Sell | O | 3.06 | 66.58 | -10W |
| FM | iShares MSCI Frontier 100 ETF | 29.31 | 2.80 | Positive | Sell | O | 1.11 | 26.16 | -3W |
| IJH | iShares S&P MidCap 400 Index Fund | 252.66 | 1.26 | Positive | Buy | O | 4.42 | 202.35 | -5W |
| IJR | iShares S&P SmallCap 600 Index Fund | 106.03 | 1.05 | Positive | Buy | X | 4.46 | 79.24 | -3W |
| QQQ | Invesco QQQ Trust | 321.48 | 0.55 | Positive | Buy | X | 4.56 | 280.93 | -1W |
| RSP | Invesco S&P 500 Equal Weight ETF | 136.19 | 1.65 | Positive | Buy | X | 4.36 | 114.30 | -10W |
| SPY | SPDR S&P 500 ETF Trust | 387.50 | 1.54 | Positive | O | 3.15 | 342.70 | -1W | |
| XLG | Invesco S&P 500 Top 50 ETF | 292.76 | 1.26 | Positive | O | 4.21 | 263.56 | -1W |
Additional Comments:
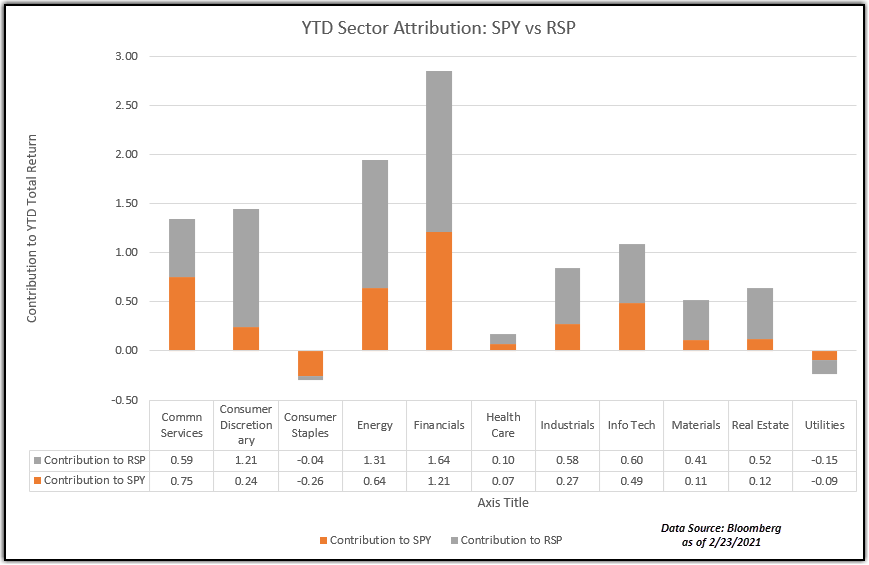
Over the last week of action, the Invesco S&P 500 Equal Weight ETF RSP was the only major market fund to finish in positive territory with a 7-day gain of 0.58%. This upward price action has carried over to today’s trading session where RSP has added a new X at the $138 level, marking a new all-time high for the equal-weight proxy. Furthermore, RSP has given a total of four consecutive buy signals with the last occurring earlier this month at $134, signaling that demand is in control. Despite yesterday’s elevated volatility, RSP posted a daily gain of 0.27% and is now up over 6.7% for the year through 2/23, a year-to-date gain that is outperforming the cap-weighted SPY’s by a margin of 314bps. Although these two funds own the exact same 500 stocks and both sit at all-time highs, the equal-weighting methodology has enabled RSP to take advantage of the high-flying names outside of the large and mega caps stocks that drive the majority of the S&P 500 cap-weighted index. While we haven’t seen those large and mega-cap names such as Amazon AMZN and Apple AAPL deteriorate significantly enough to change their overall technical outlook, we have seen them stall out performance-wise after a stellar 2020 when compared to their small and mid-cap counterparts. From a sector attribution standpoint between RSP and SPY, we find that the major difference in YTD performance between the two funds comes from the consumer discretionary sector which has added 1.21% to RSP’s total return versus adding just 0.24% to that of SPY. The energy sector is another big differentiator as it has accounted for 1.31% of RSP’s total return so far this year while it has only accounted for 0.64% of SPY’s. Additionally, communication services and utilities are the only two sectors that have contributed more to SPY’s total return versus that of RSP. Financials is the highest contributing sector in both SPY and RSP as it has added 1.21% and 1.64%, respectively, on a total return basis. Overall, the weight of the evidence is positive for RSP. Initial support sits at $126, with additional support available at $106.