
Most Requested Symbols

Each year, we produce 12 articles throughout the last few weeks of the year, all revolving around one central concept. In the past, we have used this series to discuss anything from the basics of Point & Figure and Relative Strength to themes to know in the coming year. This year, all 12 articles will revolve around the topic of "Enhancing Your Process With Scalable Customization in 2021."
Today's featured stock is Deere & Company (DE)
AMD, BEEM, EEFT, FAST, FIVE, NVRO, OKTA, SWI & WEX
Call: QUALCOMM Inc (QCOM), Put: Jack Henry & Associates (JKHY), Covered Write: Mosaic Company (MOS)
We are excited to announce phase three of the Nasdaq Dorsey Wright Model Builder with the launch of Matrix and FSM-based Relative Strength (RS) Testing Service. As part of this launch, we are granting you free access to the service for the remainder of 2020. The tool is designed to help you more easily design, test, implement, and monitor custom models powered by the Nasdaq Dorsey Wright methodology. Through the end of December, be sure to join us each Thursday at 1 pm EST for a custom modeler demo presented by the analyst team.
11/19/2020: Static Model Builder Demo Replay - Click Here
12/9/2020: Matrix Model Builder Demo Replay - Click here
11/5/2020: FSM Model Builder Demo Replay - Click here
Click here to register for future Nasdaq Dorsey Wright Model Builder Demos
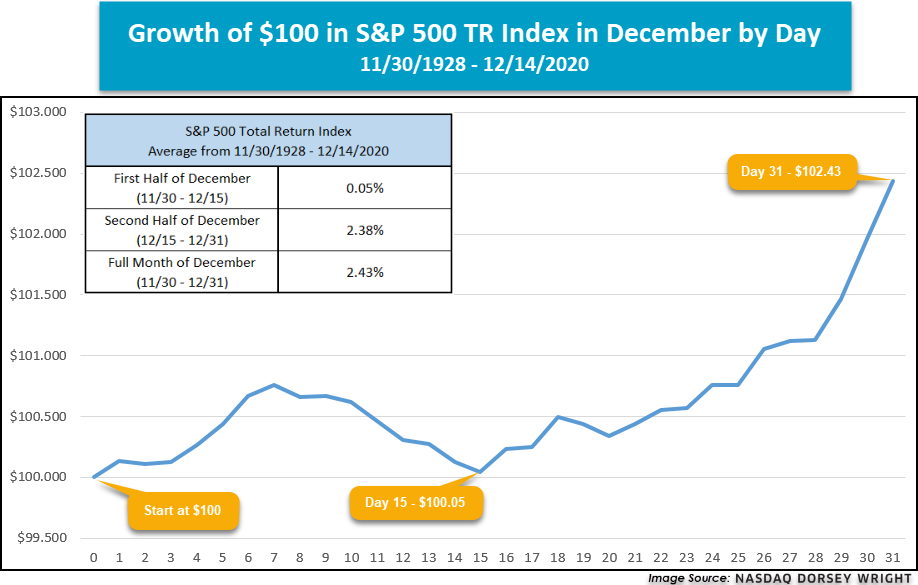
Historically, December is a strong month for the equity market, as we recently discussed in this article. Beyond the strong average performance for the month, there are a few other notable return patterns that have historically held true during December. For instance, it is often believed that much of the returns for the month come in the latter half of the month. To address the historical performance dispersion between the first half and second half of December, we have gathered the return data for the S&P 500 total return index TR.SPXX. We looked at the daily return of the index for every December going back to the end of 1928 and averaged the result for each day. For example, we took all the returns of 12/1 of each year and averaged them up. We repeated the same process for all 31 days in December. What we found is that the majority of December return does come from the second part of the month. As shown in the line graph below, if one were to invest $100 in the S&P 500 total return index, at the beginning of the month, 15 days into December that $100 investment will turn into $100.05, or a 0.05% gain. By the end of the month, which is 16 days later, that $100.05 grows to $102.43, which is an increase of 2.38%. That is almost 50 times the return of the first half of the month!

(Source: etf.com)
Over the last decade, the advisory business has continued to evolve rapidly with the growing trends of lower fees and increased automation. With the influx of low-cost index funds and Robo-advisors offering nearly-free financial planning, investors can now gain beta market exposure at rock-bottom prices without ever setting foot in an advisor's office. The upshot is that it is now more challenging than ever for you as a traditional financial advisor to justify your fee and grow your client base. That said, you must scale your process and sharpen your value proposition as much as possible. To help you do just that, this year's 12 Days of Christmas Series, "Enhancing Your Process With Scalable Customization in 2021," will navigate you through the benefits, use/implementation, and customization of rules-based, Relative Strength-driven guided model portfolios. Additionally, this series will highlight the NDW Model Builder Tool's new features, providing relevant use-cases to help you scale your business in the coming year.
Day 1 - Benefits of Models and a Rules-Based Process
Day 2 - The Relative Strength Process
Model Foundations - The Relative Strength Matrix
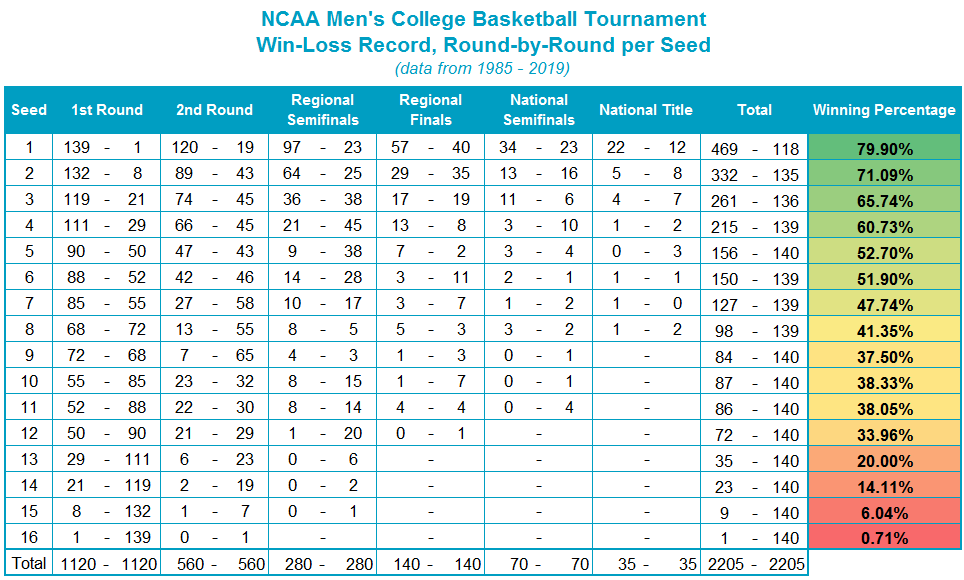
Now that we have reviewed relative strength, the next step in "enhancing your process with scalable customization" is reviewing the relative strength matrix, as it is at the core of many of the NDW model portfolio solutions and a critical building block in creating your own custom models. Even though it was cancelled this year, we have found that the NCAA basketball tournament is an approachable analogy for the relative strength matrix ranking process. In a relative strength matrix, we are simply seeding, or ranking, “teams”, and like the NCAA experts, we base a team’s ranking on its success against its peers. In a relative strength matrix, we compare all of the investments, or teams, against each other on a relative strength basis. The more relative strength buy signals generated by a team/security, the stronger the ranking or the “seeding” of that stock or ETF. Like the NCAA tournament, we know that history shows those top seeds perform better as a universe than the lower seeds. There are upsets, of course, but the trend favors the higher seeds, so that is where we focus our investments.
While the NCAA committee has its own proprietary system for ranking teams, the input is based on head-to-head games earlier in the season and overall recent performance. How a relative strength matrix ranks stocks, sectors, and even asset classes is not particularly dissimilar. Our relative strength rankings are a way to identify the strongest performance trends within a given universe, using head-to-head comparisons (RS charts) to build a database of information. The matrix process also affords us a lens through which to see negative performance trends begin to improve. We would offer, however, that top-ranked assets in a matrix are your high-seeds, and thus offer the best probability of repeatable success. While low-ranked assets that are simply improving would be the equivalent of a 12 seed scoring an upset. We would not build a portfolio based upon 12 seeds due to the instability of these trends, however, the RS rankings do offer a logical, organized means for approaching the "upset" selection process. More importantly, the relative strength ranking process, through the relative strength matrix, provides you with an efficient and effective means for identifying leadership, especially when used for building models.
In theory, the concept of applying a relative strength overlay to a group of investments seems to make intuitive sense, but how do the results look in practice? One of our most widely-referenced whitepapers titled “Point and Figure Relative Strength Signals” assessed the performance record of the largest 1,000 U.S. stocks, sorting each into one of four equally-weighted portfolios based on their relative strength signal and column on a 6.5% RS chart against the S&P 500 SPX. Each month, the portfolios were rebalanced and reconstituted to account for drift and RS status changes. Not only did the "Buy in Xs" category perform far better than all other groups and the benchmarks, but it also displayed a higher risk-adjusted return as indicated by a Sharpe ratio of 0.70 relative to the S&P 500 Total Return Index TR.SPXX and Equal Weighted Universe, which had Sharpe ratios of 0.52 and 0.55, respectively. It truly does pay to follow the leader!

Relative Strength Matrix - How are assets ranked?
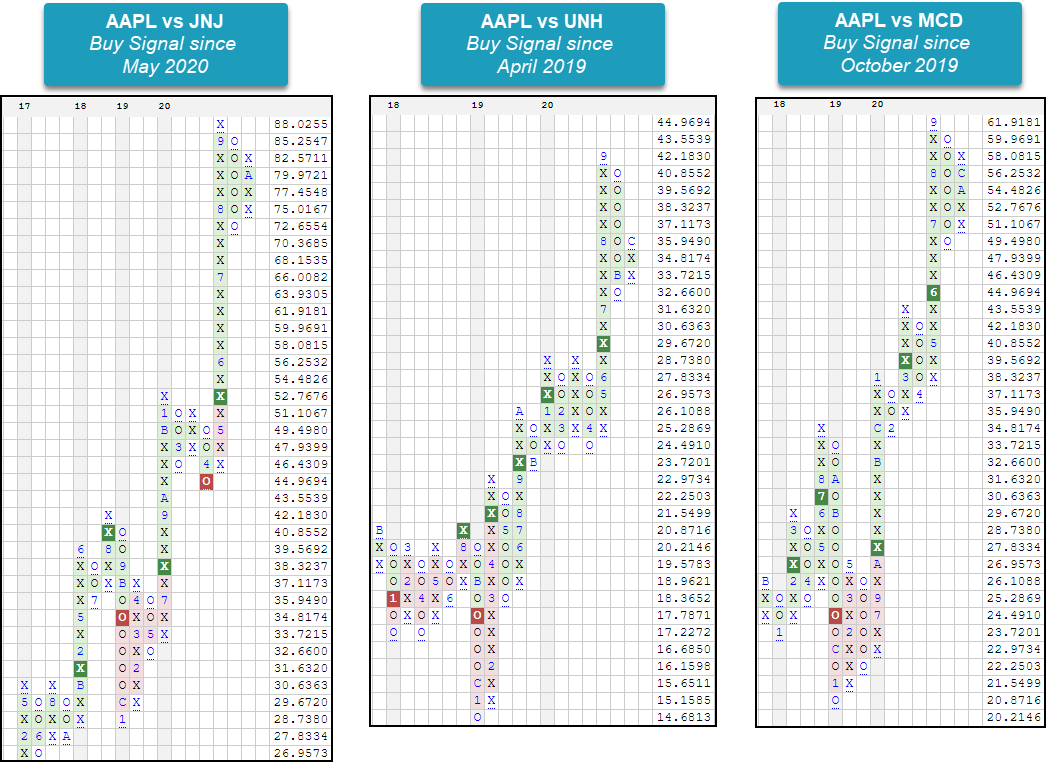
The RS matrix is an extension of the relative strength chart that we reviewed yesterday. It provides an intuitive visual display of which securities within a given universe possess superior relative strength. Those with the strongest RS reside at the top of the matrix, while those at the bottom of the matrix are the weakest. Of course, it is then best to focus your buying on those securities which rank in the top decile, or quartile of the given RS matrix. In a nutshell, an RS matrix is valuable tool for determining which stocks or funds should be considered for inclusion in a portfolio. Take for instance Apple AAPL. We can assess the relative strength of Apple versus other investments on an individual basis using individual relative strength charts. How does AAPL look against Johnson & Johnson JNJ or McDonald’s MCD? But what if we want to know how AAPL compare against the rest of the market or its Dow Jones Industrial Average DJIA peers? Looking at individual relative strength chart may become cumbersome and does not necessarily provide a comprehensive view of strength and weakness among an investable universe.
Website Tip: To access the RS Matrix Tool, click on "Security Selection" and then select “Matrix”. The default landing page for the Matrix tool is the DWA Custom Matrix Control Panel, which lists your existing matrices and provides quick access to premade matrices, shared matrices, matrix alerts, and matrix preferences.
Relative Strength Matrix - Creating a Matrix
The relative strength matrix provides a ranking of all the securities in an inventory. If you wanted to see how AAPL compares against the rest of the DJIA, simply compare it against the 29 other members of the DJIA! If you wanted to see how the internet sector compares against the other sectors, create a relative strength matrix.
Website Tip: To create a new custom RS matrix, click "Create a Matrix" from the matrix landing page. Alternatively, this can be done via “Create Matrix” in the Portfolio tool or the NDW Shuttle Tool (Send to…) found throughout the site. From there you are provided with a template that must be populated with specific choices. When deciding on a matrix name, be sure not to include any sensitive information, such as account number, etc. The scale defaults to 3.25%, as this is typically the best starting point for an intermediate- to long-term time frame for any given RS matrix. However, for lower volatility securities or asset classes, such as fixed income, it is often better to use a smaller scale, such as 2%. If upon viewing your matrix you notice white boxes or a warning near the top of the tool, you may need to reduce your scale. The "Update Frequency" box refers to how often your custom matrix will update. We default to "once," so be sure to change this if you want to be able to consult your matrix on an ongoing basis or if you plan to use it as the basis for a model. When adding your tickers, note that you must enter the symbols, not names, separated by commas, before clicking "Add" to create your list. Once you have filled out all the appropriate data, click "SAVE".

The relative strength matrix output is a top-down ranking from strongest to weakest. The strongest securities will be ranked at the top, as they have the greatest number of relative strength buy signals. As you build or allocate to a model, those are the securities with the most relative strength and are often the ones that have the highest likelihood to outperform going forward. Many of the models on the NDW platform systematically allocate to the stocks, or funds, that are ranked in the top quartile or decile of the matrix. When a position falls out of favor and moves into the bottom half, for example, it is then removed from the portfolio, and the model then adds the strongest security not already in the model.
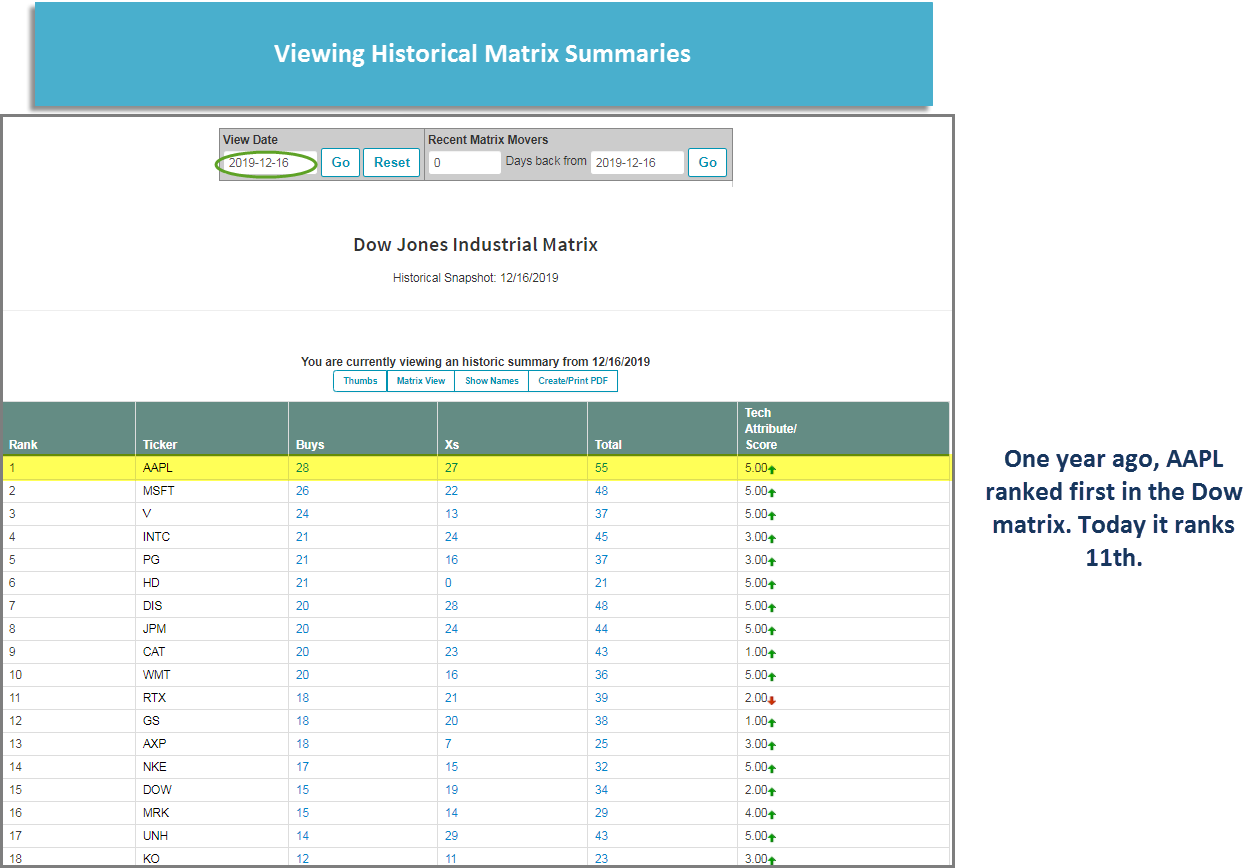
Website Tip: As you "view" your matrix, realize that by clicking on the ticker symbol of a stock or fund, you will be offered a picture of its PnF chart, allowing for further evaluation. As we look more closely at this matrix, we see that the grid is populated with green and red squares with two symbols, such as BX, BO, SX, or SO. These represent the actual RS signal and column on the relative strength chart of the two securities being compared. For example, if we were to look at the box that pertains to AAPL versus UNH, we see that the RS chart is on a buy signal and in a column of X's, or BX. This means that Apple is on an RS buy signal versus United Health, meaning that Apple shows both near-term (column) and long-term (signal) relative strength over UNH. When viewing Apple relative to all other constituents in the matrix, we observe Apple is ranked 11th, displaying long-term RS in the form of buy signals against 19 of the 29 other constituents.

Website Tip: The "Summary" link provides you with a condensed view of your custom-made RS matrix, stripping off all the green and red boxes and leaving you mostly with just the ranking and technical attribute information. It is from this link that you can view historical data on how your matrix would have stacked up on a previous date. Additionally, a "Thumbs" link is also offered under the Summary section, which provides you a view of all PnF charts in your matrix universe.
On Thursday we will cover another foundation of model building – the Fund Score Method – and technical attribute ratings. We will then move on to how these tools are used to create rules-based models for portfolio management before exploring how you can combined all of these tools to create personalized models via the custom modeler.
The RS matrix tool is included with the ESS subscription package level. For more information on the tool and other included offerings, please contact 804-320-8511 or email dwa@dorseywright.com.


SSTREET: Buy Aerospace & Defense (XAR)
As a refresher, the State Street Sector Model SSTREET monitors the Relative Strength (RS) relationships between each of the sector and industry ETFs in the model universe versus the S&P 500 Index (SPX) on a 6.5% scale. ETFs that are showing positive RS versus SPX (measured by a column of Xs) are included in the model and are removed only when that relationship reverses into Os. Over the past week of trading, the RS chart comparing the SPDR S&P Aerospace & Defense ETF XAR versus the S&P 500 Index reversed up into Xs, warranting its addition to the SSTREET model. This model remains fully invested through sector-based ETFs within the broader State Street family of ETFs and is evaluated on a weekly basis. The number of holdings can vary based on sector leadership within changing markets, and with the addition of XAR, the model is equally weighted across 19 positions at 5.26% each. Year-to-date, the SSTREET model is up 26.05%, outperforming the S&P 500's return of 14.59% (through 12/8)... (Read more)
Fund Feature: Invesco Solar ETF
There are no changes to any of the Invesco models this week. In last week’s trading, the Invesco Solar ETF TAN gave a third consecutive buy signal on its default chart when it broke a double top at $85. TAN currently has a near-perfect 5.98 fund score, 2.8 points better than the average for all energy/natural resource funds, and a positive 1.28 score direction. TAN’s largest holdings include Enphase Energy ENPH 11.02%, SolarEdge Technologies SEDG 9.96%, Xinyi Solar Holdings Ltd 968-HK, and First Solar Inc FSLR. Year-to-date (through 12/11) TAN has generated a price return of 172.08%. With a weekly overbought/oversold (OBOS) reading of 33%, TAN sits well within actionable territory, so those interested in adding exposure may do so here. On its default chart, TAN has most recently found support at $80, with additional support at $71. The fund faces overhead resistance at $88... (Read more)
iShares Fund Spotlight: IYM
There are no changes to any of the iShares models this week. Last week, the basic materials sector moved into the top four spots in the DALI domestic equity rankings. Those looking to take advantage of the strength of this sector should consider the iShares US Basic Materials ETF IYM. IYM currently has a favorable 4.15 fund score, 0.18 points better than the average for all materials sector funds. On its default chart. IYM has given four consecutive buy signals and sits one box away from giving a fifth with a double top breakout at $114. Which would also mark a new all-time high for the fund. Year-to-date (through 12/9) the fund gas generated a price return of 14.63%. With weekly overbought/oversold reading of 69%, IYM is verging on heavily-overbought territory, so those interested in adding exposure should may be best served to do so on a slight pullback. IYM has most recently found support at $106, with additional support found at $95... (Read more)
Average Level
38.09
| AGG | iShares US Core Bond ETF |
| USO | United States Oil Fund |
| DIA | SPDR Dow Jones Industrial Average ETF |
| DVY | iShares Dow Jones Select Dividend Index ETF |
| DX/Y | NYCE U.S.Dollar Index Spot |
| EFA | iShares MSCI EAFE ETF |
| FXE | Invesco CurrencyShares Euro Trust |
| GLD | SPDR Gold Trust |
| GSG | iShares S&P GSCI Commodity-Indexed Trust |
| HYG | iShares iBoxx $ High Yield Corporate Bond ETF |
| ICF | iShares Cohen & Steers Realty ETF |
| IEF | iShares Barclays 7-10 Yr. Tres. Bond ETF |
| LQD | iShares iBoxx $ Investment Grade Corp. Bond ETF |
| IJH | iShares S&P 400 MidCap Index Fund |
| ONEQ | Fidelity Nasdaq Composite Index Track |
| QQQ | Invesco QQQ Trust |
| RSP | Invesco S&P 500 Equal Weight ETF |
| IWM | iShares Russell 2000 Index ETF |
| SHY | iShares Barclays 1-3 Year Tres. Bond ETF |
| IJR | iShares S&P 600 SmallCap Index Fund |
| SPY | SPDR S&P 500 Index ETF Trust |
| TLT | iShares Barclays 20+ Year Treasury Bond ETF |
| GCC | WisdomTree Continuous Commodity Index Fund |
| VOOG | Vanguard S&P 500 Growth ETF |
| VOOV | Vanguard S&P 500 Value ETF |
| EEM | iShares MSCI Emerging Markets ETF |
| XLG | Invesco S&P 500 Top 50 ETF |

| Symbol | Company | Sector | Current Price | Action Price | Target | Stop | Notes |
|---|---|---|---|---|---|---|---|
| AOS | A.O. Smith Corporation | Building | $55.41 | mid to upper 50s | 72 | 47 | 4 for 5'er, four consec buy signals, mutli-year high, market RS buy signal since 9/2008, 1.86% yield |
| SPWR | Sunpower Corporation | Electronics | $21.99 | low 20s | 33.50 | 18 | 5 for 5'er, #3 of 59 names in ELEC sector matrix, pos wkly mom flip, pot cov. write |
| BECN | Beacon Roofing Supply, Inc. | Building | $38.21 | 36 - 40 | 56 | 30 | 4 for 5'er, top third of fav DWABUIL, consec buy signals, 52 week highs, pos weekly mom flip |
| APAM | Artisan Partners Asset Management, Inc | Finance | $47.96 | mid-to-upper 40s | 53.50 | 39 | 5 for 5'er, top 20% of FINA sector matrix, multiple buy signals, pos wkly mom flip, 6% yield |
| CZR | Caesars Entertainment Inc. | Gaming | $71.81 | low-to-mid 70s | 88 | 62 | 4 for 5'er, #1 of 12 in favored GAME sector matrix, triple top breakout, pot. covered write |
| APPS | Digital Turbine Inc. | Computers | $46.93 | low to upper 40s | 78 | 35 | 5 for 5'er, LT market RS buy signal, consec buy signals, pullback from ATH,fav COMP sector |
| LASR | nLIGHT, Inc. | Semiconductors | $32.83 | low-to-mid 30s | 55 | 27 | 5 for 5'er, top 10% of SEMI sector matrix, consec buy signals, pullback from multi-year high |
| JCI | Johnson Controls International PLC | Protection Safety Equipment | $45.10 | mid 30s | 58 | 39 | 4 for 5'er, top half of PROT sector matrix, multiple buy signals 2.3% yield, R-R>2.0 |
| DE | Deere & Company | Machinery and Tools | $252.72 | 250s to low 270s | 348 | 208 | 5 for 5'er, ATH, pos trend, top 25% of DWAMACH, 1 box from 7th consec buy signal |
| Symbol | Company | Sector | Current Price | Action Price | Target | Stop | Notes |
|---|
| Symbol | Company | Sector | Current Price | Action Price | Target | Stop | Notes |
|---|---|---|---|---|---|---|---|
| MLM | Martin Marietta Materials In | Building | $259.70 | 270s - 290s | 312 | 236 | See follow comment below. |
| CVNA | Carvana Company | Autos and Parts | $250.97 | 230s - 260s | 348 | 220 | See follow comments. |
| Comment |
|---|
| MLM Martin Marietta Materials In R ($263.59) - Building - MLM moved to a sell signal. No new positions here. We will abide by our $236 stop. |
| CVNA Carvana Company R ($261.00) - Autos and Parts - CVNA completed a shakeout pattern at $268 with today's action. We will abide by our $220 stop. |
DE Deere & Company R ($263.00) - Machinery and Tools - DE is a perfect 5 for 5’er that ranks within the top quartile of the favored machinery and tools sector RS matrix. Furthermore, DE has maintained a long-term peer RS buy signal since August 2017 and is trading well above the bullish support line. Since moving to a buy signal in May, DE has given a total of six consecutive buy signals and, with today’s reversal to $264, sits just one box from marking a seventh as well as a new all-time high. Okay to add new exposure in the 250s to low 270s. We will set our initial stop loss at $208, which would violate multiple levels of support on DE’s default chart. We will use a modified price target objective of $348 as our near-term price target.
| 20 | ||||||||||||||||||||||||||||||||||||||||||||||||||||||
| 264.00 | X | X | x | 264.00 | ||||||||||||||||||||||||||||||||||||||||||||||||||
| 260.00 | X | O | X | O | x | 260.00 | ||||||||||||||||||||||||||||||||||||||||||||||||
| 256.00 | X | O | X | O | x | 256.00 | ||||||||||||||||||||||||||||||||||||||||||||||||
| 252.00 | X | O | X | C | 252.00 | |||||||||||||||||||||||||||||||||||||||||||||||||
| 248.00 | X | O | 248.00 | |||||||||||||||||||||||||||||||||||||||||||||||||||
| 244.00 | X | Mid | 244.00 | |||||||||||||||||||||||||||||||||||||||||||||||||||
| 240.00 | X | X | 240.00 | |||||||||||||||||||||||||||||||||||||||||||||||||||
| 236.00 | X | O | B | 236.00 | ||||||||||||||||||||||||||||||||||||||||||||||||||
| 232.00 | X | O | X | 232.00 | ||||||||||||||||||||||||||||||||||||||||||||||||||
| 228.00 | A | O | X | 228.00 | ||||||||||||||||||||||||||||||||||||||||||||||||||
| 224.00 | X | X | O | 224.00 | ||||||||||||||||||||||||||||||||||||||||||||||||||
| 220.00 | X | O | X | 220.00 | ||||||||||||||||||||||||||||||||||||||||||||||||||
| 216.00 | 9 | O | X | 216.00 | ||||||||||||||||||||||||||||||||||||||||||||||||||
| 212.00 | X | O | Bot | 212.00 | ||||||||||||||||||||||||||||||||||||||||||||||||||
| 208.00 | X | 208.00 | ||||||||||||||||||||||||||||||||||||||||||||||||||||
| 204.00 | X | 204.00 | ||||||||||||||||||||||||||||||||||||||||||||||||||||
| 200.00 | X | 200.00 | ||||||||||||||||||||||||||||||||||||||||||||||||||||
| 198.00 | X | 198.00 | ||||||||||||||||||||||||||||||||||||||||||||||||||||
| 196.00 | X | 196.00 | ||||||||||||||||||||||||||||||||||||||||||||||||||||
| 194.00 | X | 194.00 | ||||||||||||||||||||||||||||||||||||||||||||||||||||
| 192.00 | X | 192.00 | ||||||||||||||||||||||||||||||||||||||||||||||||||||
| 190.00 | X | 190.00 | ||||||||||||||||||||||||||||||||||||||||||||||||||||
| 188.00 | X | 188.00 | ||||||||||||||||||||||||||||||||||||||||||||||||||||
| 186.00 | X | 186.00 | ||||||||||||||||||||||||||||||||||||||||||||||||||||
| 184.00 | X | 184.00 | ||||||||||||||||||||||||||||||||||||||||||||||||||||
| 182.00 | • | X | 182.00 | |||||||||||||||||||||||||||||||||||||||||||||||||||
| 180.00 | • | • | • | X | • | X | 8 | 180.00 | ||||||||||||||||||||||||||||||||||||||||||||||
| 178.00 | O | X | • | 1 | • | X | O | • | X | O | X | 178.00 | ||||||||||||||||||||||||||||||||||||||||||
| 176.00 | O | X | O | X | O | • | X | O | • | X | O | X | 176.00 | |||||||||||||||||||||||||||||||||||||||||
| 174.00 | O | X | O | X | O | • | X | O | • | X | O | 174.00 | ||||||||||||||||||||||||||||||||||||||||||
| 172.00 | O | X | O | X | O | X | X | O | • | X | 172.00 | |||||||||||||||||||||||||||||||||||||||||||
| 170.00 | O | O | X | O | X | O | X | O | • | X | X | 170.00 | ||||||||||||||||||||||||||||||||||||||||||
| 168.00 | O | X | O | X | O | X | O | • | X | O | X | 168.00 | ||||||||||||||||||||||||||||||||||||||||||
| 166.00 | C | X | O | X | O | O | X | • | X | O | X | 166.00 | ||||||||||||||||||||||||||||||||||||||||||
| 164.00 | O | O | 2 | O | X | O | • | X | O | X | 164.00 | |||||||||||||||||||||||||||||||||||||||||||
| 162.00 | • | O | X | • | O | X | O | • | X | O | X | X | 162.00 | |||||||||||||||||||||||||||||||||||||||||
| 160.00 | • | O | X | • | O | 3 | O | • | X | O | X | O | 7 | 160.00 | ||||||||||||||||||||||||||||||||||||||||
| 158.00 | • | O | • | O | X | O | • | X | O | X | O | X | 158.00 | |||||||||||||||||||||||||||||||||||||||||
| 156.00 | • | • | O | X | O | X | • | X | X | O | X | O | X | 156.00 | ||||||||||||||||||||||||||||||||||||||||
| 154.00 | O | O | X | O | • | X | O | 6 | O | X | O | X | 154.00 | |||||||||||||||||||||||||||||||||||||||||
| 152.00 | O | X | O | • | • | • | X | O | X | O | X | O | X | 152.00 | ||||||||||||||||||||||||||||||||||||||||
| 150.00 | O | X | O | X | • | X | • | • | X | O | X | O | O | 150.00 | ||||||||||||||||||||||||||||||||||||||||
| 148.00 | O | O | X | O | X | O | • | X | • | X | O | • | 148.00 | |||||||||||||||||||||||||||||||||||||||||
| 146.00 | O | X | O | X | O | • | X | O | • | X | • | 146.00 | ||||||||||||||||||||||||||||||||||||||||||
| 144.00 | O | X | X | O | O | X | O | • | X | • | 144.00 | |||||||||||||||||||||||||||||||||||||||||||
| 142.00 | O | X | O | X | O | X | 5 | • | X | • | 142.00 | |||||||||||||||||||||||||||||||||||||||||||
| 140.00 | O | X | X | O | X | O | X | X | O | • | X | • | 140.00 | |||||||||||||||||||||||||||||||||||||||||
| 138.00 | O | X | X | O | X | 4 | X | O | X | O | X | O | X | X | X | • | 138.00 | |||||||||||||||||||||||||||||||||||||
| 136.00 | O | X | O | X | O | X | O | X | O | X | O | X | O | X | O | X | O | X | • | 136.00 | ||||||||||||||||||||||||||||||||||
| 134.00 | O | X | O | X | O | O | X | O | X | O | O | X | O | X | O | X | • | 134.00 | ||||||||||||||||||||||||||||||||||||
| 132.00 | O | X | O | X | O | X | O | X | O | • | O | • | O | X | • | 132.00 | ||||||||||||||||||||||||||||||||||||||
| 130.00 | O | O | X | O | O | X | • | • | O | X | • | 130.00 | ||||||||||||||||||||||||||||||||||||||||||
| 128.00 | O | X | X | O | • | O | X | • | 128.00 | |||||||||||||||||||||||||||||||||||||||||||||
| 126.00 | O | X | O | X | • | O | X | • | 126.00 | |||||||||||||||||||||||||||||||||||||||||||||
| 124.00 | O | X | O | X | • | O | X | • | 124.00 | |||||||||||||||||||||||||||||||||||||||||||||
| 122.00 | O | X | O | X | • | O | X | • | 122.00 | |||||||||||||||||||||||||||||||||||||||||||||
| 120.00 | O | O | X | X | • | O | X | • | 120.00 | |||||||||||||||||||||||||||||||||||||||||||||
| 118.00 | O | X | O | X | • | O | • | 118.00 | ||||||||||||||||||||||||||||||||||||||||||||||
| 116.00 | O | X | O | X | • | • | 116.00 | |||||||||||||||||||||||||||||||||||||||||||||||
| 114.00 | O | X | O | X | • | 114.00 | ||||||||||||||||||||||||||||||||||||||||||||||||
| 112.00 | O | X | O | X | • | 112.00 | ||||||||||||||||||||||||||||||||||||||||||||||||
| 110.00 | O | X | O | X | • | 110.00 | ||||||||||||||||||||||||||||||||||||||||||||||||
| 108.00 | O | O | • | 108.00 | ||||||||||||||||||||||||||||||||||||||||||||||||||
| 20 |
| AMD Advanced Micro Devices, Inc. ($97.21) - Semiconductors - AMD moved higher Tuesday to break a double top at $96 before continuing to a new all-time high at $97 intraday. This 3 for 5'er moved to a positive trend last month and has been on an RS buy signal against the market since mid-2018. The overall technical picture remains positive here and is improving. Initial support is offered at $90, with further support offered at $84. |
| BEEM Beam Global ($38.30) - Finance - BEEM shares moved higher today to break a spread triple top at $38 to mark its second consecutive buy signal. This 5 for 5'er has been in a positive trend since October and on an RS buy signal versus the market since July. Recent price action has put BEEM into heavily overbought territory, so those wishing to initiate a long position may be best served to wait for a pullback or price normalization. From here, support can be found at $33. |
| EEFT Euronet Services Inc. ($138.12) - Finance - EEFT shares moved higher today to break a double top at $138 to mark its fourth consecutive buy signal. This 5 for 5'er has been in a positive trend since November and on an RS buy signal versus the market since October of 2018. Recent price action has put EEFT into heavily overbought territory, so those wishing to initiate a long position may be best served to wait for a pullback or price normalization. From here, support can be found at $128. |
| FAST Fastenal Company ($49.83) - Building - Shares of FAST broke a spread triple top on Tuesday, resulting in a second consecutive buy signal and new all-time chart high. The 4 for 5'er demonstrates favorable long-term relative strength versus the market, remaining on an RS buy signal for over a year and in a column of Xs since March of 2018. Demand is in control and FAST is actionable at current levels. Initial support is offered around $46. |
| FIVE Five Below Inc ($157.47) - Household Goods - After forming a double top at $166, FIVE broke a double bottom at $158, setting the chart up for a potential shakeout pattern. From here, the shakeout would be activated with a three box reversal up into Xs and would complete with a triple top buy signal at $168. FIVE is a 5 for 5’er within the favored household goods sector. |
| NVRO Nevro Corp. ($170.26) - Healthcare - NVRO shares pushed higher today to break a double top at $168 to return to a buy signal. This 4 for 5'er has been in a positive trend since April and on an RS buy signal versus the market since August of 2019. With a weekly overbought/oversold reading of 3%, NVRO is actionable at current levels. From here, support can be found at $160. |
| OKTA Okta Inc ($261.77) - Software - OKTA advanced Tuesday to break a double top at $256 before rising to a new all-time high at $264 intraday. This 5 for 5'er moved to a positive trend in March and sits in the top half of the software sector RS matrix. The stock has also maintained an RS buy signal against the market since February 2018. Weekly momentum recently flipped positive as well, suggesting the potential for further upside from here. Exposure may be considered at current levels, with initial support offered at $232. Further support may be found at $228 and $204. |
| SWI SolarWinds Corp. ($18.67) - Software - SWI fell Tuesday to break a double bottom at $19 before dropping to $18.50 intraday. This also broke through the bullish support line to place the stock in an overall negative trend, demoting it to a 0 for 5'er. Weekly momentum recently flipped negative as well, suggesting the potential for further downside from here. Long exposure should be avoided. Further support can be found at $17.50. Initial overhead resistance may come at the all-time high of $24 seen earlier this month. |
| WEX WEX Inc. ($199.62) - Business Products - WEX broke a double top Tuesday at $194, marking its fifth consecutive buy signal before reaching $200 intraday. This 3 for 5'er moved to a positive trend last month and ranks in the top half of the business products sector RS matrix. The overall weight of the evidence is positive here, however, the recent price appreciation has left WEX in overbought territory so those looking to add exposure would be best served to wait for a pullback or normalization of the trading band. Initial support can be found at $186, with further support offered in the $176 to $170 range. |
| Name | Option Symbol | Action | Stop Loss |
|---|---|---|---|
| QUALCOMM Incorporated - $148.36 | QCOM2119C140 | Buy the March 140.00 calls at 16.40 | 138.00 |
| Name | Option | Action |
|---|---|---|
| Weyerhaeuser Company ( WY) | Jan. 26.00 Calls | Initiate an option stop loss of 5.40 (CP: 7.40) |
| Viacom CBS Inc. ( VIAC) | Jan. 26.00 Calls | Stopped at 8.90 (CP: 8.85) |
| NIKE, Inc. ( NKE) | Apr. 130.00 Calls | Raise the option stop loss to 13.75 (CP: 15.70) |
| Apple Inc. ( AAPL) | Apr. 120.00 Calls | Initiate an option stop loss of 12.90 (CP: 14.90) |
| Name | Option Symbol | Action | Stop Loss |
|---|---|---|---|
| Jack Henry & Associates Inc - $158.60 | JKHY2119O160 | Buy the March 160.00 puts at 10.50 | 164.00 |
| Name | Option | Action |
|---|---|---|
|
|
||
| Name | Option Sym. | Call to Sell | Call Price | Investment for 500 Shares | Annual Called Rtn. | Annual Static Rtn. | Downside Protection |
|---|---|---|---|---|---|---|---|
| Mosaic Company $22.68 | MOS2119C25 | Mar. 25.00 | 1.52 | $10,923.20 | 51.94% | 22.64% | 5.51% |
| Name | Action |
|---|---|
| Marathon Petroleum Corp. (MPC) - 40.76 | Sell the April 45.00 Calls. |
| Phillips-Van Heusen Corporation (PVH) - 93.60 | Sell the March 90.00 Calls. |
| Comerica Incorporated (CMA) - 51.82 | Sell the April 57.50 Calls. |
| Delta Air Lines Inc. (DAL) - 40.69 | Sell the March 45.00 Calls. |
| General Motors (GM) - 41.62 | Sell the March 45.00 Calls. |
| KeyCorp (KEY) - 15.43 | Sell the March 16.00 Calls. |
| Name | Covered Write |
|---|---|
|
|
|
Daily Equity & Market Analysis
Loading, Please Wait...
