Looking at market returns in the first half of December vs. the second half of December.
We are excited to announce phase three of the Nasdaq Dorsey Wright Model Builder with the launch of Matrix and FSM-based Relative Strength (RS) Testing Service. As part of this launch, we are granting you free access to the service for the remainder of 2020. The tool is designed to help you more easily design, test, implement, and monitor custom models powered by the Nasdaq Dorsey Wright methodology. Through the end of December, be sure to join us each Thursday at 1 pm EST for a custom modeler demo presented by the analyst team.
11/19/2020: Static Model Builder Demo Replay - Click Here
12/9/2020: Matrix Model Builder Demo Replay - Click here
11/5/2020: FSM Model Builder Demo Replay - Click here
Click here to register for future Nasdaq Dorsey Wright Model Builder Demos
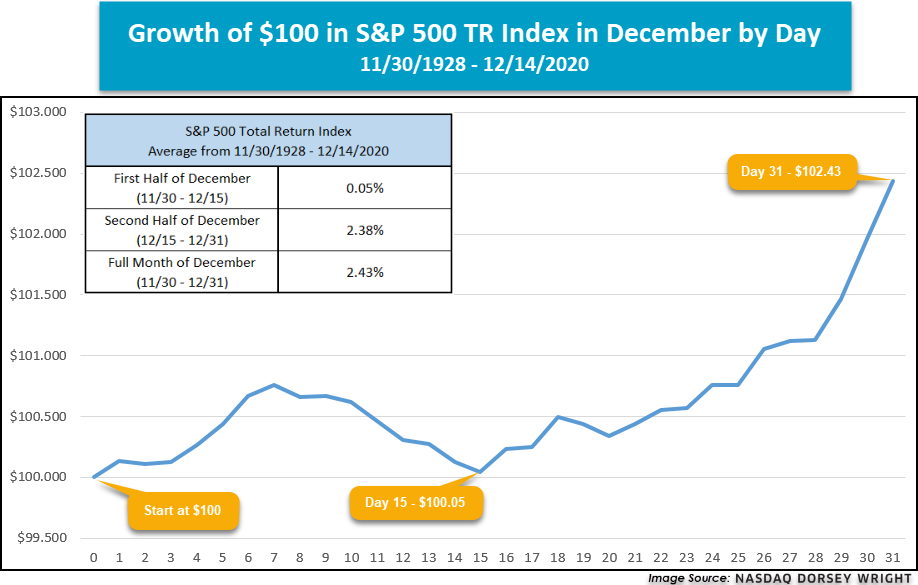
Historically, December is a strong month for the equity market, as we recently discussed in this article. Beyond the strong average performance for the month, there are a few other notable return patterns that have historically held true during December. For instance, it is often believed that much of the returns for the month come in the latter half of the month. To address the historical performance dispersion between the first half and second half of December, we have gathered the return data for the S&P 500 total return index TR.SPXX. We looked at the daily return of the index for every December going back to the end of 1928 and averaged the result for each day. For example, we took all the returns of 12/1 of each year and averaged them up. We repeated the same process for all 31 days in December. What we found is that the majority of December return does come from the second part of the month. As shown in the line graph below, if one were to invest $100 in the S&P 500 total return index, at the beginning of the month, 15 days into December that $100 investment will turn into $100.05, or a 0.05% gain. By the end of the month, which is 16 days later, that $100.05 grows to $102.43, which is an increase of 2.38%. That is almost 50 times the return of the first half of the month!