
Most Requested Symbols

Today's featured stock is The Toro Company (TTC)
APTV, BEPC, CROX, CRUS, KLAC, LRCX, PAYX, PTC, AVY, FCX, PRK, THRM, MOS, WSFS, PZZA, NEM, & DFS.
Call: The Gap Inc. (GPS), Put: Chevron Corp (CVX), Covered Write: Discover Financial (DFS)
The seasonal FSM models were evaluated based on market data through the close of Monday, Nov. 2nd, with model alerts sent out Tuesday morning, Nov. 3rd. These models have been updated with new holdings and rebalanced to their target weights. To see all of the FSM model changes, visit our model listing page and select FSM under Methodology and New Activities under the filter section. While there, be sure to click on the bell icon for any models you wish to receive alerts and stay up to date when any changes are made in the future.
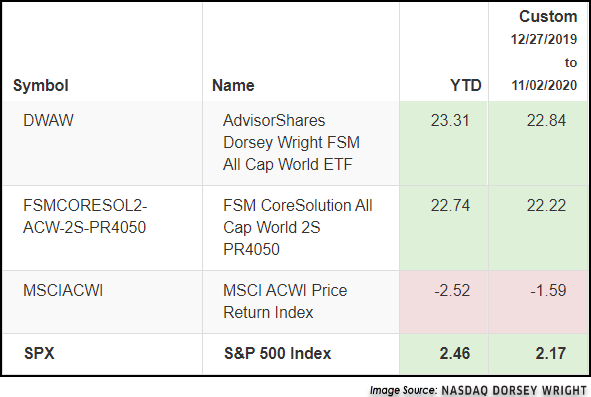
One of the changes we would like to highlight today is in the AdvisorShares Dorsey Wright FSM All Cap World ETF DWAW, which is based on the FSM CoreSolution All Cap World 2S PR4050 model. The strategy selects the first and second-ranked ETFs from a list of highly liquid, core based-funds including size and style ETFs, both domestic and international. However, the manner in which the ETF will raise cash is different. While the FSM model reviews the PR4050 offense/defense indicator on a monthly basis, the strategy for DWAW reviews the indicator weekly. If triggered, the strategy incrementally increases or decreases cash exposure by scaling into a defensive or offensive allocation (Source: AdvisorShares).
With this quarter’s evaluation, the Invesco QQQ Trust QQQ was sold and the iShares Morningstar Small Growth ETF JKK was bought. The current allocation is 50% in the iShares MorningStar Mid Growth ETF JKH and 50% in the iShares MorningStar Small Growth ETF JKK.
On a year-to-date basis as well as fund inception, both the model and model-based ETF have outperformed their benchmarks as shown below. On a technical basis, DWAW currently possesses a strong fund score of 4.20, which is above our optimal threshold.

(Source:etf.com)
Momentum Seasonality
December has historically been very strong for momentum, but November has been more of a mixed bag. Below are the average monthly returns of the momentum spread (Leaders minus Laggards):
Momentum Spread
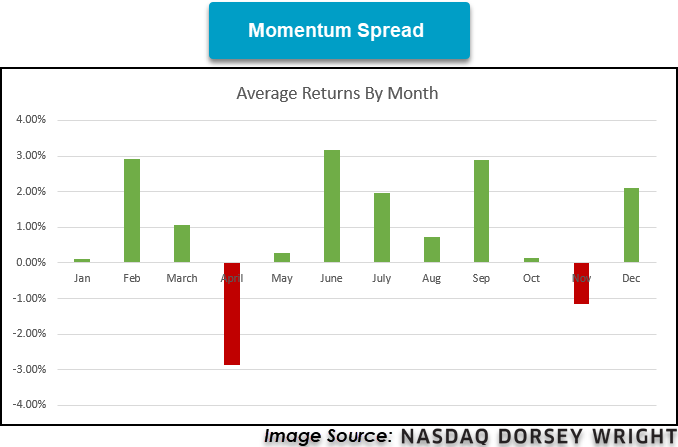
There are two outlier Novembers in 2001 (-14.9%) and 2002 (-25.8%) that skew the monthly average lower. Excluding those two months, the spread has a similar return in November to the return on January and October.
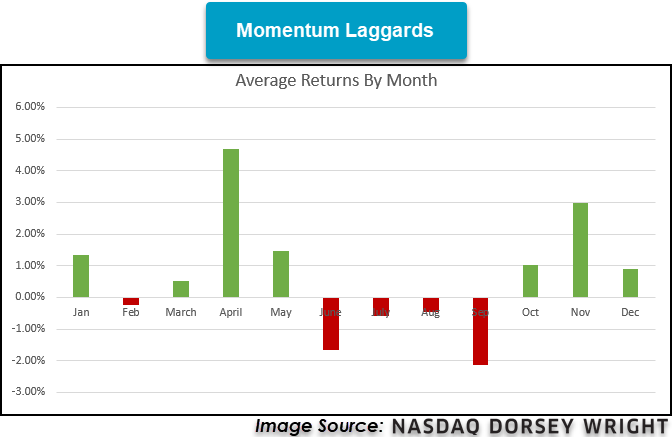
The low spread numbers are primarily driven by the returns of the laggard stocks. November is the second month for laggard stock returns. The same years (2001 and 2002) were particularly strong for the laggard names.
Momentum Laggards
Looking at high momentum stocks, November has actually been near the average of the other months.
Momentum Leaders
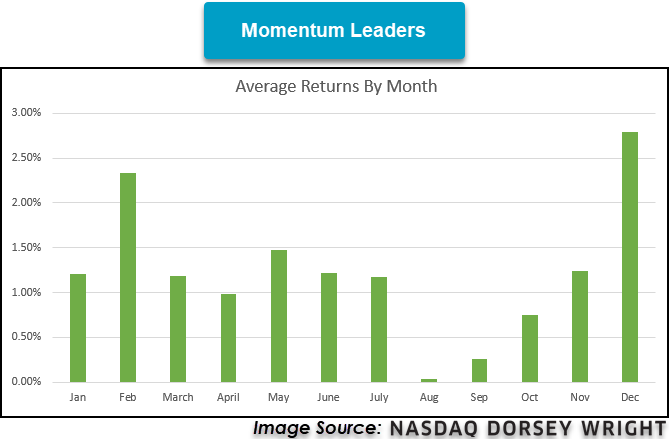
November has been a mixed back for the leader vs. laggard relationship. High momentum has generally performed well, but there have been a few bouts of large laggard outperformance. With the election occurring this year, we may have a volatile month for momentum, but that is not something that will happen for sure. Given that December has historically been the best month for momentum, it is prudent to take a wait-and-see attitude rather than proactively shedding high momentum names right before the historically strongest month of the year.

In Monday’s report, we updated our market seasonality study that employs original observations from Yale Hirsch to illustrate how substantive the performance bias has been within the “seasonally strong” half of the year when compared to the "seasonally weak" period. As of the close last Friday, we ended the seasonally weak period and officially moved into the strong season of the market (Nov 1st through April 30th). This year, the “seasonally weak” period was not particularly weak as the S&P 500 SPX was gained 12.28%, while the Nasdaq gained nearly 23% (on a price return basis from 4/30/20 through 10/30/20). However, the strong performance during the seasonally weak period came on the heels of the first quarter, which was one of the worst in recent memory. It isn’t easy to know when the market will buck a historical trend, and this is one of the reasons why we've put forth the concept of a seasonal "tilting" approach that employs "smart-beta" investment options. This is a way to incorporate a long-term, well-documented bias in the market, without resorting to an “all in or all out” strategy that many investors may find unpalatable. This strategy also provides an opportunity to further your own differentiation within the wealth management space as an expert in ETFs and their implementation.
Today, we will evaluate one of the more popular seasonal portfolios, which utilizes two complementary smart-beta products discussed often – the Invesco DWA Momentum ETF PDP and the Invesco S&P 500 Low Volatility Portfolio SPLV. These two products are based upon different return factors (High RS & Low Volatility), and as a result, they tend to have different holdings and short-term outcomes. When put together, these funds tend to have a complementary relationship, producing solid long-term returns, with a fairly low correlation of excess returns. This combination makes for an attractive US "core" equity solution and a starting point for a seasonal "tilting" strategy.
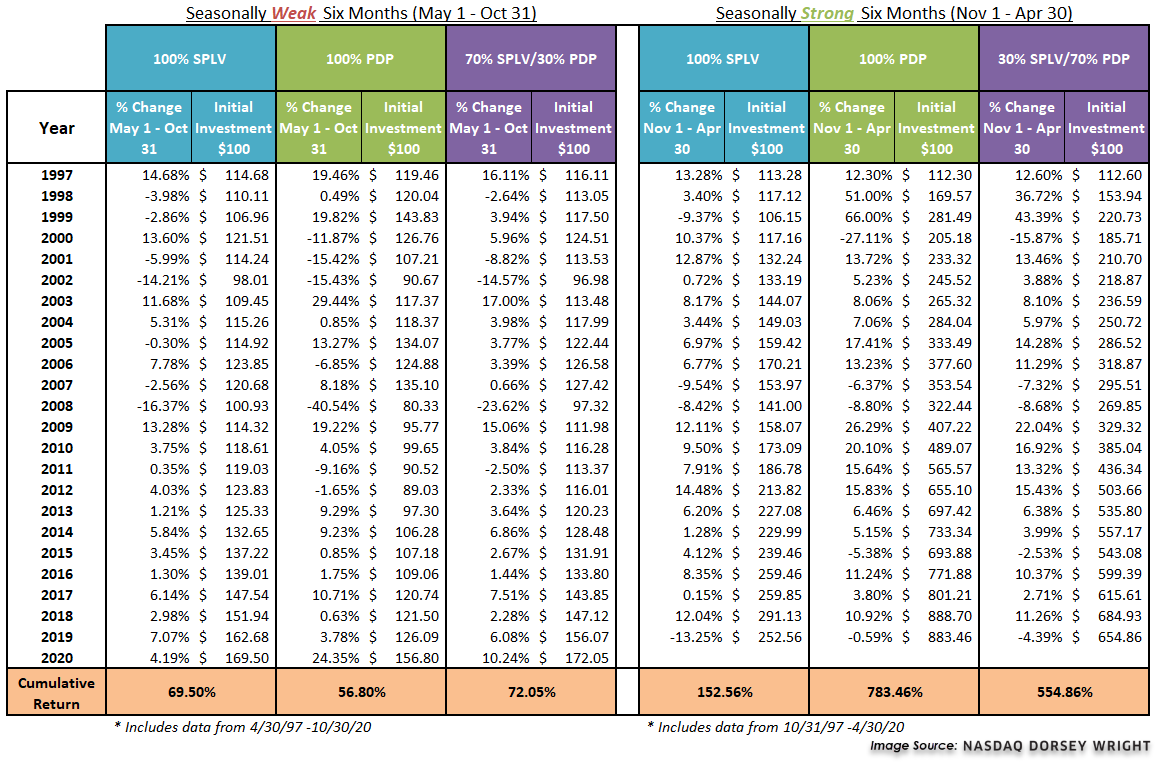
The basis for our strategy lies in the historical bias that having exposure to the market during the "seasonally strong" six months is a good thing, and having exposure to the market during the "seasonally weak" period has caused more headaches than beneficial returns. This year the common wisdom did not apply as each of the major US indices each posted positive returns and momentum outperformed low volatility during the weak period of the year. This year’s performance illustrates why a tilting approach is preferable to simply following the “sell in May and go away adage.” Not to mention that the idea of being completely out of the market for an entire six months every single year is not likely to get your clients excited, let alone prudent from a compliance standpoint. With that said, this strategy looks to overweight the strongest areas of the market during the "seasonally strong" period, and shift the overweight exposure to the more defensive, lower volatility names during the "seasonally weak" period. Specifically, this portfolio holds a 70% allocation to PDP and a 30% allocation to SPLV from November 1st - April 30th, and during the "seasonally weak" six months (May 1st through October 31st), the portfolio switches to 30% PDP and 70% SPLV.
As you can see in the table below, this year notwithstanding, SPLV has generally provided greater returns during the "seasonally weak" six months (cumulative return of +69.5% since 4/30/1997) than PDP (+56.8%) However, SPLV has notably lagged the return of PDP during the "seasonally strong" six months, up +152.56% compared to +783.46%, respectively. Therefore, a 30% PDP/70% SPLV split during the "seasonally weak" six months has seen a cumulative return of +72.05% while a 70% PDP/30% SPLV split during the "seasonally strong" six months has seen a return of +554.86%. Interestingly, the 70/30 portfolio has now outperformed both the SPLV and PDP on a cumulative basis during the seasonally weak periods since 1997.
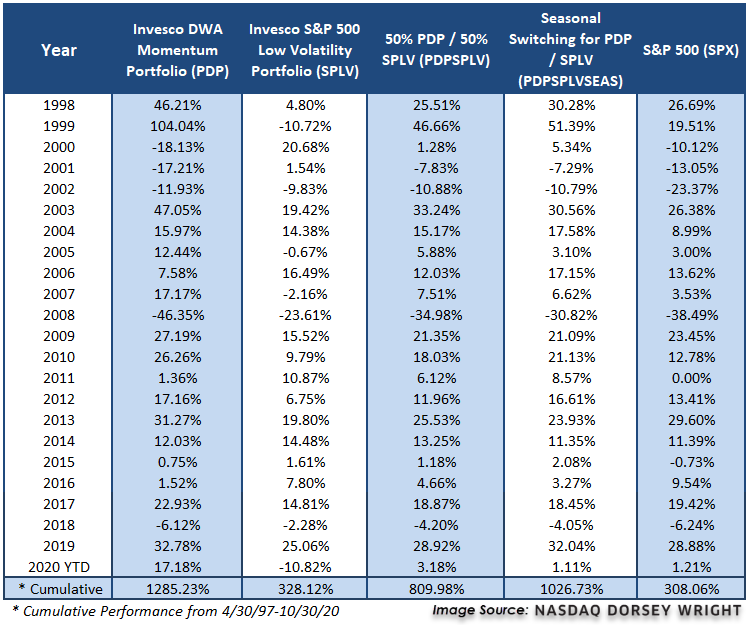
The table below shows the annual returns for each of the strategies. The PDPSPLVSEAS Strategy continues to outperform a simple 50/50 split between PDP and SPLV, as well as the S&P 500 Index SPX As mentioned above, the switching strategy also outperforms just SPLV but has trailed PDP over our study period, which has been amplified in 2020.
Legend:
PDP/SPLV Seasonal Switching Strategy – PDPSPLVSEAS - This portfolio is 70% PDP and 30% SPLV during the "seasonally strong" periods and switches to 30% PDP and 70% SPLV during the "seasonally weak" period.
S&P 500 Index – SPX
Invesco DWA Momentum Portfolio – PDP
50 / 50 PDP and SPLV – PDPSPLV - This portfolio is 50% PDP and 50% SPLV, rebalanced at the end of every year.
Invesco S&P Low Volatility ETF – SPLV
The table below shows the annual returns for each of the strategies. The PDPSPLVSEAS Strategy outperforms a simple 50/50 split between PDP and SPLV, as well as the S&P 500 Index SPX. As mentioned above, the switching strategy also outperforms just SPLV but has trailed PDP over our study period.
Disclosures:
Performance prior to each funds’ inception date are back-tested and based upon the underlying index shown below:
Inception date of PDP is 3/1/2007, prior to that all testing is based upon the DWA Technical Leaders Index.
Inception date of SPLV is 5/5/2011, prior to that all testing is based upon the S&P 500 Low Volatility Index.
Inception date of DWAS is 7/19/2012, prior to that all testing is based upon the DWA Small Cap Technical Leaders Index.
Inception date of XSLV is 2/15/2013, prior to that all testing is based upon the S&P 600 Low Volatility Index.
Inception date of PIE is 12/28/2007, prior to that all testing is based upon the DWA Emerging Markets Technical Leaders Index.
Inception date of EELV is 1/13/2012, prior to that all testing is based upon the S&P Emerging Markets Low Volatility Index.
Inception date of PIZ is 12/28/2007, prior to that all testing is based upon the DWA Developed Markets Technical Leaders Index.
Inception date of IDLV is 1/13/2012, prior to that all testing is based upon the S&P International Developed Low Volatility Index.
Returns for all models and benchmarks are Pure Price Returns, excluding dividends and transaction costs. Returns within the model portfolios are a result of back-testing. Back-tested performance is hypothetical and is provided for informational purposes to illustrate the effects of the strategy during a specific period. The hypothetical returns have been developed and tested by DWA, but have not been verified by any third party and are unaudited. Back-testing performance differs from actual performance because it is achieved through retroactive application of a model investment methodology designed with the benefit of hindsight. Model performance data (both back-tested and live) does not represent the impact of material economic and market factors might have on an investment advisor’s decision making process if the advisor were actually managing client money. Investors cannot invest directly in an index. Indexes have no fees. Past performance is not indicative of future results. Potential for profits is accompanied by possibility of loss.
The relative strength strategy is NOT a guarantee. There may be times where all investments and strategies are unfavorable and depreciate in value. Relative Strength is a measure of price momentum based on historical price activity. Relative Strength is not predictive and there is no assurance that forecasts based on relative strength can be relied upon.
VictoryShares Model Changes
Beginning with the VictoryShares (VS) Equity Rotation Model, the strategy sold the VictoryShares Dividend Accelerator ETF VSDA because it fell out of the top two positions in the model’s relative strength matrix and purchased the VictoryShares US Small Cap Volatility Wtd ETF CSA as it was the next highest-ranking fund not currently in the model. We observe a notable tailwind behind small-cap equities, present in CSA as well given its acceptable fund score of 3.20 and strongly positive score direction of 2.70. The VS Equity Rotation Model maintains a heavily tilt toward domestic equities yet leans toward small-cap value and small-cap blend exposure. This marks the model’s fifth trade this year.... (Read more)
Invesco Changes: GUGGEWSECT & POWER4
There are changes to two Invesco models this week. The DWA Sector 4 Model POWER4 bought the Invesco DWA Industrials Momentum ETF PRN and sold the Invesco DWA Basic Materials Momentum ETF PYZ. PYZ was removed from the model because materials fell out of the top four in the model’s sector rankings. In place of PYZ, the model added PRN because industrials moved into the top four sectors in the rankings. In addition to industrials, the model also has exposure to consumer cyclicals, healthcare, and technology. This is the eleventh change to the model this year. Year-to-date (through 10/30), POWER4 has returned 2.1%, outpacing the S&P 500 SPX, which is up 1.21%, by about 90 basis points... (Read more)
ETF Highlight: iShares MSCI South Korea ETF (EWY)
There are no changes to any of the iShares models this week. As discussed in Tuesday’s report, We have recently seen strength in emerging markets as the iShares Emerging Markets ETF EEM has outperformed the S&P 500 SPX over the last month and the average score of the emerging markets group has moved above 4.0. From a geographical perspective, Asian Pacific countries have been one of the major drivers of the recent strength of emerging markets.... (Read more)

Average Level
-25.27
| AGG | iShares US Core Bond ETF |
| USO | United States Oil Fund |
| DIA | SPDR Dow Jones Industrial Average ETF |
| DVY | iShares Dow Jones Select Dividend Index ETF |
| DX/Y | NYCE U.S.Dollar Index Spot |
| EFA | iShares MSCI EAFE ETF |
| FXE | Invesco CurrencyShares Euro Trust |
| GLD | SPDR Gold Trust |
| GSG | iShares S&P GSCI Commodity-Indexed Trust |
| HYG | iShares iBoxx $ High Yield Corporate Bond ETF |
| ICF | iShares Cohen & Steers Realty ETF |
| IEF | iShares Barclays 7-10 Yr. Tres. Bond ETF |
| LQD | iShares iBoxx $ Investment Grade Corp. Bond ETF |
| IJH | iShares S&P 400 MidCap Index Fund |
| ONEQ | Fidelity Nasdaq Composite Index Track |
| QQQ | Invesco QQQ Trust |
| RSP | Invesco S&P 500 Equal Weight ETF |
| IWM | iShares Russell 2000 Index ETF |
| SHY | iShares Barclays 1-3 Year Tres. Bond ETF |
| IJR | iShares S&P 600 SmallCap Index Fund |
| SPY | SPDR S&P 500 Index ETF Trust |
| TLT | iShares Barclays 20+ Year Treasury Bond ETF |
| GCC | WisdomTree Continuous Commodity Index Fund |
| VOOG | Vanguard S&P 500 Growth ETF |
| VOOV | Vanguard S&P 500 Value ETF |
| EEM | iShares MSCI Emerging Markets ETF |
| XLG | Invesco S&P 500 Top 50 ETF |
| Symbol | Company | Sector | Current Price | Action Price | Target | Stop | Notes |
|---|---|---|---|---|---|---|---|
| LOW | Lowe's Companies, Inc. | Building | $160.23 | 170s to low 180s | 230 | 150 | 5 for 5'er, top half of favored BUI sector matrix, quad top breakout, pos wkly mom flip, LT pos mkt RS, 1.4% yield Earnings 11/18 |
| CDNS | Cadence Design Systems, Inc. | Software | $110.51 | upper $110s to low $120s | $159 | $90 | 5 for 5'er, pullback from all-time high, LT market RS buy signal, pos weekly momentum |
| AVGO | Broadcom Ltd | Semiconductors | $351.25 | 360s - 380s | 468 | 300 | 4 for 5'er, top 20% of SEMI sector matrix, triple top breakout, 3.5% yield |
| APH | Amphenol Corporation | Electronics | $115.07 | mid 100s to upper 110s | 152 | 93 | 5 for 5'er, all-time high, LT market & peer RS buy signal, 2 weeks pos weekly mom |
| AN | Autonation Inc. | Autos and Parts | $57.79 | hi 50s - low 60s | 100 | 50 | 5 for 5'er, top 10% of favored AUTO sector matrix, pullback from ATH, pot cov. write R-R>3.0 |
| SCHN | Schnitzer Steel Industries | Steel/Iron | $21.68 | 19 - 21 | 32.50 | 16.50 | 3 for 5'er, top half of favored STEE sector matrix, bullish catapult, 3.7% yield, R-R>3.0 |
| RCII | Rent-A-Center, Inc. | Retailing | $30.59 | low to mid 30s | 65 | 24 | 5 for 5'er, 5 consec buy signals, LT peer RS buy, pos weekly & mon momentum, 3.59% yield |
| LH | Laboratory Corp. of America Holdings | Healthcare | $207.23 | 190s - low 200s | 216 | 170 | 4 for 5'er, top half of HEAL sector matrix, LT pos mkt RS, pullback from ATH |
| R | Ryder System, Inc. | Transports/Non Air | $49.69 | hi 40s - low 50s | 63 | 40 | 4 for 5'er, top 20% on TRAN sector matrix, multiple buy signals, 4.4% yield, pot. covered write |
| TTC | The Toro Company | Machinery and Tools | $83.12 | low to high 80s | 126 | 70 | 4 for 5'er, consec buy signals, LT market and peer RS buy signal, 1.22% yield |
| Symbol | Company | Sector | Current Price | Action Price | Target | Stop | Notes |
|---|
| Symbol | Company | Sector | Current Price | Action Price | Target | Stop | Notes |
|---|---|---|---|---|---|---|---|
| ARNC | Arconic Corp. | Metals Non Ferrous | $22.56 | low 20s | 29.50 | 18 | See follow comment below. |
| Comment |
|---|
| TSM Taiwan Semiconductor Manufacturing Co. R (Taiwan) ADR ($87.95) - Semiconductors - Raise stop to $75, which would violate multiple support levels on TSM's default chart. |
| TFC Truist Financial Corp R ($44.47) - Banks - Raise stop to $37, the bullish support line. |
| HOLX Hologic Incorporated R ($71.59) - Healthcare - Raise stop to $59, which would violate multiple levels of support on HOLX's default chart. |
| NXST Nexstar Media Group Inc. R ($87.49) - Media - NXST hit our stop. We will exit on today's bounce. |
| DVA DaVita, Inc. R ($93.22) - Healthcare - Raise stop to $75, which would violate multiple support levels on DVA's default chart |
| ARNC Arconic Corp. R ($23.20) - Metals Non Ferrous - Okay to add new exposure here. We will maintain our $!8 stop. Note earnings are expected on 11/5. |
TTC The Toro Company R ($84.64) - Machinery and Tools - TTC is a strong 4 for 5’er within the favored machinery and tools sector that has maintained a long-term market RS buy signal since May 2010. In addition, TTC has maintained a long-term peer RS buy signal since July 2012 and continues to trade in a positive trend. In July, TTC returned to a buy signal at $69 before giving a second consecutive buy signal at $85 in September. After rallying to $88 last month, which marked a new all-time high for the stock, TTC pulled back to support at $81. With today’s market action, TTC has reversed back up into Xs. Okay to add new exposure in the low to high 80s. We will set our initial stop at $70, the bullish support line, and will use TTC’s bullish price objective of $126 as our near-term price target. Note TTC offers a 1.22% yield.
| 19 | 20 | |||||||||||||||||||||||||||||||||||||||||||||||||||||
| 88.00 | X | 88.00 | ||||||||||||||||||||||||||||||||||||||||||||||||||||
| 87.00 | X | O | 87.00 | |||||||||||||||||||||||||||||||||||||||||||||||||||
| 86.00 | A | O | 86.00 | |||||||||||||||||||||||||||||||||||||||||||||||||||
| 85.00 | • | X | X | O | x | 85.00 | ||||||||||||||||||||||||||||||||||||||||||||||||
| 84.00 | X | • | • | X | O | X | X | O | b | 84.00 | ||||||||||||||||||||||||||||||||||||||||||||
| 83.00 | X | O | 2 | • | X | O | X | O | X | O | x | 83.00 | ||||||||||||||||||||||||||||||||||||||||||
| 82.00 | X | O | X | O | • | X | O | X | O | X | O | x | Mid | 82.00 | ||||||||||||||||||||||||||||||||||||||||
| 81.00 | X | 1 | O | X | O | • | X | O | O | O | 81.00 | |||||||||||||||||||||||||||||||||||||||||||
| 80.00 | X | O | X | O | O | • | X | 80.00 | ||||||||||||||||||||||||||||||||||||||||||||||
| 79.00 | C | O | X | O | • | X | 79.00 | |||||||||||||||||||||||||||||||||||||||||||||||
| 78.00 | B | O | X | O | • | X | 78.00 | |||||||||||||||||||||||||||||||||||||||||||||||
| 77.00 | X | O | X | O | X | • | 9 | 77.00 | ||||||||||||||||||||||||||||||||||||||||||||||
| 76.00 | X | O | X | O | X | O | • | X | 76.00 | |||||||||||||||||||||||||||||||||||||||||||||
| 75.00 | 5 | X | X | X | O | X | O | X | O | X | • | X | 75.00 | |||||||||||||||||||||||||||||||||||||||||
| 74.00 | X | O | X | O | X | O | X | O | X | O | 3 | O | X | O | • | X | 8 | Bot | 74.00 | |||||||||||||||||||||||||||||||||||
| 73.00 | X | O | X | X | O | 9 | O | X | O | O | X | O | X | O | • | X | O | X | 73.00 | |||||||||||||||||||||||||||||||||||
| 72.00 | X | O | X | O | X | O | X | O | X | O | X | O | X | O | • | X | O | X | 72.00 | |||||||||||||||||||||||||||||||||||
| 71.00 | X | O | X | O | X | O | X | A | O | O | X | O | • | X | X | O | X | 71.00 | ||||||||||||||||||||||||||||||||||||
| 70.00 | 4 | O | X | 8 | O | X | O | X | O | X | • | X | O | X | O | X | X | • | 70.00 | |||||||||||||||||||||||||||||||||||
| 69.00 | X | O | X | X | O | O | X | O | X | O | • | X | O | X | O | X | O | X | • | 69.00 | ||||||||||||||||||||||||||||||||||
| 68.00 | X | O | 6 | O | X | O | • | O | X | O | • | • | X | 6 | O | X | O | X | X | • | 68.00 | |||||||||||||||||||||||||||||||||
| 67.00 | X | O | X | O | X | • | • | O | X | O | X | • | X | • | X | O | X | O | 7 | O | X | • | 67.00 | |||||||||||||||||||||||||||||||
| 66.00 | X | O | X | 7 | X | • | O | X | O | X | X | O | X | X | X | O | • | X | O | O | X | O | X | • | 66.00 | |||||||||||||||||||||||||||||
| 65.00 | X | O | O | • | O | X | O | X | O | X | O | X | O | X | O | X | O | X | • | X | O | X | O | • | 65.00 | |||||||||||||||||||||||||||||
| 64.00 | X | • | O | X | O | X | O | X | O | X | O | X | O | X | O | X | O | X | O | • | • | 64.00 | ||||||||||||||||||||||||||||||||
| 63.00 | X | • | O | X | O | X | 4 | X | O | O | O | X | 5 | X | O | X | • | 63.00 | ||||||||||||||||||||||||||||||||||||
| 62.00 | X | • | O | X | O | X | O | O | X | O | X | O | X | • | 62.00 | |||||||||||||||||||||||||||||||||||||||
| 61.00 | 2 | • | O | X | O | X | O | • | O | • | O | X | • | 61.00 | ||||||||||||||||||||||||||||||||||||||||
| 60.00 | X | • | O | X | O | X | X | • | • | O | X | • | 60.00 | |||||||||||||||||||||||||||||||||||||||||
| 59.00 | X | • | O | X | O | X | O | X | • | O | X | • | 59.00 | |||||||||||||||||||||||||||||||||||||||||
| 58.00 | O | X | • | O | O | X | O | X | • | O | • | 58.00 | ||||||||||||||||||||||||||||||||||||||||||
| 57.00 | O | 1 | • | O | X | O | X | • | • | 57.00 | ||||||||||||||||||||||||||||||||||||||||||||
| 56.00 | O | X | • | O | X | O | X | • | 56.00 | |||||||||||||||||||||||||||||||||||||||||||||
| 55.00 | O | X | • | O | X | O | X | • | 55.00 | |||||||||||||||||||||||||||||||||||||||||||||
| 54.00 | O | X | • | O | X | O | X | • | 54.00 | |||||||||||||||||||||||||||||||||||||||||||||
| 53.00 | O | • | O | O | • | 53.00 | ||||||||||||||||||||||||||||||||||||||||||||||||
| 19 | 20 |
| APTV Aptiv PLC ($102.35) - Autos and Parts - APTV returned to a buy signal on Tuesday with a double top breakout at $102. This stock is a 3 for 5’er within the favored autos and parts sector that is trading well above the bullish support line. Demand is in control. From here, support sits at $96 while APTV faces resistance at current levels. A move to $104 would mark a new all-time high for the stock. |
| AVY Avery Dennison Corporation ($145.22) - Business Products - AVY gave a sixth consecutive buy signal in Tuesday's trading when it broke a double top at $146, which also marked a new all-time high for the fund. The stock is a perfect 5 for 5'er, has been on a market RS buy signal since 2015, and ranks in the top third of the business products sector matrix. AVY also comes with a 1.8% yield. Those considering long exposure should note that the stock is in heavily-overbought territory and thus may be best served to look for a pullback. |
| BEPC Brookfield Renewable Corporation Class A ($71.10) - Utilities/Electricity - BEPC broke a double top at $70 on Tuesday before moving higher to $71, marking the stock’s fourth consecutive buy signal as well as a new all-time high. BEPC is a 3 for 5’er within the utilities/electricity sector that offers a yield of 2.6%. From here, support sits at $63. Note BEPC is heavily overbought at current levels. |
| CROX Crocs, Inc. ($55.02) - Textiles/Apparel - CROX broke a double top at $56, marking the stock’s sixth consecutive buy signal as well as a new 52 week high. This stock is a perfect 5 for 5’er that ranks 2nd out of 22 names in the favored textiles & apparel sector matrix. CROX has maintained a long-term peer RS buy signal since February 2018 and continues to trade in an overall positive trend. From here, support sits at $52. |
| CRUS Cirrus Logic Inc ($69.64) - Semiconductors - Shares of CRUS moved higher Tuesday after their earnings release to break a double top at $74, before pulling back to around $70 intraday. This 3 for 5'er moved back to a positive trend last month and has maintained an RS buy signal against the market since August of 2019. The weight of the technical evidence continues to improve. Initial support can be found at $67. |
| DFS Discover Financial Services ($69.36) - Finance - DFS shares moved higher today to break a double top at $69 to mark its second consecutive buy signal. This 4 for 5'er has been in a positive trend since September and on an RS buy signal versus the market since May. DFS is actionable at current levels with a weekly overbought/oversold reading of 56%. From here, support can be found at $62. DFS offers a 2.71% yield. |
| FCX Freeport-McMoRan Inc. ($18.77) - Metals Non Ferrous - FCX gave a fourth consecutive buy signal on Tuesday when it broke a double top at $19. FCX is a 5 for 5'er and ranks in the top quintile of the metals non ferrous sector matrix. Those considering long exposure should be aware that today's move will put the stock in heavily-overbought territory. FCX has most recently found support at $17, with additional support at $15. |
| KLAC KLA Corp ($211.33) - Semiconductors - KLAC reversed up into a column of Xs Tuesday and broke a double top at $212, marking its fourth consecutive buy signal. This 4 for 5'er moved to a positive trend in September and has maintained an RS buy signal against the market since early-2011. Those looking to add exposure may consider KLAC on this breakout, with initial support offered at $196. Further support can be found at $192, which is also the current location of the bullish support line. |
| LRCX Lam Research Corporation ($371.68) - Semiconductors - LRCX continued higher Tuesday to break a double top at $360 before rising to $372 intraday. This 4 for 5'er moved to a positive trend last month and ranks in the top third of the semiconductors sector RS matrix. The weight of the evidence is once again improving. Exposure may be considered at current levels, with initial support offered at $340. Further support can be found at $336. |
| MOS Mosaic Company ($17.19) - Chemicals - MOS fell to a sell signal Tuesday when it broke a spread quadruple bottom taking out support that had been in place since September. Although the technical picture remains positive - MOS is a 5 for 5'er and ranks sixth out of 48 names in the chemicals sector matrix, the violation of notable support could be a cause for concern. From here, the next level of support is $16, where MOS's bullish support line currently sits. |
| NEM Newmont Corp ($66.67) - Precious Metals - NEM returned to a buy signal and positive overall trend when it broke a triple top at $65 in Tuesday's trading; a move which will elevate it to a 4 for 5'er. The stock now faces several levels of overhead resistance in the high $60s and low $70s. Those interested in adding exposure may do so here. NEM has most recently found support at $59 and comes with a 2.55% yield. |
| PAYX Paychex, Inc. ($86.55) - Business Products - Shares of PAYX advanced Tuesday to break a double top at $86, marking a fourth consecutive buy signal. This 3 for 5'er moved to a positive trend in April and ranks in the top half of the business products sector RS matrix. The weight of the evidence is becoming increasingly positive, however, the recent price appreciation has led the stock into overbought territory so those looking to add exposure would be best served to wait for a pullback or normalization of the trading band. Initial support can be found at $80; further support is offered at $76 and $75, which is also the current location of the bullish support line. Note that PAYX carries a 3.02% yield. |
| PRK Park National Corp ($96.18) - Banks - PRK shares moved higher today to break a double top at $96 to mark its second consecutive buy signal. This 4 for 5'er has been in a positive trend since July and on an RS buy signal versus its peer group since March. PRK is actionable at current levels with a weekly overbought/oversold reading of 29%. From here, support can be found at $88. Note that PRK offers a 4.45% yield. |
| PTC PTC Inc ($91.75) - Software - PTC continued higher Tuesday to break a double top at $88, returning the stock to an overall positive trend before it marched higher through further resistance at $89 and $91 to reach $92 intraday. Now a 4 for 5'er, this stock has been on an RS buy signal against the market since mid-2008 and ranks in the top half of the software sector RS matrix. Weekly and monthly momentum are each positive as well. Long exposure may be considered at current levels, with initial support offered at $83 and further support offered at $80. Further overhead resistance may be found at the September high of $97. |
| PZZA Papa Johns Intl Inc ($74.66) - Restaurants - PZZA broke a double bottom at $74 on Tuesday, marking the second consecutive sell signal on the chart. PZZA is an unacceptable 1 for 5'er that ranks 24th out of 27 names in the restaurants sector RS matrix. Monthly momentum has been negative for two months and PZZA is trading in a negative trend. Avoid as supply is in control. |
| THRM Gentherm Inc. ($49.24) - Autos and Parts - THRM broke a double top at $48 before moving higher to $49, marking the second consecutive buy signal on the chart. THRM is a 4 for 5'er that has maintained a long-term market RS buy signal since August 2018. In addition, weekly momentum has been positive for four weeks while monthly momentum has been positive for four months. Demand is in control. From here, support sits at $39, the bullish support line. |
| WSFS WSFS Financial Corp. ($34.38) - Banks - WSFS shares pushed higher today to break a double top at $34 to mark its third consecutive buy signal. This 4 for 5'er has been in a positive trend since August and on an RS buy signal versus its peer group since May of 2010. WSFS is actionable at current levels with a weekly overbought/oversold reading of 52% From here, support can be found at $30. |
| Name | Option Symbol | Action | Stop Loss |
|---|---|---|---|
| The Gap, Inc. - $20.96 | GPS2115A20 | Buy the January 20.00 calls at 3.10 | 18.00 |
| Name | Option | Action |
|---|---|---|
| Mosaic Company ( MOS) | Jan. 18.00 Calls | Stopped at 17.00 (CP: 17.16) |
| Discover Financial Services ( DFS) | Jan. 62.50 Calls | Raise the option stop loss to 7.70 (CP: 9.70) |
| Target Corporation ( TGT) | Jan. 145.00 Calls | Initiate an option stop loss of 14.30 (CP: 16.30) |
| Name | Option Symbol | Action | Stop Loss |
|---|---|---|---|
| Chevron Corporation - $71.73 | CVX2115M75 | Buy the January 75.00 puts at 7.90 | 77.00 |
| Name | Option | Action |
|---|---|---|
| Vornado Realty Trust (VNO) | Dec. 40.00 Puts | Stopped at 8.00 (CP: 6.50) |
| CommScope Holding Company, Inc. (COMM) | Nov. 11.00 Puts | Initiate a stock price stop of 10.50 (CP: 9.54) |
| Baxter International Inc. (BAX) | Jan. 85.00 Puts | Initiate a stock price stop of 83.00 (CP: 77.27) |
| Fluor Corporation (FLR) | Jan. 12.50 Puts | Stopped at 13.00 (CP: 13.14) |
| Baker Hughes Company (BKR) | Jan. 15.00 Puts | Stopped at 16.00 (CP: 15.86) |
| Name | Option Sym. | Call to Sell | Call Price | Investment for 500 Shares | Annual Called Rtn. | Annual Static Rtn. | Downside Protection |
|---|---|---|---|---|---|---|---|
| Discover Financial Services $67.21 | DFS2115A70 | Jan. 70.00 | 5.60 | $32,254.80 | 37.18% | 37.59% | 6.99% |
| Name | Action |
|---|---|
| The Chemours Company (CC) - 20.88 | Sell the January 23.00 Calls. |
| L Brands Inc. (LB) - 33.02 | Sell the January 35.00 Calls. |
| Phillips-Van Heusen Corporation (PVH) - 59.77 | Sell the January 65.00 Calls. |
| General Motors (GM) - 34.55 | Sell the January 37.00 Calls. |
| QUALCOMM Incorporated (QCOM) - 123.97 | Sell the January 130.00 Calls. |
| Big Lots, Inc. (BIG) - 47.25 | Sell the January 52.50 Calls. |
| The Gap, Inc. (GPS) - 20.83 | Sell the January 23.00 Calls. |
| Steel Dynamics Inc. (STLD) - 31.89 | Sell the February 32.00 Calls. |
| Ryder System, Inc. (R) - 49.69 | Sell the February 52.50 Calls. |
| Name | Covered Write |
|---|---|
| Fifth Third Bancorp ( FITB - 24.11 ) | February 24.00 covered write. |
Daily Equity & Market Analysis
Loading, Please Wait...
