
As we move into the month of November, we are once again reminded of the tendencies of market seasonality.
With the start of November, we have also officially moved into the “seasonally strong” half of the year, which lasts from November through May. We are all familiar with the saying "sell in May and go away," which conjectures that we would do just as well to sell all of our holdings as we would be invested in the market during the months of May through November. Typically, conjecture doesn’t mature into an adage without basis and market seasonality is just such an example as it has shown an impressive trend in terms of magnitude, consistency, and longevity. We’ve discussed seasonality many times over the years and as we switch between seasonally biased periods, we wanted to revisit the subject today.
The end of the day’s trading on Friday, October 30 also brought with it the end of the seasonally weak period, which began with the close of the market on Thursday, April 30. Over this period, the Dow Jones Industrial Average DJIA returned 8.86%, which is well above the average return during the seasonally week period.
Years ago, we began using the Stock Trader's Almanac, a reference tool published by Yale Hirsch that has been a fantastic source of information on the stock market ever since. In fact, we always order several copies for the office each year (if you would like a copy, you can visit www.stocktradersalmanac.com). The premise of the "Market Seasonality" study is that historically speaking, the market performs far better during the November through May time period than it does from May through November. On its own, that isn't a particularly profound statement, however, when we examine the magnitude of this effect over the years, its significance becomes clear. Consider this: if you had invested $10,000 in the Dow Jones on April 30 and sold it on October 31 each year since 1950, your cumulative return would be only about $12,750. Meanwhile, the same $10,000, invested only during the seasonally strong six months of the year, would now be worth just under $1 million! Put another way, almost all the growth of the Dow since 1950 has effectively occurred during the "good" six months of the year.
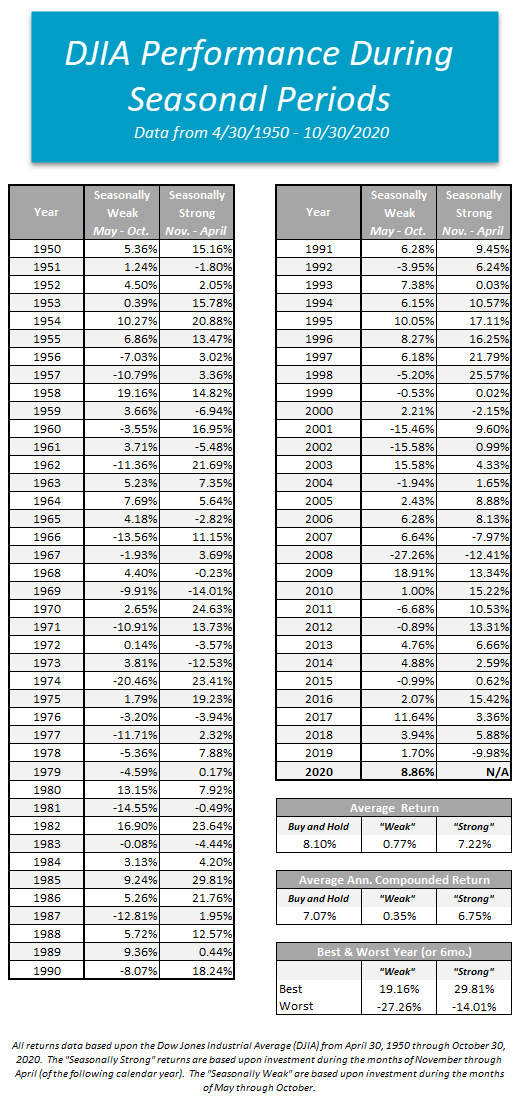
In the graph below, we have reproduced the US Market Seasonality strategy that was first published in the Stock Trader's Almanac beginning in 1950 based upon the Dow Jones Industrial Average. The green line reflects the seasonally weak period, while the red line shows the seasonally strong six months. You will note that a theoretical $10,000 initial investment in 1950 is barely on the positive side when invested only from May through November. On the other hand, an identical $10,000 initial investment grew to $972,201 with an average annualized return of 6.75% if invested only from November through May each year.

There's no question that the November through May period has provided substantially better returns. Whether you average it out, annualize it, compound it, or complicate it further; there is clearly a widespread between the average six-month returns during these contrasting seasonal periods.
Market Seasonality Notes:
- Since April 30, 2000, the Dow Jones Industrial Average has gained over 146%. However, the Dow is up just over 27% when we isolate the seasonally weak periods since 1950.
- During the seasonally weak May to November periods, 27 out of the 70 years examined finished down, while there were only 15 years during which the seasonally strong period produced a negative return.
- There have been only three years when the "good six months" have lost more than 10% (1969, 1973, and 2008), while the "bad six months" have seen losses of 10% or more 11 times.
- There have been 15 instances since 1980 where the "good six months" have posted a double-digit return, with five of those returning more than 20%.
- Interestingly enough, following the times when the "bad six months" did produce double-digit losses (11 total since 1950), the "good six-month" period afterward lost more than 1% only once (2008) and on four occasions, actually posted double-digit positive returns (1962, 1966, 1971, and 1974)
- Beginning in November 2009, the Dow experienced a streak of four consecutive positive double-digit efforts during the strong six-month periods, the second-longest such streak in history. The first began in 1994 where the Dow finished the seasonally strong period with double-digit gains for five consecutive periods.
We acknowledge that this study is not a sophisticated tool for risk management, but it is interesting and does expose biases within the market that many investors are not aware of. As we mentioned above, we are coming off a seasonally weak period in the market which saw the Dow produce a gain of 8.86%, well above the average return of 0.77%. Despite the elevated volatility felt throughout the most recent seasonally weak period due to the uncertainty surrounding the coronavirus pandemic, tomorrow’s US presidential election, and stimulus talks, among other things, the US equities asset class strengthened enough to move back into the top spot in DALI in August where it remains today with 272 buy signals in its favor. Furthermore, with today’s (11/2) action, we have seen the S&P 500 bounce after falling -5.64% over the last seven days, which marked the worst single week for the index since March. Today’s move to 3,330 has caused a reversal up into Xs on the SPX, which remains on a sell signal trading in an overall positive trend. Additionally, the Bullish Percent for NYSE BPNYSE, which reversed down into Os last week, ticked lower to 46% after Friday’s market action, giving us a more defensive posture on a near-term basis despite a solid longer-term ranking. That said, although we are now entering what has been the traditionally strong period for the market, this does not guarantee that we will see a strong equity market over the next six months. It does, however, provide an opportunity to consider seasonal strategies that can position portfolios to take advantage of these historical biases. We will discuss a few such strategies in this report over the next couple of days.
