
With last Friday's close, we have shifted once again to the strong season of the market (Nov 1st - through April 30). Today, we will evaluate one of the more popular seasonal portfolios, the Seasonal Switching Portfolio for PDP/SPLV (PDPSPLVSEAS).
In Monday’s report, we updated our market seasonality study that employs original observations from Yale Hirsch to illustrate how substantive the performance bias has been within the “seasonally strong” half of the year when compared to the "seasonally weak" period. As of the close last Friday, we ended the seasonally weak period and officially moved into the strong season of the market (Nov 1st through April 30th). This year, the “seasonally weak” period was not particularly weak as the S&P 500 SPX was gained 12.28%, while the Nasdaq gained nearly 23% (on a price return basis from 4/30/20 through 10/30/20). However, the strong performance during the seasonally weak period came on the heels of the first quarter, which was one of the worst in recent memory. It isn’t easy to know when the market will buck a historical trend, and this is one of the reasons why we've put forth the concept of a seasonal "tilting" approach that employs "smart-beta" investment options. This is a way to incorporate a long-term, well-documented bias in the market, without resorting to an “all in or all out” strategy that many investors may find unpalatable. This strategy also provides an opportunity to further your own differentiation within the wealth management space as an expert in ETFs and their implementation.
Today, we will evaluate one of the more popular seasonal portfolios, which utilizes two complementary smart-beta products discussed often – the Invesco DWA Momentum ETF PDP and the Invesco S&P 500 Low Volatility Portfolio SPLV. These two products are based upon different return factors (High RS & Low Volatility), and as a result, they tend to have different holdings and short-term outcomes. When put together, these funds tend to have a complementary relationship, producing solid long-term returns, with a fairly low correlation of excess returns. This combination makes for an attractive US "core" equity solution and a starting point for a seasonal "tilting" strategy.
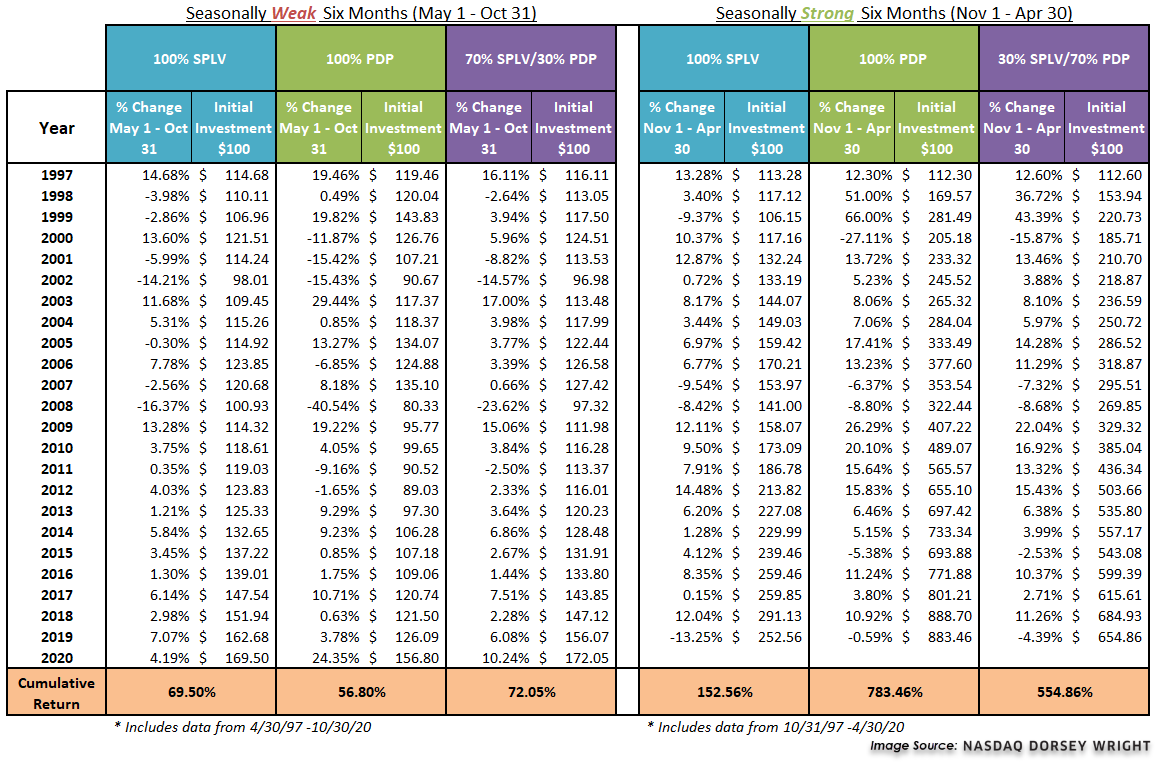
The basis for our strategy lies in the historical bias that having exposure to the market during the "seasonally strong" six months is a good thing, and having exposure to the market during the "seasonally weak" period has caused more headaches than beneficial returns. This year the common wisdom did not apply as each of the major US indices each posted positive returns and momentum outperformed low volatility during the weak period of the year. This year’s performance illustrates why a tilting approach is preferable to simply following the “sell in May and go away adage.” Not to mention that the idea of being completely out of the market for an entire six months every single year is not likely to get your clients excited, let alone prudent from a compliance standpoint. With that said, this strategy looks to overweight the strongest areas of the market during the "seasonally strong" period, and shift the overweight exposure to the more defensive, lower volatility names during the "seasonally weak" period. Specifically, this portfolio holds a 70% allocation to PDP and a 30% allocation to SPLV from November 1st - April 30th, and during the "seasonally weak" six months (May 1st through October 31st), the portfolio switches to 30% PDP and 70% SPLV.
As you can see in the table below, this year notwithstanding, SPLV has generally provided greater returns during the "seasonally weak" six months (cumulative return of +69.5% since 4/30/1997) than PDP (+56.8%) However, SPLV has notably lagged the return of PDP during the "seasonally strong" six months, up +152.56% compared to +783.46%, respectively. Therefore, a 30% PDP/70% SPLV split during the "seasonally weak" six months has seen a cumulative return of +72.05% while a 70% PDP/30% SPLV split during the "seasonally strong" six months has seen a return of +554.86%. Interestingly, the 70/30 portfolio has now outperformed both the SPLV and PDP on a cumulative basis during the seasonally weak periods since 1997.
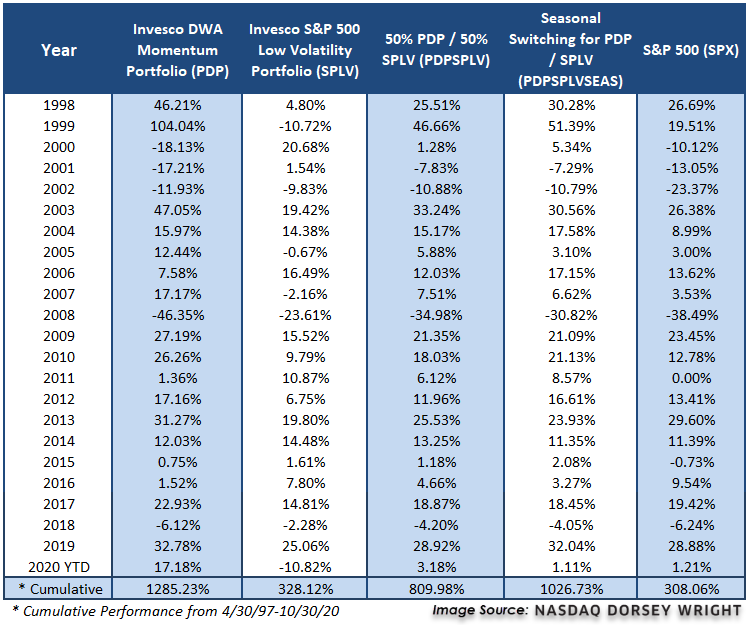
The table below shows the annual returns for each of the strategies. The PDPSPLVSEAS Strategy continues to outperform a simple 50/50 split between PDP and SPLV, as well as the S&P 500 Index SPX As mentioned above, the switching strategy also outperforms just SPLV but has trailed PDP over our study period, which has been amplified in 2020.
Legend:
PDP/SPLV Seasonal Switching Strategy – PDPSPLVSEAS - This portfolio is 70% PDP and 30% SPLV during the "seasonally strong" periods and switches to 30% PDP and 70% SPLV during the "seasonally weak" period.
S&P 500 Index – SPX
Invesco DWA Momentum Portfolio – PDP
50 / 50 PDP and SPLV – PDPSPLV - This portfolio is 50% PDP and 50% SPLV, rebalanced at the end of every year.
Invesco S&P Low Volatility ETF – SPLV
The table below shows the annual returns for each of the strategies. The PDPSPLVSEAS Strategy outperforms a simple 50/50 split between PDP and SPLV, as well as the S&P 500 Index SPX. As mentioned above, the switching strategy also outperforms just SPLV but has trailed PDP over our study period.
Disclosures:
Performance prior to each funds’ inception date are back-tested and based upon the underlying index shown below:
Inception date of PDP is 3/1/2007, prior to that all testing is based upon the DWA Technical Leaders Index.
Inception date of SPLV is 5/5/2011, prior to that all testing is based upon the S&P 500 Low Volatility Index.
Inception date of DWAS is 7/19/2012, prior to that all testing is based upon the DWA Small Cap Technical Leaders Index.
Inception date of XSLV is 2/15/2013, prior to that all testing is based upon the S&P 600 Low Volatility Index.
Inception date of PIE is 12/28/2007, prior to that all testing is based upon the DWA Emerging Markets Technical Leaders Index.
Inception date of EELV is 1/13/2012, prior to that all testing is based upon the S&P Emerging Markets Low Volatility Index.
Inception date of PIZ is 12/28/2007, prior to that all testing is based upon the DWA Developed Markets Technical Leaders Index.
Inception date of IDLV is 1/13/2012, prior to that all testing is based upon the S&P International Developed Low Volatility Index.
Returns for all models and benchmarks are Pure Price Returns, excluding dividends and transaction costs. Returns within the model portfolios are a result of back-testing. Back-tested performance is hypothetical and is provided for informational purposes to illustrate the effects of the strategy during a specific period. The hypothetical returns have been developed and tested by DWA, but have not been verified by any third party and are unaudited. Back-testing performance differs from actual performance because it is achieved through retroactive application of a model investment methodology designed with the benefit of hindsight. Model performance data (both back-tested and live) does not represent the impact of material economic and market factors might have on an investment advisor’s decision making process if the advisor were actually managing client money. Investors cannot invest directly in an index. Indexes have no fees. Past performance is not indicative of future results. Potential for profits is accompanied by possibility of loss.
The relative strength strategy is NOT a guarantee. There may be times where all investments and strategies are unfavorable and depreciate in value. Relative Strength is a measure of price momentum based on historical price activity. Relative Strength is not predictive and there is no assurance that forecasts based on relative strength can be relied upon.
