
Most Requested Symbols

Today, we review the consumer discretionary, technology, and healthcare sectors as they are the areas of the US equity market that possess the highest levels of intrasector dispersion so far into 2020.
Today's featured stock is Microsoft Corp (MSFT).
AMZN, CBOE, FCFS, GWW, INTC, PCTY, RGR, SHOP, SRPT & VVI
Call: MIcrosoft (MSFT); Put: Smartsheet Inc (SMAR); Covered Write: Morgan Stanley (MS).
Mid -Year Market Review: Join the Nasdaq Dorsey Wright team on Wednesday, July 29 at 1 pm EST as we discuss the volatile market movement through the first six months of the year and what to monitor in the second half of 2020. This webinar is approved for 1 hour of CFP CE. Click here to register.
Speakers include:

Virtual Investment Models Workshop: The Investment Models Workshop is designed specifically for financial professionals looking to incorporate Nasdaq Dorsey Wright's (NDW) turnkey model solutions into their investment practice, as well as those who would just like to learn more. This three-hour virtual course will not only give you the chance to engage with experts from NDW, but will also expose you to new strategies, investment frameworks, and best practices for utilizing the NDW Research Platform to help you manage your business with more confidence, efficiency, and greater scale. Investments & Wealth Institute® has accepted the Nasdaq Dorsey Wright Investment Models Workshop for 3 hours of CE credit towards the CIMA®, CPWA®, CIMC®, and RMA certifications. The workshop will take place on Thursday, August 6 from 12:30 pm - 3:30 pm EST. Click here for more information.
Upcoming Market Update Webinar: Join us on Monday, July 27th, at 1 p.m. ET for our weekly Monday Market Update. In this webinar, the NDW analyst team reviews notable price movements occurring over the past week, as well as what indicators we are monitoring for the week to come. This webinar will also be recorded. Click here to register!
As of Friday, July 24th, we are now 102 days away from the 2020 Presidential election. This year has already been a unique political campaign climate with the ongoing COVID-19 pandemic, showing no signs of immediate normalization as we head toward November. Each of the two main political parties have now designated their respective candidates, however, many questions remain on how the rest of the election season will be conducted. This uncertainty, and vast amount of various political polls that carry new headlines with each update can make it difficult to follow the general public sentiment of each party’s candidate on a day-to-day basis.
Today, we will provide an update on the presidential election charts tracked on the NDW platform, as a way to apply the objective lens of point & figure analysis on what is typically a very subjective topic. As a refresher, these charts use price data from the Iowa Electronic Market (IEM), which is a real-money, small-scale, futures exchange. The market is a winner-take-all approach with an investor receiving a $1.00 payout for each contract of the winning political party held.
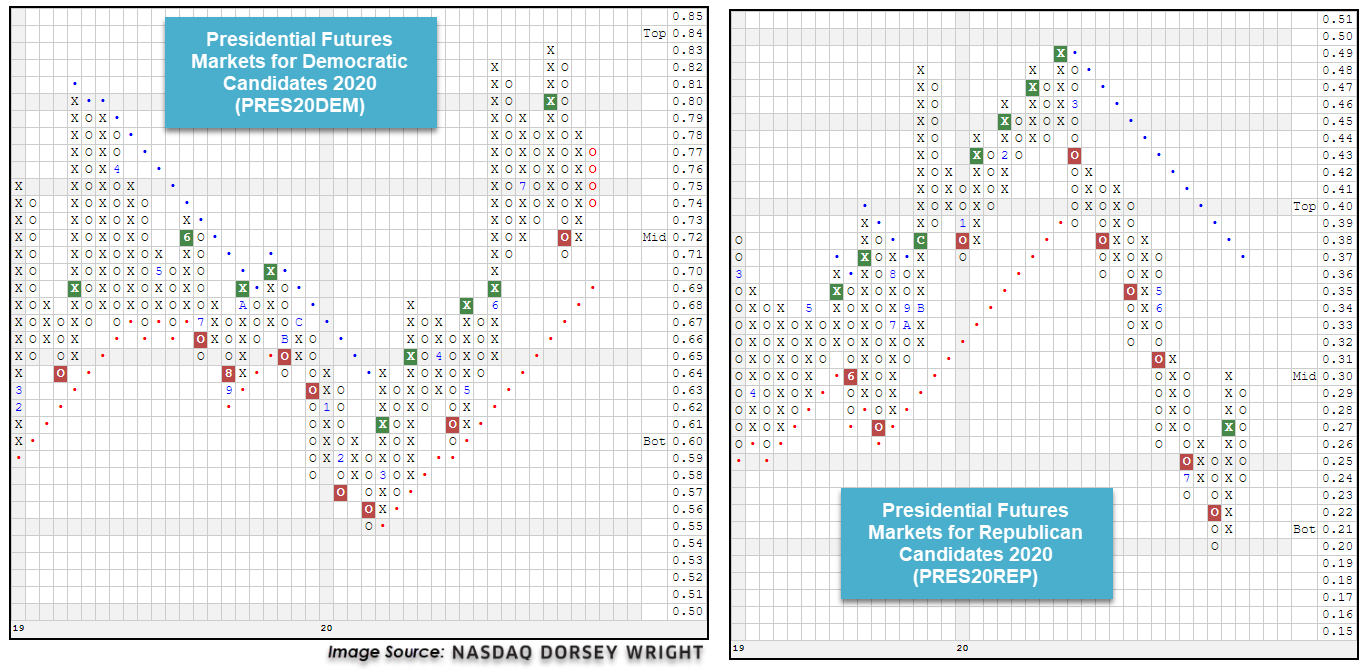
The Presidential Futures Markets for Democratic Candidates 2020 PRES20DEM has seen some significant movement since the last time it was discussed in March, moving higher in May to ultimately give three consecutive buy signals during its ascent to a high of $0.83 earlier this month. The chart then moved lower over the past few weeks to print a sell signal on July 15th and most recently reversed back down into a column of Os at $0.74 following action on Thursday. Despite the recent weakness, the PRES20DEM chart does remain in an overall positive trend, with its bullish support line currently found at $0.69.
The Presidential Futures Markets for Republican Candidates 2020 PRES20REP has shown a drastically different picture than its democratic counterpart over the past several months, as it moved lower from a high of $0.49 in March to give six consecutive sell signals while falling to a low of $0.20 earlier in July. The past two weeks have seen notable improvement, however, with the chart reversing higher to return to a buy signal on July 15th at $0.27 before reaching $0.30. The PRES20REP chart pulled back from this level earlier this week and sits in a column of Os at $0.24, putting further distance between its current level and the bearish resistance line, which is found at $0.37.

With Monday's (7/20) intraday price action, the default chart of the S&P 500 Index SPX broke a spread quadruple top with a move to 3240 before moving higher to 3270 on Tuesday. This latest buy signal marks the third consecutive on the chart, confirming that demand is in control. Although SPX gave up some of its gains over the last few days of trading, we note that the index remains above initial support offered at 3200 and sits approximately 5.44% off of its all-time high from February. Because of its recent bullish price action, the index itself moved back into positive territory for the year with a gain of 0.15% through 7/23, although it is toeing the line with today's intraday action. When we look at performance through a sector lens using the SPDR sector fund lineup as proxies, we find that as of this writing, five of the 11 broad sectors are in positive territory for the year. Currently, the dispersion between the best (technology) and worst (energy) performing sector is 53.35%.
When we refer to heightened dispersion, which is best quantified by the performance difference between the best and worst-performing sectors or asset classes, we are ultimately describing the increased opportunity available through the application of tactical strategies. Relative strength-based approaches tend to offer excess return over their benchmarks more readily when the dispersion between the best and worst performers is extensive. The reason for this is relatively straightforward: the more divergence that exists between the best and worst-performing sectors (or asset classes), the more potential value an advisor can add by owning those areas of the market that are performing well while avoiding or underweighting the weaker sectors. Wide dispersion creates more potential for a tactical decision to produce a meaningful result. On the other hand, such strategies will tend to suffer or at least become muted when the dispersion is narrow. As an extreme example, if all investment possibilities were up the same amount each month and each year, there would not be much, if any, value for a tactical manager to add via rotation. With that in mind, we wanted to take a more in-depth look into the dispersion within each sector. By examining intra-sector dispersion, we aim to identify the areas of the domestic equity market where momentum strategies are likely to offer the most significant advantage over simple beta exposure.

Using the 11 broad SPDR Select Sector ETFs as proxies, we ran the year-to-date numbers through 7/23 for all of the constituents within each sectors' respective basket to determine the best and worst-performing stock within each. As the chart above shows, the consumer discretionary sector has the most extensive year-to-date dispersion reading at just over 136.95%, followed by the technology sector at 126.61%. In comparison, the third-widest dispersion reading comes from the healthcare sector at 117.08%. Based on our intra-sector dispersion examination, we would conclude that consumer discretionary, technology, and healthcare are the sectors that currently offer the most significant opportunity for relative strength strategies and, therefore, will be the focus of the rest of our discussion. The table below shows the year-to-date performance of three Invesco DWA momentum ETFs benchmarked against their corresponding SPDR select sector fund.

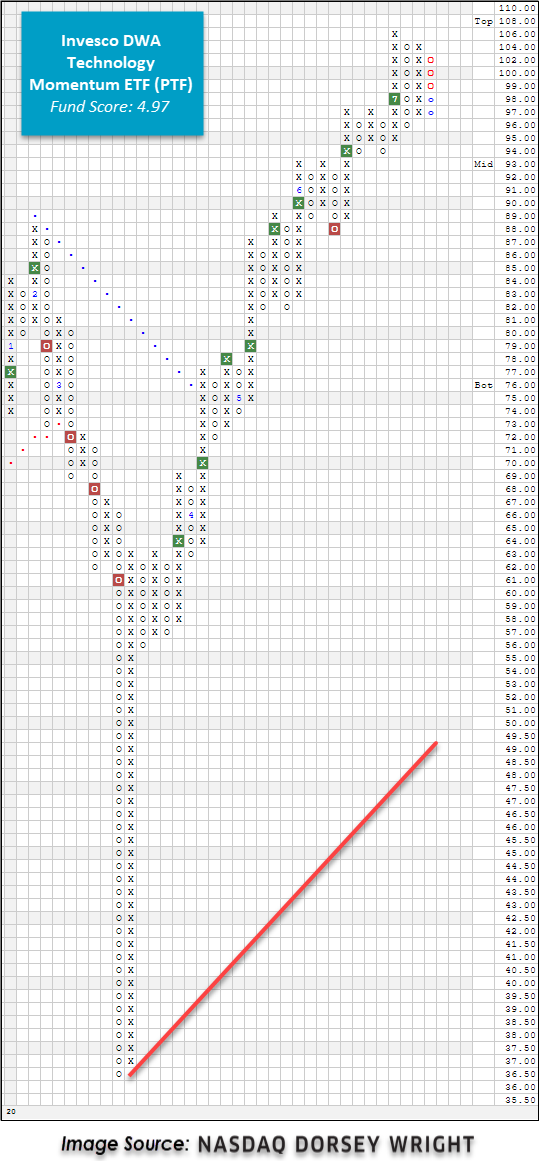
One particular area of the US equity market that has experienced a relatively wide level of dispersion this year is the technology sector, which has produced a difference of 126.61% between the best and worst-performing stock in the Technology Select Sector SPDR Fund XLK. This level of dispersion creates an opportunity for the Invesco DWA Technology Momentum ETF PTF to capture the winners and to underweight or avoid the losers. As a refresher, PTF is based on the Dorsey Wright Technology Technical Leaders Index and seeks to hold those names that have demonstrated positive momentum relative to their peers. The Dorsey Wright Technology Technical Leaders Index currently owns 36 individual stocks and is rebalanced and reconstituted every quarter. With a recent score posting of 4.97, PTF outscores the average All US fund by 1.46 score points. Furthermore, PTF's chart action adds to the overall weight of the evidence as it has given two consecutive buy signals and most recently printed a new all-time high at $106 earlier this month. Despite the pullback experienced over the last few days that triggered a reversal down into Os, PTF remains above initial support that sits at $96, with further support offered at $94. Year-to-date, PTF is up 29.24% versus XLK’s return of 16.17% over the same timeframe. Currently, PTF is a holding in the DWA Sector 4 Model POWER4 and the Invesco Sector Seven Model POWER7, both of which are outpacing the S&P 500’s YTD return of 0.15% with respective gains of 3.05% and 21.96%.
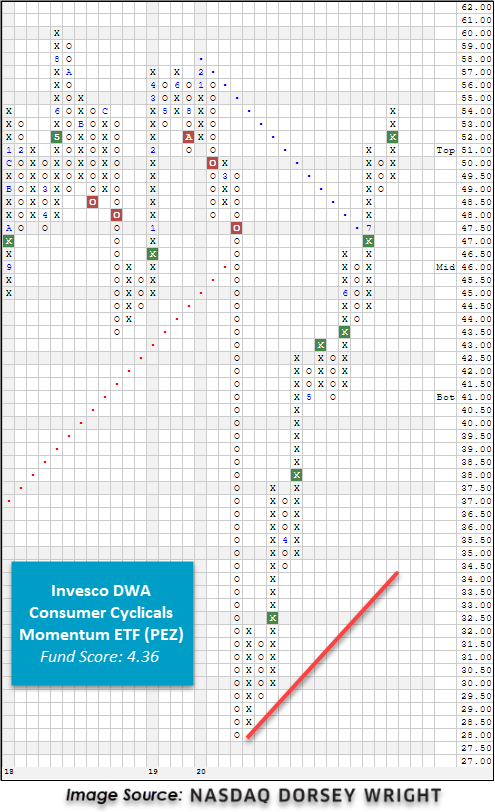
While adding a relative strength overlay has generated alpha for the broader technology sector, momentum has not been as beneficial to the consumer discretionary (aka consumer cyclical) sector. Currently, the Consumer Discretionary Select Sector SPDR Fund XLY is the sector representative that possesses the highest level of intrasector dispersion between its top-performing holding, Amazon Inc. AMZN, and its worst performer, Norwegian Cruise Line Holdings NCLH, at a difference of 136.95%. However, when we dig a little deeper, we find that there are a handful of names skewing this reading. When we remove the stocks in the top and bottom deciles of the performance ranking from the dispersion calculation, we get a much lower reading of 72.55%. Out of the 60 names that are currently held in XLY, 42 are in the red for the year. With the majority of the consumer cyclical stocks being mediocre performers so far this year, there aren't as many winners for an RS-driven strategy to own, limiting the potential for outperformance. Year-to-date, the Invesco DWA Consumer Cyclicals Momentum ETF PEZ is down -4.18%, underperforming the XLY's gain of 7.88%. Despite being in the red for the year, PEZ has given six consecutive buy signals and possesses a fund score of 4.36. The consumer cyclicals segment of the US equity market is considered to be part of the “recovery trade” and is one area to keep an eye on as states begin to reopen (or close down again) following the shutdown caused by the COVID-19 pandemic. Currently, PEZ is a holding in the POWER4 model.
Within the broader healthcare sector representative, the SPDR Health Care Select Sector ETF XLV, we found that the difference between the best performing stock, Dexcom Inc. DXCM, and the worst-performing stock, Universal Health Services UHS, is currently 117.08%. As discussed earlier, this level of dispersion provides an opportunity for momentum strategies to thrive. The Invesco DWA Healthcare Momentum ETF PTH, based on the Dorsey Wright Healthcare Technical Leaders Index, provides exposure to high RS equity names in the healthcare sector by targeting the winners and underweighting or even avoiding the losers. The Dorsey Wright Healthcare Technical Leaders Index currently holds 50 stocks across the broader healthcare sector. It provides sub-sector exposure to biotechnology, health care equipment & supplies, health care providers, pharmaceuticals, and life sciences & tools. PTH's high-flying momentum focus has resulted in an impressive return of 41.32% since the beginning of the year, outpacing the SPDR Health Care Select Sector ETF XLV by over 36%! In fact, PTH is the top-performing fund out of the Invesco DWA momentum sector lineup and, per Morningstar, is the top-performing healthcare fund on both a year-to-date, 1-year, and 3-year basis. At this time, PTH has a near-perfect fund score of 5.94 and is outscoring the average health care fund by a full score point and the average US fund by over two score points. PTH has given two consecutive buy signals and most recently printed a new all-time high at $140 this week. With yesterday's action, PTH pulled back from heavily overbought territory and reversed down into O's. Today the fund moved lower to $130, although it remains well above initial support at $124. Similar to its technology counterpart, PTH is a holding in the POWER4 and POWER7 models. In Monday's report, we will take a deeper dive into the technical strength of the healthcare sector as the world continues to navigate the novel COVID-19 pandemic and walk users through the process of identifying individual stock opportunities using the NDW Research Platform.

As interest rates continue to fall across the board, we have seen a multitude of fixed income groups on the Asset Class Group Scores page with funds scores exceeding 4.00. The recent run-up in major domestic equity indices have taken the lion’s share of attention over the past few months, but from an overall market standpoint, there is still an appetite for risk-off assets. A great way to visually see this is through the quadrant analysis tool. Simply put, this tool allows us to see for how much risk is taken, what kind of score we get in return. On the x-axis is rRisk (relative risk), and on the y-axis is average group score. The origin of this graph is where rRisk is 1, the rRisk of the market, and the 3.00 average group score meet. By graphing each group, we can visualize overall trends in the market.

Looking at the image above, we have a quadrant analysis of all the macro groups. The axes lines are in red and each quadrant is labeled 1-4. Groups within quadrant one exhibit a fund score above 3.00 and an rRisk above 1. These groups are viewed as having high relative strength coupled with higher risk and can be viewed as options for the aggressive portion of an allocation strategy. Groups that find themselves within quadrant two are quality assets that maintain a score above 3.00 and an rRisk of less than 1, offering assets that can provide a strong basis for asset allocation. Quadrants three and four offer groups with scores below 3.00 and are a good place to look for potential ideas that aren’t actionable yet, particularly groups that possess positive score directions closing in on the 3.00 threshold. A good example is the Latin America group, which was touched on in-depth in yesterday’s Fund Score Overview.
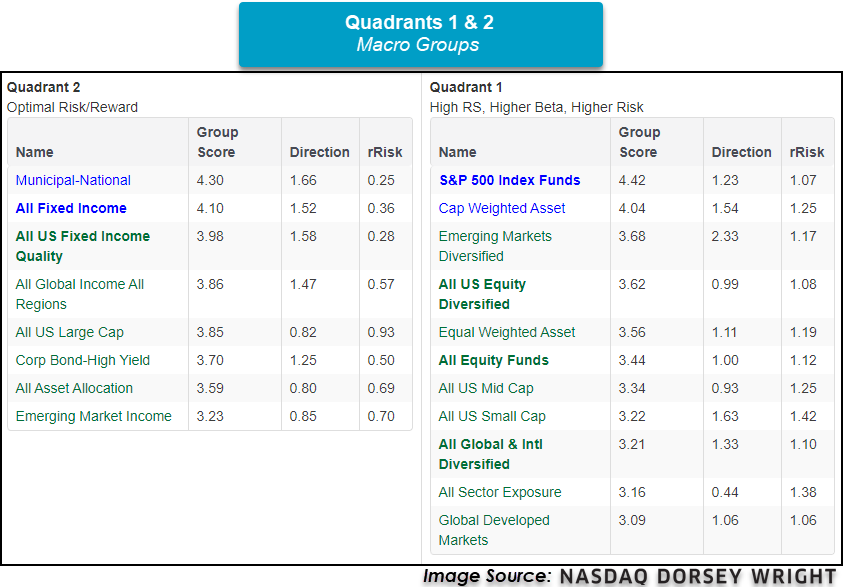
Putting this all together is the blue line on the quadrant analysis graph. This blue line is the line of best fit given all the groups currently graphed. While this seems complex, the most important thing is the slope of the line. If the slope is positive it implies that the more risk taken in the market, the higher the group score. If the slope is negative, then the less risk taken in the market, the higher the group score. By looking at the slope of this line, we can get a general idea of market conditions and determine whether the market is in a risk-on or risk-off environment. The current slope of the macro group’s line of best fit is -0.44, suggesting the market is still in a risk-off mode even with the rally in equities since March. This is exemplified by groups that fall under the fixed income umbrella as 24 fixed income groups possess scores above the coveted 4.00 mark. As both fixed income and domestic equity groups continue to broadly exhibit strength, it’s important to continue to monitor both and allocate accordingly.

Average Level
44.78
| AGG | iShares US Core Bond ETF |
| USO | United States Oil Fund |
| DIA | SPDR Dow Jones Industrial Average ETF |
| DVY | iShares Dow Jones Select Dividend Index ETF |
| DX/Y | NYCE U.S.Dollar Index Spot |
| EFA | iShares MSCI EAFE ETF |
| FXE | Invesco CurrencyShares Euro Trust |
| GLD | SPDR Gold Trust |
| GSG | iShares S&P GSCI Commodity-Indexed Trust |
| HYG | iShares iBoxx $ High Yield Corporate Bond ETF |
| ICF | iShares Cohen & Steers Realty ETF |
| IEF | iShares Barclays 7-10 Yr. Tres. Bond ETF |
| LQD | iShares iBoxx $ Investment Grade Corp. Bond ETF |
| IJH | iShares S&P 400 MidCap Index Fund |
| ONEQ | Fidelity Nasdaq Composite Index Track |
| QQQ | Invesco QQQ Trust |
| RSP | Invesco S&P 500 Equal Weight ETF |
| IWM | iShares Russell 2000 Index ETF |
| SHY | iShares Barclays 1-3 Year Tres. Bond ETF |
| IJR | iShares S&P 600 SmallCap Index Fund |
| SPY | SPDR S&P 500 Index ETF Trust |
| TLT | iShares Barclays 20+ Year Treasury Bond ETF |
| GCC | WisdomTree Continuous Commodity Index Fund |
| VOOG | Vanguard S&P 500 Growth ETF |
| VOOV | Vanguard S&P 500 Value ETF |
| EEM | iShares MSCI Emerging Markets ETF |
| XLG | Invesco S&P 500 Top 50 ETF |
| Symbol | Company | Sector | Current Price | Action Price | Target | Stop | Notes |
|---|---|---|---|---|---|---|---|
| BIG | Big Lots, Inc. | Retailing | $41.73 | hi 30s - low 40s | 66 | 32 | 3 for 5'er, #3 of 82 names in favored RETA sector matrix, pullback from multi-year high, 3%, pot. covered write |
| ABC | AmerisourceBergen Corporation | Drugs | $104.03 | mid 90s to low 100s | 122 | 81 | 4 for 5'er, favored DRUG sector, big base breakout, pullback from multi-year high, 1.7% yield. Earnings 8/5 |
| PYPL | Paypal Holdings Inc | Business Products | $173.86 | high 160s - low 180s | 200 | 138 | 4 for 5'er, top 10% of favored BUSI sector matrix, multi consec buy signals, pullback from ATH, pot. cov write, Earn. 7/29 |
| MBUU | Malibu Boats Inc. | Leisure | $58.94 | low $50s to low $60s | $71 | $44 | 5 for 5'er, LT peer RS buy signal, pos mon mom, fav DWALEIS Spread Triple Top Buy Signal |
| CHGG | Chegg Inc | Business Products | $74.63 | low-to-mid 70s | 101 | 62 | 5 for 5'er, top 10% of favored BUSI sector matrix, pullback from ATH, pos wkly mom flip, pot. cov write, Earn. 8/3 |
| MNST | Monster Beverage Corp. | Food Beverages/Soap | $74.93 | 70s | 87 | 62 | 5 for 5'er, top 20% of FOOD sector matrix, bullish triangle, pos wkly mom flip, Earn. 8/5 |
| NAV | Navistar International Corporation | Autos and Parts | $31.30 | high $20s to low $30s | $42 | $25 | 4 for 5'er, top 25% of DWAAUTO, consec buy signals, |
| ZTS | Zoetis Inc. | Drugs | $144.07 | 140s - low 150s | 166 | 118 | 4 for 5'er, top half of DRUG sector matrix, multi consec buys, pos wkly mom flip Earnings expected 8/6 |
| ADSK | Autodesk, Inc. | Software | $237.34 | $230s to low $260s | $292 | $192 | 5 for 5'er, consec buy signals, pullback from AT high, top 1/3rd of DWASOFT, pos mon mom, LT market RS buy |
| MSFT | Microsoft Corporation | Software | $202.54 | hi 190s - low 210s | 264 | 164 | 4 for 5'er, top half of favored SOFT sector matrix, multi consec buys, pullback from ATH |
| Symbol | Company | Sector | Current Price | Action Price | Target | Stop | Notes |
|---|---|---|---|---|---|---|---|
| TAP | Molson Coors Company | Food Beverages/Soap | $36.55 | mid 30s | $22 | $41 | 0 for 5'er, consec sell signals, spread triple bottom, LT market RS sell signal, bottom of DWAFOOD Earnings 7/30 |
| Comment |
|---|
| FORM FormFactor Inc. R ($30.35) - Semiconductors - We will raise our stop to $27, the second potential sell signal on FORM's $0.50 chart. Earnings are expected on 7/29. |
| INTC Intel Corporation R ($51.29) - Semiconductors - INTC traded down more than 15% intraday on Friday hitting our $51 stop in the process. |
MSFT Microsoft Corporation R ($201.05) - Software - MSFT is a 4 for 5'er that ranks in the top half of the favored software sector matrix. On its default chart, the stock have given nine consecutive buy signals and reached a new all-time high earlier this month. A subsequent pullback toward the middle of the trading band offers an attractive entry point for new long exposure. MSFT carries a 1% yield. Long exposure may be added in the upper $190s to low $210s and we will set our initial stop at $164, the potential trend line violation on MSFT's default chart. Using a modified vertical price objective based on the most recent buy signal, we will set our target price at $264.
| 19 | 20 | ||||||||||||||||||||||||||||||||||||||||||||||||||||
| 216.00 | X | 216.00 | |||||||||||||||||||||||||||||||||||||||||||||||||||
| 212.00 | X | O | 212.00 | ||||||||||||||||||||||||||||||||||||||||||||||||||
| 208.00 | 7 | O | 208.00 | ||||||||||||||||||||||||||||||||||||||||||||||||||
| 204.00 | X | O | 204.00 | ||||||||||||||||||||||||||||||||||||||||||||||||||
| 200.00 | X | X | o | 200.00 | |||||||||||||||||||||||||||||||||||||||||||||||||
| 198.00 | X | X | O | X | o | 198.00 | |||||||||||||||||||||||||||||||||||||||||||||||
| 196.00 | X | O | X | O | X | 196.00 | |||||||||||||||||||||||||||||||||||||||||||||||
| 194.00 | X | O | X | O | Mid | 194.00 | |||||||||||||||||||||||||||||||||||||||||||||||
| 192.00 | X | O | X | 192.00 | |||||||||||||||||||||||||||||||||||||||||||||||||
| 190.00 | X | X | O | X | 190.00 | ||||||||||||||||||||||||||||||||||||||||||||||||
| 188.00 | X | O | X | X | O | X | 188.00 | ||||||||||||||||||||||||||||||||||||||||||||||
| 186.00 | X | O | X | O | X | X | 6 | O | 186.00 | ||||||||||||||||||||||||||||||||||||||||||||
| 184.00 | X | O | X | O | X | O | X | O | X | 184.00 | |||||||||||||||||||||||||||||||||||||||||||
| 182.00 | X | O | O | X | O | X | O | X | 182.00 | ||||||||||||||||||||||||||||||||||||||||||||
| 180.00 | X | O | X | X | X | O | X | O | X | 180.00 | |||||||||||||||||||||||||||||||||||||||||||
| 178.00 | X | O | X | O | X | O | X | O | X | O | 178.00 | ||||||||||||||||||||||||||||||||||||||||||
| 176.00 | 2 | O | X | O | X | X | O | X | O | 176.00 | |||||||||||||||||||||||||||||||||||||||||||
| 174.00 | X | O | X | X | X | O | X | O | X | 5 | 174.00 | ||||||||||||||||||||||||||||||||||||||||||
| 172.00 | X | O | X | O | X | O | X | O | X | O | X | 172.00 | |||||||||||||||||||||||||||||||||||||||||
| 170.00 | X | O | X | O | X | O | X | X | O | X | O | 170.00 | |||||||||||||||||||||||||||||||||||||||||
| 168.00 | X | X | O | X | O | X | O | X | O | X | O | 168.00 | |||||||||||||||||||||||||||||||||||||||||
| 166.00 | X | O | X | O | X | O | X | O | X | O | X | • | Bot | 166.00 | |||||||||||||||||||||||||||||||||||||||
| 164.00 | X | O | X | O | O | X | O | X | X | O | • | 164.00 | |||||||||||||||||||||||||||||||||||||||||
| 162.00 | X | O | O | X | O | X | O | X | • | 162.00 | |||||||||||||||||||||||||||||||||||||||||||
| 160.00 | 1 | O | X | O | X | X | X | O | X | • | 160.00 | ||||||||||||||||||||||||||||||||||||||||||
| 158.00 | X | O | 3 | O | X | O | X | O | X | 4 | X | • | 158.00 | ||||||||||||||||||||||||||||||||||||||||
| 156.00 | X | O | X | O | X | O | X | O | X | X | O | X | • | 156.00 | |||||||||||||||||||||||||||||||||||||||
| 154.00 | C | O | X | O | X | O | X | O | X | O | X | O | X | • | 154.00 | ||||||||||||||||||||||||||||||||||||||
| 152.00 | X | O | O | X | O | X | O | X | O | X | O | • | 152.00 | ||||||||||||||||||||||||||||||||||||||||
| 150.00 | X | O | O | X | O | X | X | O | • | 150.00 | |||||||||||||||||||||||||||||||||||||||||||
| 148.00 | X | O | X | O | X | O | X | • | 148.00 | ||||||||||||||||||||||||||||||||||||||||||||
| 146.00 | B | O | X | O | X | X | O | X | • | 146.00 | |||||||||||||||||||||||||||||||||||||||||||
| 144.00 | X | O | X | O | X | O | X | O | X | • | 144.00 | ||||||||||||||||||||||||||||||||||||||||||
| 142.00 | X | X | O | X | O | X | O | X | O | X | • | 142.00 | |||||||||||||||||||||||||||||||||||||||||
| 140.00 | 7 | 9 | O | X | O | O | X | O | X | O | X | • | 140.00 | ||||||||||||||||||||||||||||||||||||||||
| 138.00 | X | O | X | O | X | O | X | O | X | O | X | • | 138.00 | ||||||||||||||||||||||||||||||||||||||||
| 136.00 | X | O | X | A | X | O | O | O | X | • | 136.00 | ||||||||||||||||||||||||||||||||||||||||||
| 134.00 | X | 8 | X | O | O | • | 134.00 | ||||||||||||||||||||||||||||||||||||||||||||||
| 132.00 | X | O | • | 132.00 | |||||||||||||||||||||||||||||||||||||||||||||||||
| 130.00 | X | X | X | • | 130.00 | ||||||||||||||||||||||||||||||||||||||||||||||||
| 128.00 | X | O | X | O | X | • | 128.00 | ||||||||||||||||||||||||||||||||||||||||||||||
| 126.00 | X | O | X | O | X | • | 126.00 | ||||||||||||||||||||||||||||||||||||||||||||||
| 124.00 | X | 5 | O | X | • | 124.00 | |||||||||||||||||||||||||||||||||||||||||||||||
| 122.00 | 4 | 6 | X | • | 122.00 | ||||||||||||||||||||||||||||||||||||||||||||||||
| 120.00 | X | O | • | 120.00 | |||||||||||||||||||||||||||||||||||||||||||||||||
| 118.00 | X | • | 118.00 | ||||||||||||||||||||||||||||||||||||||||||||||||||
| 116.00 | X | • | 116.00 | ||||||||||||||||||||||||||||||||||||||||||||||||||
| 114.00 | 3 | • | 114.00 | ||||||||||||||||||||||||||||||||||||||||||||||||||
| 112.00 | X | • | 112.00 | ||||||||||||||||||||||||||||||||||||||||||||||||||
| 110.00 | X | • | 110.00 | ||||||||||||||||||||||||||||||||||||||||||||||||||
| 108.00 | 2 | • | 108.00 | ||||||||||||||||||||||||||||||||||||||||||||||||||
| 106.00 | X | • | 106.00 | ||||||||||||||||||||||||||||||||||||||||||||||||||
| 104.00 | X | • | 104.00 | ||||||||||||||||||||||||||||||||||||||||||||||||||
| 102.00 | X | X | • | 102.00 | |||||||||||||||||||||||||||||||||||||||||||||||||
| 100.00 | X | O | X | • | 100.00 | ||||||||||||||||||||||||||||||||||||||||||||||||
| 99.00 | O | X | O | X | • | 99.00 | |||||||||||||||||||||||||||||||||||||||||||||||
| 98.00 | O | X | 1 | • | 98.00 | ||||||||||||||||||||||||||||||||||||||||||||||||
| 97.00 | O | • | 97.00 | ||||||||||||||||||||||||||||||||||||||||||||||||||
| 19 | 20 |

| AMZN Amazon.com Inc. ($2,981.00) - Internet - AMZN fell to a sell signal on Friday when it broke a double bottom at $2912. The weight of the evidence remains positive as the stock is a 4 for 5'er and ranks in the top half of the favored internet sector matrix. From here, the next level of support sits at $2656, while AMZN would need to reach $3264 to return to a buy signal. Earnings are expected on 7/30. |
| CBOE CBOE Global Markets Inc. ($89.32) - Wall Street - Shares of CBOE fell Friday to break a triple bottom at $89. This 1 for 5'er moved to a negative trend in June and ranks last out of 25 names in the wall street sector RS matrix. The stock also moved to an RS sell signal against the market earlier this week. Avoid long exposure. Note that CBOE carries a 1.58% yield and has earnings expected on 7/31. Initial overhead resistance may be found at $95. |
| FCFS FirstCash, Inc. ($61.57) - Finance - FCFS moved lower on Friday with a triple bottom break at $62 and later continued to $61, returning the stock to a sell signal. The 1 for 5'er ranks last in the finance stock sector matrix recently reentered a negative trend on July 22nd, demonstrating relative and absolute weakness, respectively. Supply is in control. FCFS currently resides at support around $61 while resistance can be found at $68. Note the stock offers a yield of 1.65%. |
| GWW W.W. Grainger, Inc. ($341.58) - Machinery and Tools - Shares of GWW reversed up into a column of Xs to break a double top at $344 on Friday, resulting in a third consecutive buy signal. The 4 for 5'er resides in the favored machinery and tools sector and reentered a positive trend in April of this year, indicating absolute strength. Furthermore, weekly and monthly momentum recently flipped to positive, suggesting the potential for additional upside. Demand is in control. Additional bullish confirmation would come with a move past current resistance at $344 while initial support is offered at $328. Note GWW also offers a yield of 1.7%. |
| INTC Intel Corporation R ($50.77) - Semiconductors - Following its earnings release after hours on Thursday INTC traded down more than 15% intraday on Friday taking out multiple levels of support in the process. INTC had already become a low attribute name when it violated its trend line in June dropping it to a 2 for 5'er. The stock currently sits against support at $50, with further support at $46. Long exposure should be avoided. |
| PCTY Paylocity Holding Corporation ($132.31) - Software - PCTY gave a second consecutive sell signal when it broke a double bottom at $132 in Friday's trading. The stock now sits against support at $132, with further support afforded at $124. Despite the negative recent chart action, the long-term technical outlook remains positive; PCTY is a 5 for 5'er and ranks in the top quartile of the favored sodtware sector matrix. From here, PCTY faces overhead resistance at $142. Earnings are expected on 8/6. |
| RGR Sturm Ruger & Company, Inc. ($75.57) - Protection Safety Equipment - RGR gave an initial sell signal when it broke a double bottom at $75 in Friday's trading. The technical picture remains positive for RGR as this is the first sell signal in an otherwise strong uptrend and the stock is a perfect 5 for 5'er and ranks in the top third of the protection safety equipment sector matrix. RGR carries a 1.0% yield and is expected to report earnings on 7/29. |
| SHOP Shopify Inc ($922.27) - Internet - SHOP moved to a sell signal when it broke a triple bottom at $896 in Friday's trading. The overall technical picture remains positive for SHOP which is a perfect 5 for 5'er and ranks seventh out of 54 names in the favored internet sector matrix. From here the next level support sits at $880; beyond this level however, there is no further support to be found on the default chart until $720. So those with open long exposure may wish to monitor the $880 level. |
| SRPT Sarepta Therapeutics Inc ($158.63) - Biomedics/Genetics - SRPT returned to a sell signal with a double bottom break at $158 in Friday's trading and contiued lower to $156, taking out an additional level of support. Despite Friday's action, the outlook for SRTP remains positive. It is a 4 for 5'er and ranks in the top quintile of the biomedics/genetics sector matrix. From here the next level of support sits at $154 with further support at $142. SRPT would return to a buy signal with a move to $176. Earnings are expected on 8/5. |
| VVI Viad Corp. ($14.67) - Business Products - Shares of VVI moved lower on Friday to break a spread quadruple bottom at $15, returning the stock to a sell signal. The 0 for 5'er ranks last in the business products stock sector matrix and reentered a negative trend in February of this year, indicating weak relative and absolute strength, respectively. The weight of the evidence is negative here. The next level of support resides at $14.50 while resistance can be found at $17.50. |
| Name | Option Symbol | Action | Stop Loss |
|---|---|---|---|
| Microsoft Corporation - $201.30 | O: 20K200.00D20 | Buy the November 200.00 calls at 16.50 | 184.00 |
| Name | Option | Action |
|---|---|---|
| Intel Corporation ( INTC) | Sep. 60.00 Calls | Stopped at 55.00 (CP: 50.58) |
| Home Depot, Inc. ( HD) | Sep. 250.00 Calls | Raise the option stop loss to 18.80 (CP: 20.80) |
| Morgan Stanley ( MS) | Sep. 46.00 Calls | Stopped at 5.25 (CP: 5.15) |
| Best Buy Co., Inc. ( BBY) | Oct. 85.00 Calls | Raise the option stop loss to 12.70 (CP: 14.70) |
| Name | Option Symbol | Action | Stop Loss |
|---|---|---|---|
| Smartsheet, Inc. Class A - $46.85 | O: 20W50.00D20 | Buy the November 50.00 puts at 8.10 | 50.00 |
| Name | Option | Action |
|---|---|---|
|
|
||
| Name | Option Sym. | Call to Sell | Call Price | Investment for 500 Shares | Annual Called Rtn. | Annual Static Rtn. | Downside Protection |
|---|---|---|---|---|---|---|---|
| Morgan Stanley $50.56 | O: 20A52.50D17 | Jan. 52.50 | 3.80 | $23,459.90 | 22.57% | 14.49% | 6.50% |
| Name | Action |
|---|---|
| Bank of America (BAC) - 24.54 | Sell the November 25.00 Calls. |
| Chegg Inc (CHGG) - 74.63 | Sell the October 75.00 Calls. |
| Big Lots, Inc. (BIG) - 41.73 | Sell the October 42.50 Calls. |
| Wendy's Company (WEN) - 23.12 | Sell the October 23.00 Calls. |
| Fifth Third Bancorp (FITB) - 19.41 | Sell the November 19.00 Calls. |
| Chegg Inc (CHGG) - 74.63 | Sell the October 75.00 Calls. |
| Wendy's Company (WEN) - 23.12 | Sell the November 23.00 Calls. |
| L Brands Inc. (LB) - 19.36 | Sell the November 20.00 Calls. |
| JD.COM INC (JD) - 60.52 | Sell the October 65.00 Calls. |
| Fiserv, Inc. (FISV) - 102.19 | Sell the November 105.00 Calls. |
| Name | Covered Write |
|---|---|
| Applied Materials, Inc. ( AMAT - 63.63 ) | October 65.00 covered write. |
Daily Equity & Market Analysis
Loading, Please Wait...
