The presidential election charts tracked on the NDW platform have seen notable movement over the past few weeks.
Mid -Year Market Review: Join the Nasdaq Dorsey Wright team on Wednesday, July 29 at 1 pm EST as we discuss the volatile market movement through the first six months of the year and what to monitor in the second half of 2020. This webinar is approved for 1 hour of CFP CE. Click here to register.
Speakers include:
- Jay Gragnani, Head of Research and Client Engagement
- John Lewis, CMT, Senior Portfolio Manager
- Jamie West, CFA, Senior Analyst
- Chuck Fuller, Senior Vice President, Applied Research

Virtual Investment Models Workshop: The Investment Models Workshop is designed specifically for financial professionals looking to incorporate Nasdaq Dorsey Wright's (NDW) turnkey model solutions into their investment practice, as well as those who would just like to learn more. This three-hour virtual course will not only give you the chance to engage with experts from NDW, but will also expose you to new strategies, investment frameworks, and best practices for utilizing the NDW Research Platform to help you manage your business with more confidence, efficiency, and greater scale. Investments & Wealth Institute® has accepted the Nasdaq Dorsey Wright Investment Models Workshop for 3 hours of CE credit towards the CIMA®, CPWA®, CIMC®, and RMA certifications. The workshop will take place on Thursday, August 6 from 12:30 pm - 3:30 pm EST. Click here for more information.
Upcoming Market Update Webinar: Join us on Monday, July 27th, at 1 p.m. ET for our weekly Monday Market Update. In this webinar, the NDW analyst team reviews notable price movements occurring over the past week, as well as what indicators we are monitoring for the week to come. This webinar will also be recorded. Click here to register!
As of Friday, July 24th, we are now 102 days away from the 2020 Presidential election. This year has already been a unique political campaign climate with the ongoing COVID-19 pandemic, showing no signs of immediate normalization as we head toward November. Each of the two main political parties have now designated their respective candidates, however, many questions remain on how the rest of the election season will be conducted. This uncertainty, and vast amount of various political polls that carry new headlines with each update can make it difficult to follow the general public sentiment of each party’s candidate on a day-to-day basis.
Today, we will provide an update on the presidential election charts tracked on the NDW platform, as a way to apply the objective lens of point & figure analysis on what is typically a very subjective topic. As a refresher, these charts use price data from the Iowa Electronic Market (IEM), which is a real-money, small-scale, futures exchange. The market is a winner-take-all approach with an investor receiving a $1.00 payout for each contract of the winning political party held.
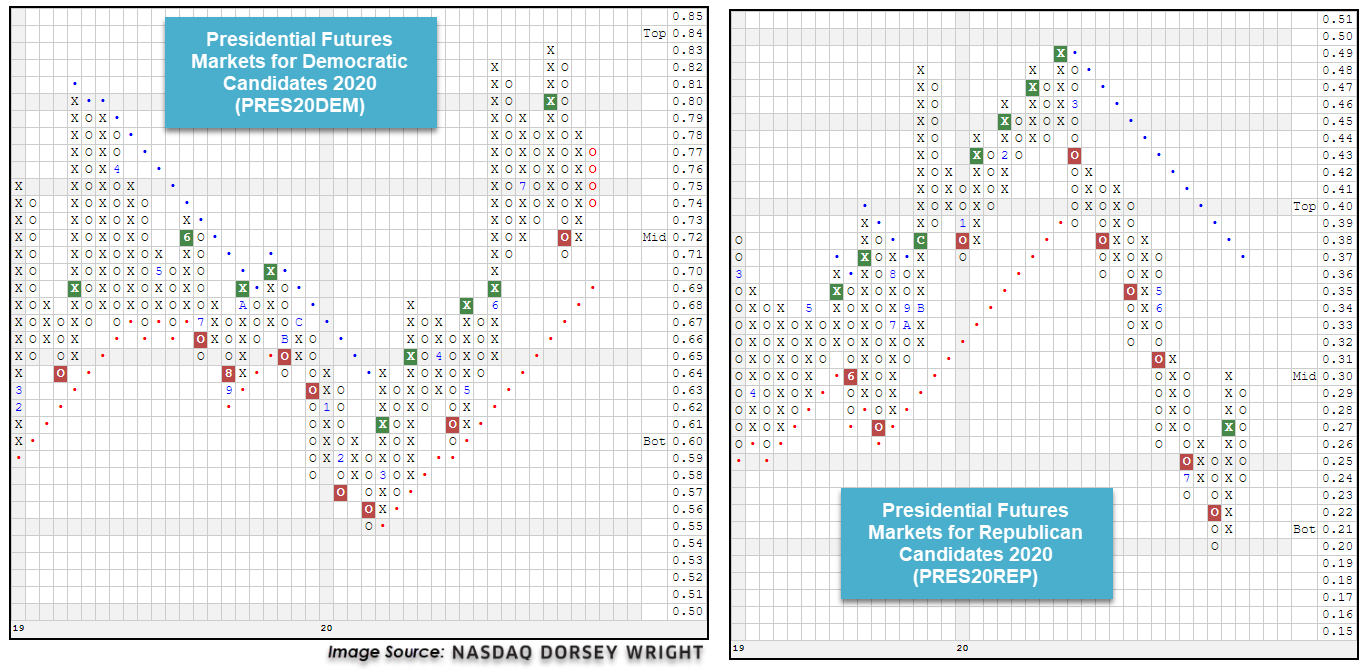
The Presidential Futures Markets for Democratic Candidates 2020 PRES20DEM has seen some significant movement since the last time it was discussed in March, moving higher in May to ultimately give three consecutive buy signals during its ascent to a high of $0.83 earlier this month. The chart then moved lower over the past few weeks to print a sell signal on July 15th and most recently reversed back down into a column of Os at $0.74 following action on Thursday. Despite the recent weakness, the PRES20DEM chart does remain in an overall positive trend, with its bullish support line currently found at $0.69.
The Presidential Futures Markets for Republican Candidates 2020 PRES20REP has shown a drastically different picture than its democratic counterpart over the past several months, as it moved lower from a high of $0.49 in March to give six consecutive sell signals while falling to a low of $0.20 earlier in July. The past two weeks have seen notable improvement, however, with the chart reversing higher to return to a buy signal on July 15th at $0.27 before reaching $0.30. The PRES20REP chart pulled back from this level earlier this week and sits in a column of Os at $0.24, putting further distance between its current level and the bearish resistance line, which is found at $0.37.