Over the past week, we saw two notable trend changes on the default charts of the DIA and the IJR. As a result, all seven US major market ETFs covered in this report are back to trading in an overall positive trend.
Portfolio View - Major Market ETFs
| Symbol | Name | Price | Yield | PnF Trend | RS Signal | RS Col. | Fund Score | 200 Day MA | Weekly Mom |
|---|---|---|---|---|---|---|---|---|---|
| DIA | SPDR Dow Jones Industrial Average ETF Trust | 250.25 | 2.35 | Positive | X | 3.28 | 263.18 | +7W | |
| EEM | iShares MSCI Emerging Markets ETF | 37.23 | 2.62 | Negative | Sell | O | 0.93 | 40.57 | +7W |
| EFA | iShares MSCI EAFE ETF | 58.58 | 3.67 | Negative | Sell | O | 1.95 | 63.31 | +7W |
| FM | iShares MSCI Frontier 100 ETF | 23.43 | 4.05 | Negative | Sell | O | 0.40 | 27.18 | +7W |
| IJH | iShares S&P MidCap 400 Index Fund | 175.19 | 1.97 | Positive | Buy | O | 2.42 | 185.16 | +7W |
| IJR | iShares S&P SmallCap 600 Index Fund | 66.39 | 1.81 | Negative | Buy | O | 1.14 | 74.03 | +7W |
| QQQ | Invesco QQQ Trust | 229.04 | 0.72 | Positive | Buy | X | 5.80 | 204.19 | +7W |
| RSP | Invesco S&P 500 Equal Weight ETF | 99.42 | 2.22 | Positive | Buy | X | 2.20 | 105.08 | +7W |
| SPY | SPDR S&P 500 ETF Trust | 299.08 | 1.94 | Positive | O | 3.59 | 299.59 | +7W | |
| XLG | Invesco S&P 500 Top 50 ETF | 228.29 | 1.62 | Positive | O | 5.24 | 219.92 | +7W |
Additional Comments:
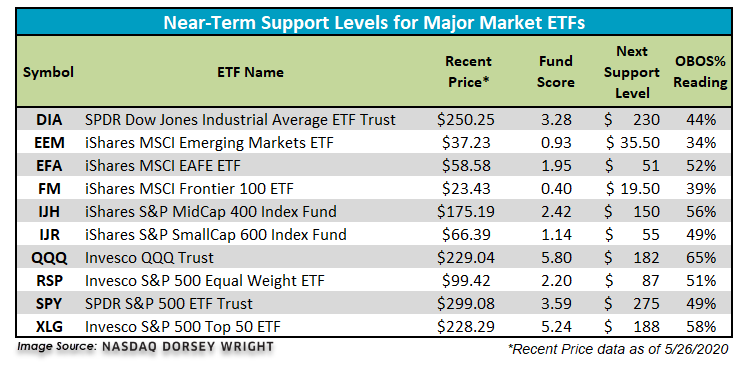
It was a strong week across the board for the 10 major market funds covered in this report as all finished in positive territory. The leader of the week was the iShares S&P SmallCap 600 Index Fund IJR, up 7.92%, while the iShares MSCI Emerging Markets ETF EEM lagged the group despite returning 0.24%. In the table below, we have updated initial support levels for all 10 major market funds covered in this report. Additionally, today we want to bring two notable trend changes to your attention from our major market ETF universe.

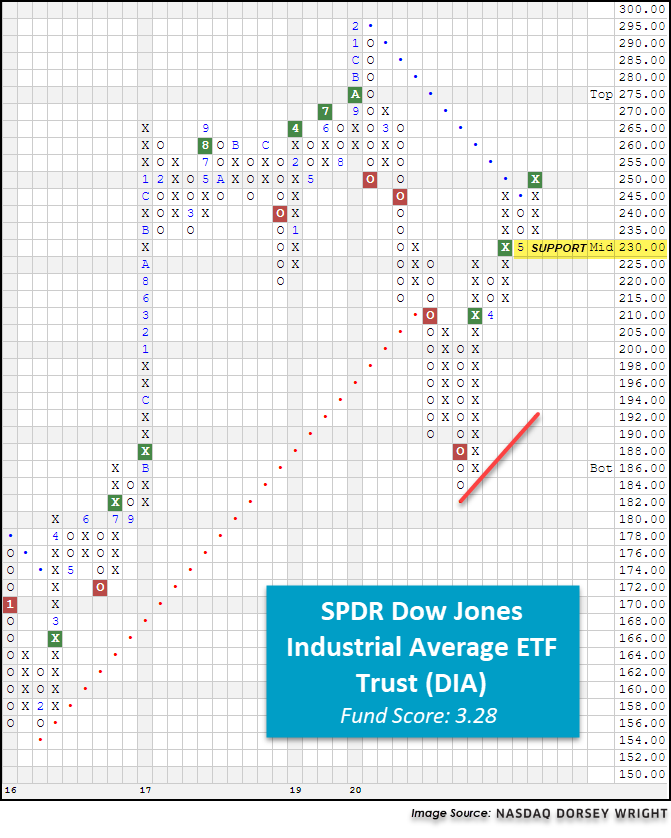
The first trend change occurred on the chart of the SPDR Dow Jones Industrial Average ETF Trust DIA as a result of Tuesday’s (5/26) intraday price action. Looking at DIA’s default chart below, we find that yesterday the fund broke a double top at $250, marking the third consecutive buy signal on the chart as demand has the upper hand. This move also broke through DIA’s bearish resistance line, turning the overall trend back to positive for the first time since flipping negative during the March sell-off. From current levels DIA faces resistance at the $270 and $295 level, the latter being DIA’s all-time high reached in late-February. Currently, DIA has a fund score of 3.28 and is outscoring the average all US fund by 0.33 score points as well as the average US large-cap value fund by 0.94 score points. DIA’s recent breakout has established support at $230, with further support offered at $210. Year-to-date DIA is down -12.22%, underperforming the S&P 500 Index SPX by 4.82% (through 5/26).

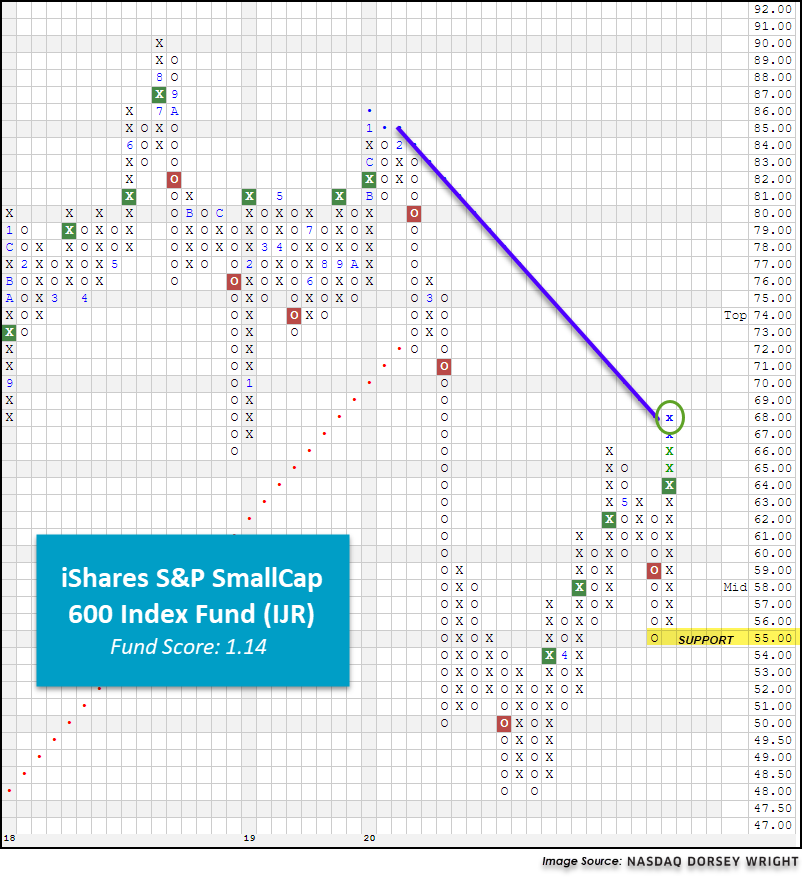
The second major market trend change materialized on the chart of the iShares S&P SmallCap 600 Index Fund IJR during Wednesday’s (5/27) trading session. As we mentioned above, we have seen the IJR rally nearly 8% following last week’s double top breakout at $64, outpacing all other major market funds for the week. On Wednesday, the IJR continued to push higher to $68, breaking through the small-cap fund’s bearish resistance line that had been in place since late-February. As a result, IJR, along with the other six US major market ETFs covered in this report, is now trading in an overall positive trend. Currently, IJR possesses a relatively weak fund score of 1.14. As a result, we will remain on the sidelines until IJR is able to demonstrate additional follow-through and improved relative strength, which would be reflected via a fund score over the 3-threshold. IJR has initial support offered at $55 while its first level of overhead resistance sits at $76. Even with its recent rally, IJR is down a whopping -20.82% year-to-date, underperforming the SPX by 13.42%.

