Most Requested Symbols

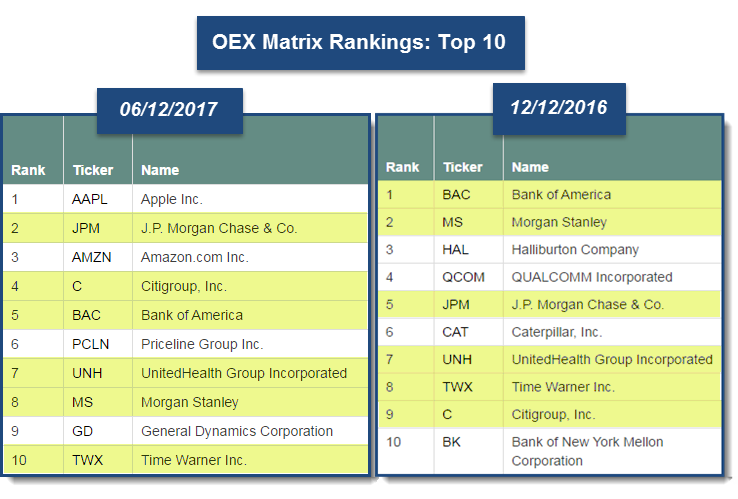
The S&P 100 Index OEX Matrix is comprised of roughly the 100 largest names in the S&P 500 Index SPX as defined by market capitalization. It is one we watch regularly since it keeps the pulse of some of the most widely held names within the US stock market. Today, we wanted to compare the top ten stocks in the OEX matrix to six months ago (6/12/2017 compared to 12/12/2016). You may access these rankings at any time by viewing the Premade Matrices under Database Tools. Over the past six months of trading, four of the members have rotated out, while six remain. We have highlighted those six to show their movement within over the past six months. New members in the top ten include: Apple AAPL, Amazon.com In. AMZN, Priceline Group Inc. PCLN, and General Dynamics Corporation GD.
We wanted to drill down into the full OEX matrix a bit further to see what, if any, material shifts in sector leadership have taken place over the past six months. To do this, we looked to the Sector Tally Ranking, which simply ranks each sector by the total number of buy signals it has given. To do this, we split the OEX inventory into the 11 US Broad Sectors. We then totaled up the number of RS buy signals for each sector and tracked the number of signal and percent changes over the past six months.
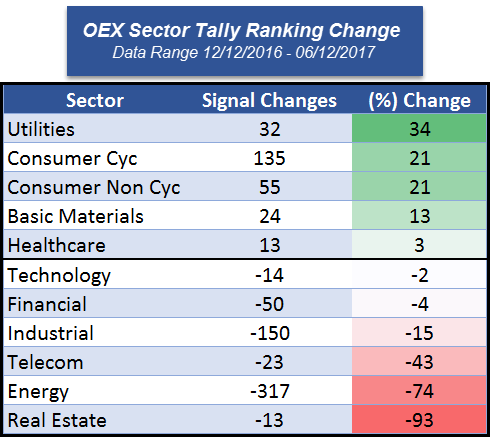
Five sectors saw an increase in RS buy signals while six declined. Utilities experienced the largest improvement on a percentage basis, up 34% thanks to the likes of Exelon Corporation EXC and NextEra Energy Inc. NEE. Both Consumer Cyclical and Consumer Non-Cyclical saw an increase of 21% while Basic Materials saw a 13% increase. Technology remains relatively unchanged, as its buy signal tally is down just 2% over the past six months. Apple Inc. AAPL, which now ranks #1 in the OEX matrix, and Paypal Holdings Inc PYPL gained a combined 74 signals for the Tech sector. However, QUALCOMM Incorporated QCOM lost 64 signals. The Real Estate sector saw the biggest drop in percentage down -93%, but Energy lost the most signals (-317) and was down -74%. Telecom (-43%), Industrial (-15%), and Financials (-4%) also saw a decrease over the last six months.

To borrow a literary element or two from Charles Dickens, “It was the best of years, it was the worst of days …” So it has been for the US Technology sector, the largest and most widely-held of which have far surpassed the returns of the broader market for many weeks, months and years. That, however, is not always a vaccine for the “Terrible, horrible, no good, very bad days” that impact every sector at one point or another. The two sessions that followed June 8th (last Thursday) were such an example for the US Tech sector, which absorbed a fundamental downgrade for Apple Inc. AAPL that quickly became a systemic event for the broad group. The Nasdaq Composite NASD posted its largest 2-day decline of 2017, falling 2.3% while the Nasdaq 100 Index NDX fell a bit more (3.0%) as the largest Tech stocks led the decline … just as they have the longer-term rally.

The 15 largest Technology stocks (by market cap) had, on average, tripled the return of the average S&P 500 stock this year thru last Thursday (6/8). Only two were in negative territory for the year at that point, and most were up more than 20%. But this was not just a 2017 anomaly as these stocks have tripled the return of the S&P Equal-Weighted Index SPXEWI over the past 3 years as well. However, the period following June 8th provided a dose of mean reversion as these same stocks lagged the market by more than 3.5%, on average, in just two days. Amidst these two volatile sessions for the Tech sector, Amazon AMZN fell nearly 90 points peak-to-trough and Priceline PCLN fell over 100 points. While those drawdowns still don’t reach 10% of the share price for the respective stock, it is still the type of move that rattles the nerves of investors. Dispassionately, however, many of these stocks were overdue for an exhale and the sector closed last Thursday very clearly overbought statistically. The two soft days for Technology resulted in a very different distribution for this sector, but one that we might call far more “normal.”
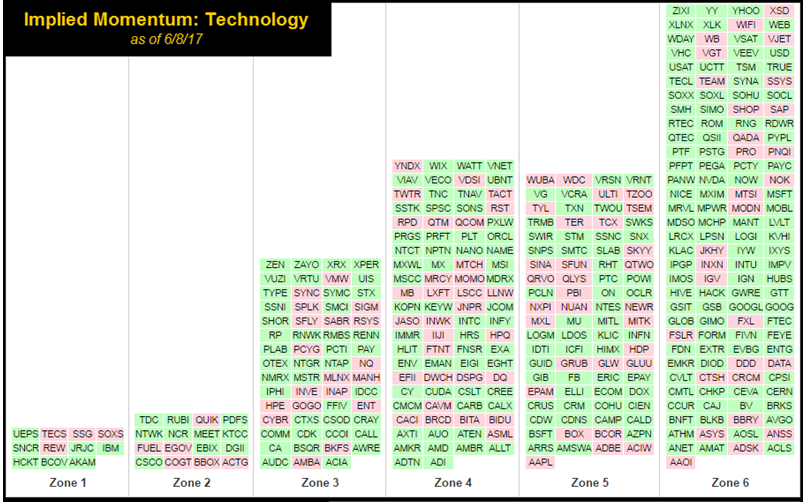
One way to gauge the overbought nature of Technology and how the current view appears to be more "normal" is via the Implied Momentum tool (found on your Dashboard via the Links of Interest widget). This tool was built around the "Zone Concept," developed and pioneered by the late Jim Yates. Jim used this as an options strategy by organizing the market into “zones” by placing each stock (by symbol) on a big bell curve upon where they resided on their individual distribution (shown below) in order to display a visual of the “market.” All six zones are equal in size to one another where the middle would be normally distributed data. Data skewed to the right would be overbought (Zones 5 and 6), and to the left oversold (Zones 1 and 2). We will borrow this tool for today to simply obtain a view of the overbought/oversold nature of the S&P 100 Index OEX versus the Technology sector on Thursday June 8th and Monday June 12th.

Based on the charts above and below, we gathered the following observations:
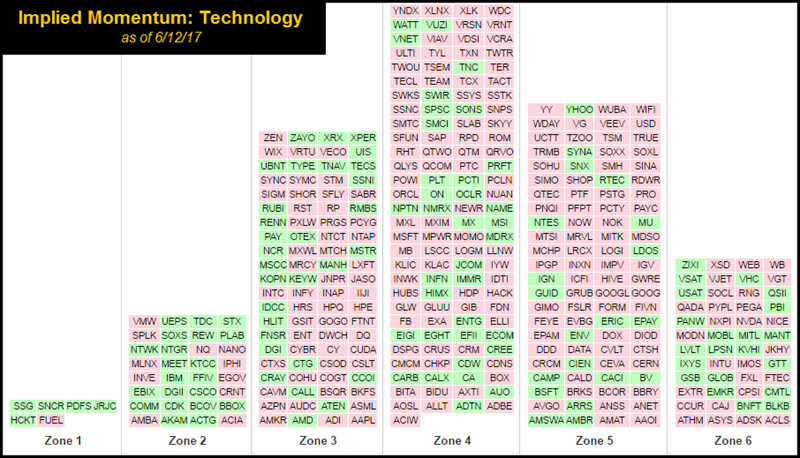
This pullback is essentially creating an actionable opportunity within an overall longer term positive trend for Technology as a sector. The relative strength is still positive as seen on the DALI page, with Technology continuing to claim the number one spot with 245 buy signals. In addition, we can see the average score for Technology on the Asset Class Group Scores page is a staggering 5.17 out of a possible 6. One way we are able to find ideas within this space on an ETF front is to turn to the Technology Sector ETF Matrix (found under the Premade Matrices). Below we have provided the rankings of roughly the top half (15 out of a universe of 29).

The rankings here provide additional flavor to the story. The average score of these 15 funds is 5.68, which speaks highly of the funds' trend and relative strength metrics. In addition, we can see there are various types of Technology exposure at the top ranging from sub-sectors like Semiconductors, Nasdaq 100 Technology stocks, broad Technology exposure, Equal Weight, etc. That being said, let’s take a look at a few funds that stood out as actionable ideas. Each offer a different approach in their exposure.
FXL First Trust Technology AlphaDEX Fund ($44.38) - Computers – FXL seeks to own the top 75% of Technology stocks within the Russell 1000 Index after ranking them based upon fundamental growth and value factors. The stocks are divided into quintiles where the higher ranked quintiles receive a higher weighting and the overall portfolio is rebalanced and reconstituted on a quarterly basis. That being said, notice how none of the “FANG” stocks in addition to the likes of Apple, Intel, Microsoft, IBM, etc. made their way into the top ten holdings unlike many other sector based funds. On a technical level, FXL offers a fund score of 5.61, which tops all of its benchmarks. Looking to its trend chart we can see the fund pulled back with yesterday’s action (6/12) to $43.50, which is one box above support from May this year. The fund has given six consecutive buy signals and is now just 36% overbought (compared to 102.06% last week). Those interested in gaining exposure may initiate positions at current levels. The first sign of trouble comes with a move to $42.50, a double bottom break.

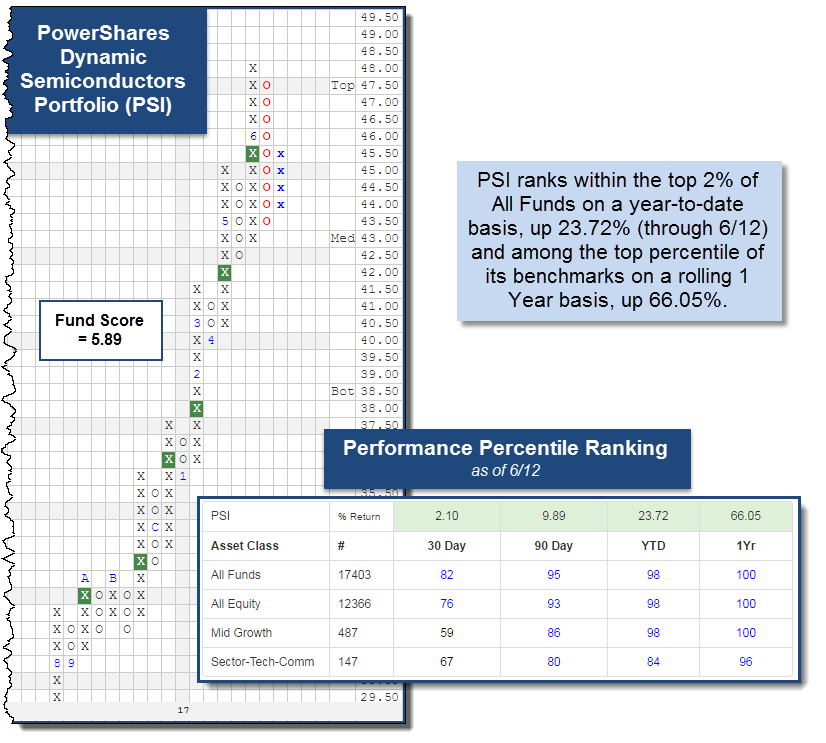
PSI PowerShares Dynamic Semiconductors Portfolio ($44.73) - Semiconductors – PSI boasts a fund score of 5.89, which is nearly 2.50 points higher than the average All US fund. The fund has given nine consecutive buy signals over the course of the past fifteen months and displayed a pattern of higher tops and bottoms for the better part of eight. We can see PSI was able to make a higher bottom at $43.50 yesterday and reversed back up into X’s today at $45.50. Semiconductors has been the strongest sub-sector within broad Technology based on the DWA Group Matrix rankings. This positive relative strength has helped PSI rank among the top 2% of all funds on a year-to-date basis, up 23.72% (through 6/12) and among the top percentile of its benchmarks on a rolling one year basis, up 66.05%. Those interested in gaining exposure to PSI may initiate at current levels and look to support between $42.50 and $43.50 moving forward. For those already long be aware of resistance at the $48 level, the fund’s previous high.
PSCT PowerShares S&P SmallCap Information Technology ETF ($75.57) - Computers – Small Caps have struggled this year, not that their performance has been negative, it has just lagged the broader Large Cap market. However, more recently we have seen some Small Cap funds rally to new highs. PSCT was able to rally to new highs as well this month at $78. When looking to the chart of PSCT, it makes it difficult to gripe with. Since developing support in February 2016 in the mid $40’s, the fund has been able to almost double its price in just sixteen months. With yesterday’s action it reversed down into a column of O’s similar to other Technology based securities. This pullback falls back near the last prior level of resistance from February 2017 in the mid $70’s. While not perfect, its weekly momentum has been a nice indicator to follow the performance of PSCT so far this year. It was relatively flat during its stint in negative territory from February 24th to May 5th this year, but since flipping positive at the beginning of May through present, PSCT has been able to post a gain of 2.68% compared to the S&P 500 Index SPX, up 1.25%. Those interested in gaining exposure to Small Cap Technology may consider the 5.47 scoring PSCT at current levels. From here, support comes at the $70 and $66 levels.

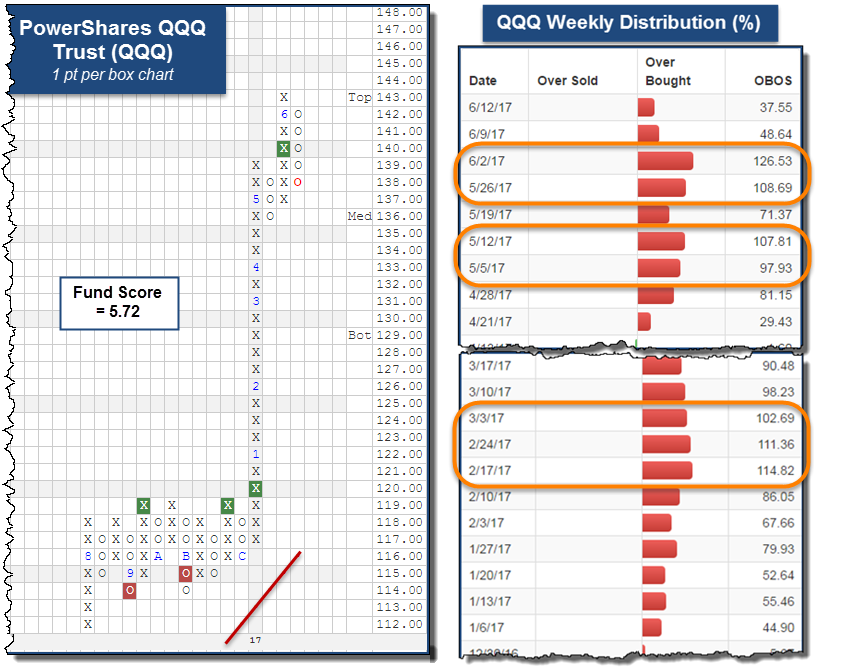
QQQ PowerShares QQQ Trust ($139.86) - QQQ has been one of the best performing index based funds on a year-to-date basis having more than doubled the performance of the S&P 500 Index SPX, up 17.51% compared to 8.51% through 6/12. The index it tracks, the NASDAQ 100 Index NDX, has benefited from having exposure to large cap stocks in addition to the fund offering nearly a 60% weighting to Technology (as of 6/12). QQQ offers a solid score of 5.72, which speaks positively to its positive trend and relative strength characteristics. By looking at the one point per box chart, we can see the Q’s reversed down into a column of O’s to the upper $130’s and is close to reversing back up into X’s at $141. The overbought nature of the fund comes with precedence when it has moved to new highs this year. It was able to make new highs with the rest of the market in March where it was more than 100% overbought. Similarly, it bettered those levels in May and June where it also surpassed being 100% overbought. The most recent volatility has brought the fund’s weekly distribution down from a high of +126% in June to just +37%. This pullback has not upset the technical picture of the fund, as it remains on a buy signal, but creates an actionable opportunity. Those interested in gaining exposure to the Q’s may do so at current levels. From here, resistance lies at $143 and further support may be created at $138 (if the fund is able to reverse up on the 1 pt. chart) in addition to existing support from May at $136.

Every week, the analysts here at DWA organize and write approximately 11 feature stories focusing within the inventories of multiple ETF providers. These articles can be found within the weekly ETF reports we conduct for those ETF families with which we provide guided model-based solutions. The weekly reports can be accessed from the Research Menu, but as of this week we will also compile a handful of those stories, which we feel are particularly relevant. We hope that this will serve as an "in case you missed it..." sort of section, where you can quickly access timely ETF features in a comprehensive fashion each week. We will include a link to the report along with a brief abstract summarizing our discussion within the respective features. This week's compilation is below.

This week the ALPS Equal Sector Weight ETF EQL caught our attention. This fund seeks to own Large Capitalization equities within the 10 Select Sector SPDRs and the fund ebalances on a quarterly basis. When looking at its 0.5 per box chart, we can see a shakeout pattern began after it formed a double top at $59.50 between July and September before breaking a double bottom at $57.50 in October. The shakeout was initiated upon the reversal up into X’s following the election and was completed when EQL broke... (Read More)
The change to the FTRUSTINTL Model this week is the removal of the First Trust Brazil AlphaDEX Fund FBZ and, in its place, the addition of the First Trust Developed Markets Ex-US AlphaDEX Fund FDT. Although recent weakness from a relative strength standpoint has led to its removal, FBZ was able to gain 19.23% while it was a holding within the Model (6/28/2016 to 6/6/2017). The new holding, FDT, provides a strong technical picture as exhibited by its current fund score of 4.64. This score places the Fund above the average... (Read More)
It is no secret that Commodities as an asset class have struggled this year. Coming into 2017, the asset class was ranked second in DALI but has since fallen to fifth, falling below Cash last week. The sub-sector rankings have been changing too. Industrial Metals continue to rank first among the four sub-sectors while Precious Metals have risen from last to second place due to their improved relative strength and the weakness in Energy at the end of Q1. The PowerShares Commodity Model POWRSHARES seeks to own... (Read More)
The Distribution Report below places Major Market ETFs and Indices into a bell curve style table based upon their current location on their 10-week trading band. The middle of the bell curve represents areas of the market that are "normally" distributed, with the far right being 100% overbought on a weekly distribution and the far left being 100% oversold on a weekly distribution. The weekly distribution ranges are calculated at the end of each week, while the placement within that range will fluctuate during the week. In addition to information regarding the statistical distribution of these market indexes, a symbol that is in UPPER CASE indicates that the RS chart is on a Buy Signal. If the symbol is dark Green then the stock is on a Point & Figure buy signal, and if the symbol is bright Red then it is on a Point & Figure sell signal.
The average Bullish Percent reading this week is 57.69% up 0.86% from the previous week
| <--100 | -100--80 | -80--60 | -60--40 | -40--20 | -20-0 | 0-20 | 20-40 | 40-60 | 60-80 | 80-100 | 100-> | |||
 |
||||||||||||||
| Symbol | Name | Symbol | Name |
| AGG | iShares US Core Bond ETF | NASD | Nasdaq Composite |
| CL/ | Crude Oil Continuous | NDX | NASDAQ-100 Index |
| DJIA | Dow Jones Industrial Average | RSP | Guggenheim S&P 500 Equal Weight ETF |
| DVY | iShares Dow Jones Select Dividend Index | RUT | Russell 2000 Index |
| DX/Y | NYCE U.S.Dollar Index Spot | SHY | iShares Barclays 1-3 Year Tres. Bond Fund |
| EFA | iSharesMSCI EAFE Index Fund | SML | S&P 600 Small Cap Index |
| FXE | CurrencyShares Euro Trust | SPX | S & P 500 Index |
| GC/ | Gold Continuous | TLT | iShares Barclays 20+ Year Treasury Bond Fund |
| GSG | iShares S&P GSCI Commodity-Indexed Trust | UV/Y | Continuous Commodity Index |
| HYG | iShares iBoxx $ High Yield Corporate Bond ETF | VOOG | Vanguard S&P 500 Growth ETF |
| ICF | iShares Cohen & Steers Realty Index | VOOV | Vanguard S&P 500 Value ETF |
| IEF | iShares Barclays 7-10 Yr. Tres. Bond Fund | VWO | Vanguard FTSE Emerging Markets ETF |
| LQD | iShares iBoxx $ Investment Grade Corp. | XLG | Guggenheim S&P 500 Top 50 ETF |
| MID | S&P 400 MidCap Index |

BDX Becton, Dickinson and Company R ($192.36) - Healthcare - BDX is a 4 for 5'er within the favored Healthcare sector, completing a series of buy signals throughout the year thus far. The most recent with a triple top, completed at $188. It is enjoying both positive weekly and monthly momentum, and the upside target of $236 suggests additional upside potential from here. Okay to take on new long positions in the low 190's, with an initial stop afforded at $174.
Long Ideas
Stock
Symbol
Sector
Current Price
Action Price
Target
Stop
Notes
Manpower Inc
MAN
Business Products
$105.01
99-104
TOP (112)
97/91
3 for 5'er, top 20% of BUSI sector matrix, pos wkly mom change, middle of trading band.
Synopsys Inc
SNPS
Software
$73.89
mid 70s
106
68
4 for 5'er, favored Software sector, R-R > 5-to-1
Skyworks Solutions, Inc.
SWKS
Semiconductors
$103.76
104-108
133
93/87
5 for 5'er, leader in favored SEMI sector, pos wkly mom change, consistent higher tops and higher bottoms
j2 Global Communications, Inc.
JCOM
Internet
$86.14
85-89
112
80
5/5'er, Long-term market leaders, "90 to 100" opportunity in strong sector (INET), Raise Stops to $80.
Owens Corning Inc.
OC
Building
$64.54
62-65
72 (inc)
59/55
3 for 5'er, leader in favored Building Sector, positive wkly and monthly mom, bullish pattern
Wynn Resorts, Limited
WYNN
Gaming
$130.25
126-134
193
118/96
5/5'er, Big Base Breakout, Potential Covered Write candidate (Sept 135.00 calls).
Zions Bancorporation
ZION
Banks
$42.93
lo-40s
97
38
5/5'er, PB to middle of 10-week Trading Bank, Top 15 Rank in Banks matrix.
Becton, Dickinson and Company
BDX
Healthcare
$191.00
low 190's
236
174
4 for 5'er, favored Healthcare sector, good R-R, bullish pattern
Short Ideas
Stock
Symbol
Sector
Current Price
Action Price
Target
Stop
Notes
Genesee & Wyoming Inc
GWR
Transports/Non Air
$66.40
(mid-60s)
51
72
0 for 5'er, bottom of unfavored Non Air Transport sector matrix, bearish R-R > 2, negative diverger.
Express Scripts, Inc.
ESRX
Healthcare
$62.52
(lo-60s)
55
64/68
0 for 5'er, negative diverger, bottom decile of HEAL sector matrix, bearish pattern
Bristol-Myers Squibb Company
BMY
Drugs
$54.36
(53-56)
22
61
1 for 5'er, negative diverger, bearish triangle, negative weekly mom change
Follow-Up Comments
Comment
GPN Global Payments Inc. R ($90.80) - Business Products - The recent market action has allowed for the formation of a higher bottom at $88. As a result, those long from recommendations back in March are able to protect profits and raise their initial stop loss point to $87.
ADI Analog Devices, Inc. R ($81.23) - Semiconductors - ADI has remained above our recommended stop despite a recent sell signal. The chart returned to a column of X's establishing near term support at $78 in the process. Those still long can look to raise initial stops to $77, while $74 continues to offer a good long term stop.
DWA Spotlight Stock
14
15
16
17
194.00
X
194.00
192.00
6
O
192.00
190.00
X
O
190.00
188.00
X
O
188.00
186.00
X
X
X
186.00
184.00
3
O
X
O
X
Med
184.00
182.00
X
O
X
O
X
182.00
180.00
X
X
4
X
5
X
180.00
178.00
X
X
O
X
2
O
X
O
178.00
176.00
X
X
O
X
O
X
O
X
O
176.00
174.00
X
O
X
O
X
A
X
O
X
X
174.00
172.00
X
X
O
X
9
O
X
O
X
O
X
X
172.00
170.00
6
O
7
8
X
O
X
O
X
O
X
O
X
X
Bot
170.00
168.00
X
O
X
O
O
X
O
X
O
X
O
X
O
X
168.00
166.00
X
O
X
B
O
X
O
C
X
O
X
166.00
164.00
5
O
O
O
X
1
X
164.00
162.00
X
O
O
162.00
160.00
X
•
160.00
158.00
X
•
158.00
156.00
X
X
•
156.00
154.00
8
C
O
4
•
154.00
152.00
X
O
X
O
3
•
152.00
150.00
X
O
X
1
X
•
150.00
148.00
X
X
O
X
O
X
X
•
148.00
146.00
X
X
O
X
X
O
X
O
X
O
X
•
146.00
144.00
X
O
X
O
X
O
7
O
B
O
X
O
X
•
144.00
142.00
X
1
O
X
3
X
O
X
O
X
X
O
X
O
X
•
142.00
140.00
X
O
X
O
X
4
5
X
O
X
O
X
X
O
X
2
X
•
140.00
138.00
X
O
X
2
6
O
X
O
X
O
X
O
O
X
•
138.00
136.00
X
C
X
O
X
9
X
O
A
O
X
•
136.00
134.00
X
O
O
O
O
X
O
X
•
134.00
132.00
X
O
X
O
X
•
132.00
130.00
X
B
O
O
•
130.00
128.00
X
O
X
•
128.00
126.00
X
O
X
•
126.00
124.00
X
O
X
•
124.00
122.00
X
O
•
122.00
120.00
6
A
•
120.00
118.00
4
5
O
X
•
118.00
116.00
X
O
X
O
X
•
116.00
114.00
X
O
X
9
•
114.00
112.00
1
X
O
•
112.00
110.00
X
O
X
•
110.00
108.00
B
O
X
•
108.00
106.00
X
2
•
106.00
104.00
X
A
•
104.00
102.00
X
O
X
•
102.00
100.00
7
O
9
•
100.00
99.00
O
X
8
X
•
99.00
98.00
O
X
O
X
•
98.00
97.00
O
X
O
•
97.00
96.00
O
X
•
96.00
95.00
O
•
95.00
14
15
16
17
Create Portfolio
Create Portfolio
| Comments |
|---|
| AAON Aaon Inc ($37.95) - Building - AAON, a member of the favored Building sector, broke a double top at $38 on Tuesday. This stock is a perfect 5 for 5’er that is trading well above its bullish support line that has been in tact since November 2008. Demand is in control here, confirmed by five consecutive buy signals. Okay to buy or hold here as the weight of the evidence is positive. The first sign of trouble comes with a move to $33, a double bottom sell signal. |
| EFX Equifax Inc. ($140.56) - Business Products - During Tuesday’s trading session, EFX broke a double top at $140, a new chart high as well as the second consecutive buy signal. This stock is an acceptable 3 for 5’er that has been trading above the bullish support line dating back to April 2009 and is showing long term strength relative to both the market and its peers. Additionally, the bullish price objective is $192, suggesting the potential for further upside from here. Okay to initiate new positions on the breakout as demand is in control and the technical picture is positive. The first sign of trouble comes with a move to $130, a double bottom sell signal. |
| KLXI KLX Inc ($52.76) - Aerospace Airline - Shares of KLXI rallied on Tuesday, breaking a triple top at $53, a new all-time high. This stock is a technically sound 3 for 5’er within the favored Aerospace Airline sector. In fact, this stock ranks 3rd out of 51 names in the sector RS matrix. Okay to buy or hold here as the weight of the evidence is positive. The first sell signal from here comes with a move to $46, a double bottom sell signal. |
| MAS Masco Corporation ($38.24) - Building - MAS broke a double top at $38, a new chart high. This stock is an acceptable 3 for 5’er within the favored Building sector that has seen three months of positive monthly momentum. Additionally, the price target is $64, suggesting the potential for further upside from here. Okay to hold here or buy on a pullback as the stock is nearing the top of the 10 week trading band, indicating that it is overbought here. The first sell signal from here comes with a move to $29. |
| PEN Penumbra ($86.95) - Healthcare - Shares of PEN found support at $81 on Monday and rallied to $89 on Tuesday, breaking a triple top at $88 along the way. This stock is a perfect 5 for 5’er as all of its trending and relative strength characteristics are positive here. PEN is within the favored Healthcare sector and has seen four months of positive monthly momentum. Okay to buy or hold here. Note resistance at $90. Support is at $81 and $80, the bullish support line. |
| RES R P C, Inc. ($21.24) - Oil Service - After testing its bullish support line, RES broke a double top at $21. This stock is a strong 4 for 5’er that is trading in a positive trend and is showing long term strength relative to both the market and its peers. RES ranks in the top decile of the Oil Service sector RS matrix, making it one of the stronger names within this space. Okay to hold here or buy on a pullback as the stock is nearing the top of the 10 week trading band. Note resistance at $23. Support is at $19, the bullish support line. |
| RMD ResMed Inc ($75.21) - Healthcare - RMD broke a triple top at $74 and moved higher to $75. This stock is now up against its all-time high set back in April of 2015. RMD is an acceptable 3 for 5’er within the favored Healthcare sector that has seen four weeks of positive weekly momentum. Additionally, the bullish price objective is $93, suggesting the potential for further upside from here. Okay to hold here or buy on a pullback as the stock is nearing the top of the 10 week trading band. The first sign of trouble from here comes with a move to $67, a triple bottom sell signal. A move to $65 would violate the bullish support line, flipping the overall trend negative. |
| SAGE SAGE Therapeutics Inc. ($78.52) - Drugs - After finding support at $74, shares of SAGE rallied to $79, breaking a double top at $78 along the way. This stock is a perfect 5 for 5’er that is trading in a positive trend and is showing superior strength relative to both the market and its peers. Weekly momentum just flipped positive, suggesting the potential for further upside from here. Furthermore, SAGE has a price target of $102, adding to the positive technical picture. Okay to buy or hold here. The first sign of trouble from here comes with a move to $73, a double bottom sell signal while a move to $66 would violate the bullish support line. |
| SEIC SEI Investments Company ($53.49) - Finance - With the most recent action, SEIC broke a double top at $53. This break complete a bullish catapult pattern and marks a new 52 week high on the chart. This stock is a strong 4 for 5’er within the favored Finance sector that has been trading in a positive trend since January 2012. Weekly momentum has been positive for three weeks, suggesting the potential for further upside from here. Okay to buy or hold here as demand is in control and the weight of the evidence is positive. The first sign of trouble comes with a move to $47, a double bottom sell signal. |
| VMC Vulcan Materials Company ($132.26) - Building - VMC broke a double top at $132. This stock is an acceptable 3 for 5’er within the favored Building sector that has a bullish price objective of $162, suggesting the potential for further upside from here. Okay to buy or hold here as demand is in control. Note support at $124, the bullish support line. A move to $122 would break a triple bottom and flip the overall trend negative. Resistance is between the $136 - $138 level. |
| Name | Option Symbol | Action | Stop Loss |
|---|---|---|---|
| Microchip Technology Incorporated - $83.56 | O:MCHP 17J80.00D20 | Buy the October 80.00 calls at 7.20 | 77.00 |
| Name | Option | Action |
|---|---|---|
| Eastman Chemical Company ( EMN) | Jun. 75.00 Calls | Raise the option stop loss to 6.40 (CP: 8.40) |
| Ingersoll-Rand PLC ( IR) | Sep. 77.50 Calls | Raise the option stop loss to 10.60 (CP: 12.60) |
| Comerica Incorporated ( CMA) | Jul. 65.00 Calls | Initiate an option stop loss of 7.35 (CP: 9.35) |
| Hasbro, Inc. ( HAS) | Oct. 95.00 Calls | Raise the option stop loss to 14.10 (CP: 16.10) |
| Manpower Inc ( MAN) | Sep. 100.00 Calls | Raise the option stop loss to 6.60 (CP: 8.60) |
| Citigroup, Inc. ( C) | Aug. 55.00 Calls | Initiate an option stop loss of 7.85 (CP: 9.85) |
| Northern Trust Corporation ( NTRS) | Oct. 85.00 Calls | Raise the option stop loss to 7.50 (CP: 9.50) |
| IntercontinentalExchange Inc. ( ICE) | Dec. 55.00 Calls | Raise the option stop loss to 8.00 (CP: 10.00) |
| Name | Option Symbol | Action | Stop Loss |
|---|---|---|---|
| Michael Kors Holdings Limited - $34.72 | O:KORS 17W37.50D17 | Buy the November 37.50 puts at 4.60 | 40.00 |
| Name | Option | Action |
|---|---|---|
| Anadarko Petroleum Corporation (APC) | Aug. 65.00 Puts | Stopped at 16.15 (CP: 15.70) |
| Carrizo Oil & Gas, Inc. (CRZO) | Oct. 27.50 Puts | Stopped at 6.30 (CP: 5.90) |
| Molson Coors Company (TAP) | Oct. 105.00 Puts | Stopped at 16.10 (CP: 16.10) |
| Name | Option Sym. | Call to Sell | Call Price | Investment for 500 Shares | Annual Called Rtn. | Annual Static Rtn. | Downside Protection |
|---|---|---|---|---|---|---|---|
| Cabot Oil & Gas Corporation $22.78 | O:COG 17J25.00D20 | Oct. 25.00 | 1.45 | $11,063.90 | 33.74% | 15.37% | 5.15% |
| Name | Action |
|---|---|
| Momo Inc (China) ADR (MOMO) - 37.59 | Sell the October 40.00 Calls. |
| The Chemours Company (CC) - 39.76 | Sell the October 44.00 Calls. |
| Lumber Liquidators Holdings Inc (LL) - 26.06 | Sell the November 30.00 Calls. |
| Alcoa Inc. (AA) - 31.78 | Sell the October 35.00 Calls. |
| Dish Network Corporation (DISH) - 64.99 | Sell the September 67.50 Calls. |
| MACOM Technology Solutions Holdings Inc. (MTSI) - 56.49 | Sell the November 60.00 Calls. |
| Micron Technology, Inc. (MU) - 31.20 | Sell the October 32.00 Calls. |
| Name | Covered Write |
|---|---|
|
|
|
Daily Equity & Market Analysis
Loading, Please Wait...
