Most Requested Symbols

The Beta Site for the Dorsey Wright Platform is live! Current DWA subscribers have the ability to access the beta site by clicking on the link in the upper left hand corner of either your custom Dashboard or the Welcome page. The beta site currently reflects phase one of our website redesign, and we are looking for feedback in order to help better the Platform. In addition to the link that transfers user to the beta site, we have also provided a link to the message board where feedback can be provided. Click here to learn more about the beta site.

The American Association of Individual Investors compiles the results of a weekly survey to determine investors' sentiment toward the market. Investors designate whether they feel the market will be higher (Bullish Sentiment), lower (Bearish Sentiment), or remain unchanged (Neutral Sentiment) over the next 6 months. From time to time, we like to bring the results to your attention, as we feel it can often offer interesting perspective. In the image below, we have charted the results of the weekly sentiment survey against the price of the S&P 500 Index SPX to see how investors' feelings may have shifted with market changes through 2017 thus far.
As you can see below, the bias coming in to the year was bullish with nearly half (46.70%) expecting higher prices in the coming months. In fact, bullish sentiment was at the highest level it had been since early 2015 at the beginning of the year. So far, that sentiment has been accurate, with the SPX moving to new highs breaking above $2410 on Thursday. What is interesting to note, however, is that despite these current highs, bullish sentiment has declined substantially from where it began the year, falling to a low of 25% just a month ago. Notice that this change in sentiment hasn't necessarily mapped over to the bearish side, but instead has gone more towards neutral, which recently peaked around 40%.
It is not unusual to see bullish sentiment track the price movement of the major market indexes, while bearish sentiment moves oppositely. That is to say, bullish sentiment increases along with the market, while bearish sentiment increases at market lows; thus serving as a contrarian indicator of sorts. With that in mind, we would not be surprised to see bullish sentiment increase, but as we head into the holiday weekend sentiment remains relatively neutral at these levels.


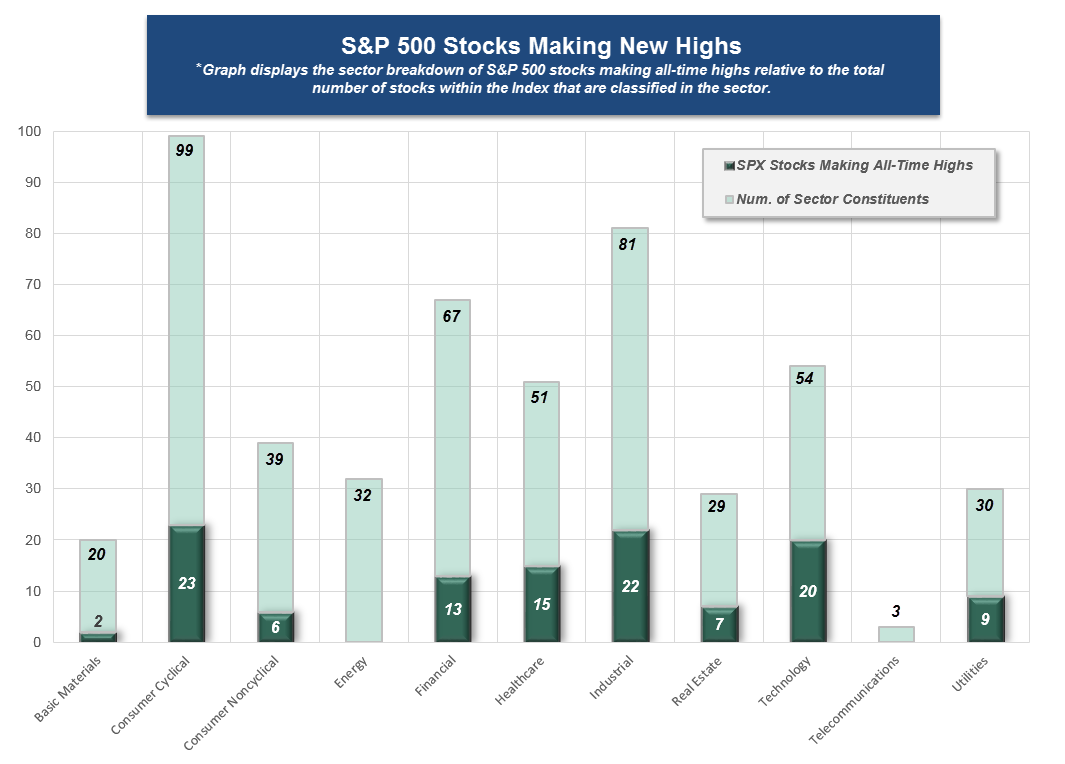
On Thursday, May 25th the S&P 500 Index SPX rallied to an all-time intra-day high of $2,418.71, which bettered the high from May 16th. On the trend chart this move broke a spread triple top at $2410, and cleared near-term resistance from $2400 that dates back to March. The SPX continues to be the dominate index this year, as it has gained 7.87%, while the Mid Cap 400 and Small Cap 600 indices have gained 4.26% and -0.03% (thru 5/25/2017), respectively. Given the move to a new high for the S&P 500, a number of stocks within the index made new all-time highs as well. With that in mind, let's explore some of the sector themes that emerged as a result of the S&P 500 reaching a new high and review some of its constituents that moved to new highs in the month of May, as they present an opportunity for investors seeking exposure to areas offering divergence and strength.

Using data through the close on May 25th, we discovered that 117 stocks (out of the 504 stocks that make up the S&P 500) made an all-time high during the month of May. In the graph below, we have shown the broad sector breakdown of stocks making all-time highs (dark green) and compared those to the total number of stocks in the Index that are classified in the particular sector (light green). We highlighted noteworthy trends from the data below. For the full list of S&P 500 stocks that have made all-time highs during the month of May, click here.
Observations:
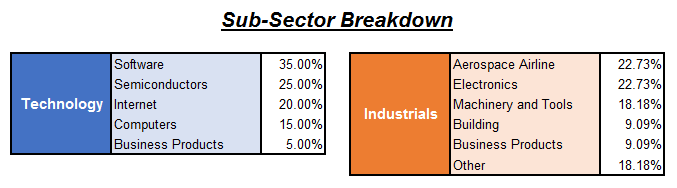
Since most of the stocks making new all-time highs came from only a handful of sectors (Consumer Cyclicals, Industrials, Technology, and Healthcare), we wanted to briefly highlight the sub-sector breakdown as well. Please bear in mind that many, but not all, of the stocks that have made all-time highs during May are in overbought territory. We will highlight the stocks that we believe are actionable even after making an all-time high. If looking to generate a shopping list of stocks, click here in order to get the full list of stocks making all-time highs.
Technology and Industrials have ranked within the top 3 of the DALI sector rankings all year long, and as our graphic above shows, stocks within the sectors have continued to improve. In the sub-sector breakdown below, notice that Software and Semiconductors were the primary sub-sectors within Technology where stocks reached all-time highs. Within Industrials, stocks from the Aerospace Airline and Electronics sub-sectors had the largest representation of new all-time highs. For those who may be looking for exposure to the broad sectors, we would suggest focusing on the four aforementioned sub-sectors as good starting points for idea generation. In the stock highlights below, we focus on two stocks – one from the Software sub-sector and one from Aerospace Airlines.
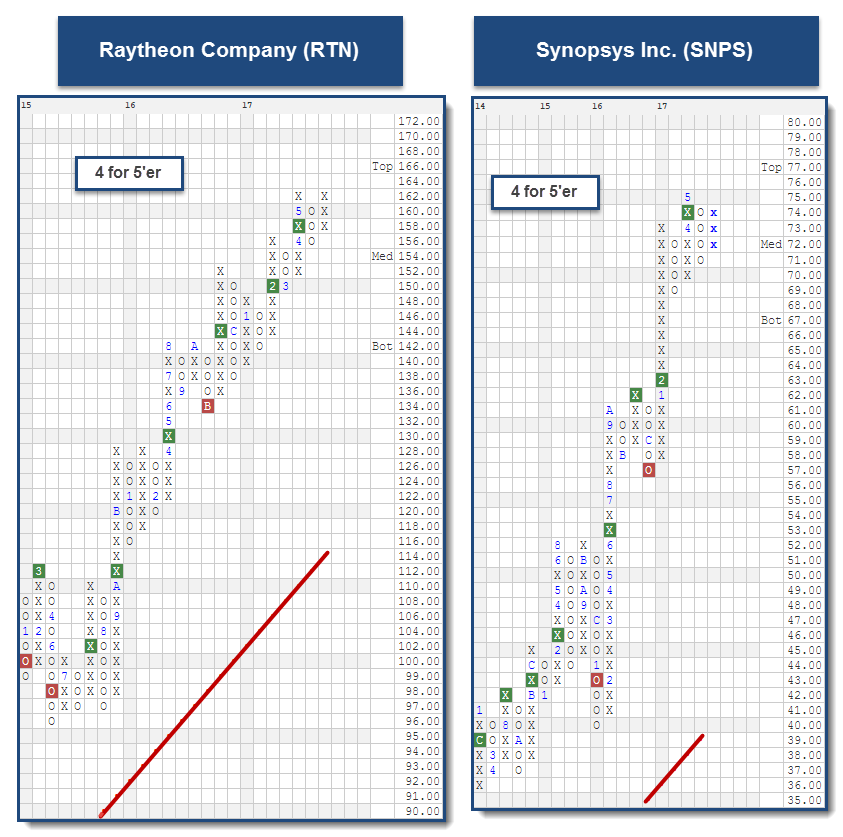
Among the Industrial stocks that we found intriguing was Raytheon Company RTN. The stock is a 4 for 5’er in the favored Aerospace Airline sector, a sector that has been trading a positive trend since December of 2011. RTN maintains positive market relative strength, and the stock currently has positive long-term RS versus its peers. On the trend chart below, RTN has given three consecutive buy signals and has now formed a double top at $162. From here, a move to $164 would break the double top and be a fourth consecutive buy signal. Although RTN is still trading near its highs, we believe the stock is actionable here and could be considered by those seeking Industrials exposure. Those who add here can look to a move to $148 as a possible stop loss point.
Although it may not be the most well-known Software stock, Synopsys Inc. SNPS presents a strong technical picture and could be considered by those seeking Technology exposure. Overall, SNPS is a 4 for 5’er that ranks in the top third of the Software sector matrix. On the trend chart, SNPS has been trading in a positive trend since March of 2009. The stock maintains positive long-term and near-term market relative strength, and positive near-term peer relative strength, as well. SNPS rallied up to its all-time high at $75 earlier this month, and reversed down into a column of O’s with last week’s action. Intra-day action on May 26th has caused the chart to move back into a column of X’s at $74. SNPS could be consider here, and those who may take exposure can look to a move to $68 as a stop loss point.
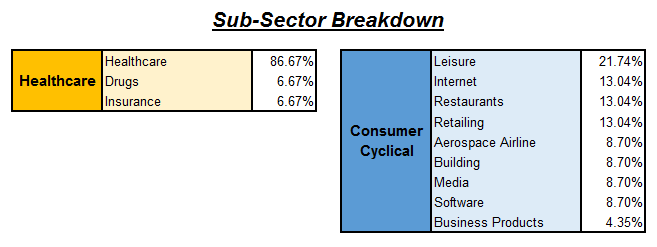
Although Consumer Cyclicals and Healthcare ranks outside of the top half of DALI, they have both shown improvement from a relative strength standpoint. In the DALI sector rankings, Consumer Cyclicals have gone from 8th at the beginning of the year, up to 6th. Healthcare has added 103 buy signals so far this year and climbed from 10th in DALI to 8th. Although Consumer Cyclicals has shown positive returns on a year to date basis – the DWA Consumer Cyclical Index DWAECCONCYC has gained 2.70%, which trails the S&P 500 SPX by 5.17%. Healthcare has been one of the top performers on the year (using the DWA Healthcare Index DWAECHEALTH as a proxy) having posted a gain of 14.64%, compared to the S&P 500 Index SPX, up 7.87% (thru 5/25). Within the sub-sector breakdowns, we discovered that most of the stocks making new all-time highs within Healthcare were simply just broad Healthcare stocks. Meanwhile, Leisure, Internet, Restaurants, and Retailing were the Consumer Cyclical sub-sectors with the largest concentration of new all-time highs. We have highlighted two stocks from the Healthcare and Leisure sub-sectors below.
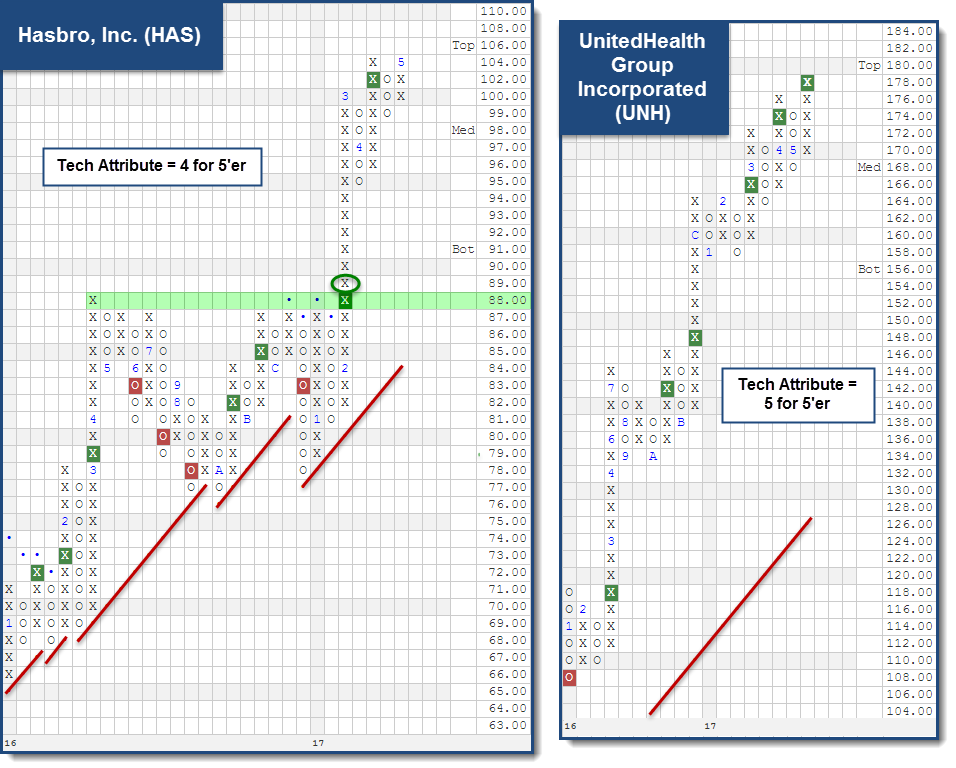
One stock that caught our eye from this list was Hasbro, Inc. HAS. It is a member of the broad Consumer Cyclical sector and the Leisure DWA group. Within the Leisure sector matrix, HAS ranks within the top half out of 53 stocks. In addition, it offers four positive technical attributes and also comes with a yield in excess of 2%. HAS also has a bullish price objective of $139, which suggests the potential for further price appreciation from current levels. Looking to its trend chart, we can see HAS was able to surpass resistance from April 2016 at $88 with the breakout in February. Since then, it has been able to better those highs and currently sits at $104 on its chart. Those interested in gaining exposure may could consider partial positions here, and look to add further exposure on a pullback to the $110 to $99 range. From here, support is at $99 and $95.
Another stock we wanted to highlight is UnitedHealth Group Incorporated UNH. Currently, UNH ranks in the top third of its sector rankings and boasts 5 for 5’er status. UNH also comes with an attractive reward to risk ratio in excess of 2-to-1, if using $162 as a stop. This stock is one that also benefited from the rally after the 2016 Presidential Election. Looking to its trend chart, it was able to make a higher bottom in November at $138 and continued to new highs through December. After developing support at $158, UNH was able to complete a bullish catapult at $174 and now trades at all-time highs in the upper $170’s (after it moved to new all-time highs on May 25, 2017). Those interested in gaining exposure to UNH may do so at current levels or on a pullback. Initial support is offered between $164 and $168 with longer term support coming at $158.
International markets have long been used by US investors to differentiate portfolio return streams, and buffer domestic volatility through diversification. Historically emerging markets have been less correlated to the US and international developed markets with the expectation of accelerated returns over global developed markets.
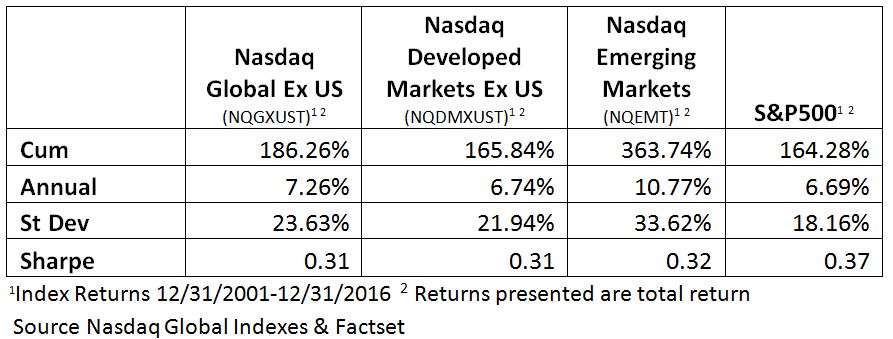
Over the past 15 years, global markets, as measured by the Nasdaq Global ex-US Index, have outperformed the US markets, as represented by the S&P 500 Index, on a total return basis. Emerging markets, as measured by the Nasdaq Emerging Markets Index, have more than doubled the return of the S&P 500, while the Nasdaq International Developed Index and the Global Ex US Index have generated returns slightly higher than the US. None of the international markets have had a higher risk adjusted return than the US over the time period, however. This is often one reason that people underweight international markets; they do not have the risk appetite for the higher volatility without outsized returns. For example, while emerging markets doubles the return of the S&P 500, it also increases the volatility by 85%.
Increasingly investors are turning to low cost, passive ETFs to gain market exposure, allowing advisors to manage a macro portfolio rather than individual company names, as has been popular in the past. Diversified portfolios are prudent, and have been known to work well over longer cycles, however, they have an element of statement risk associated with them, as one asset class dominates multi-year stretches or underperforms the rest of the market. International markets have had this problem over the past three years, as US equities have dominated the majority of other asset classes.
While broad passive beta may be the current preferred investment vehicle, not all investable markets are created equal. The problem with allocating to broad indexes in global markets is the excess exposure to troubled countries and sectors. The majority of popular indexes are cap weighted, so as the portfolio is rebalanced, the index increases exposure to expensive, more developed countries, while underweighting smaller markets. Equal weighted versions of many indexes are also available, but cap weighted indexes continue to be the industry preference.
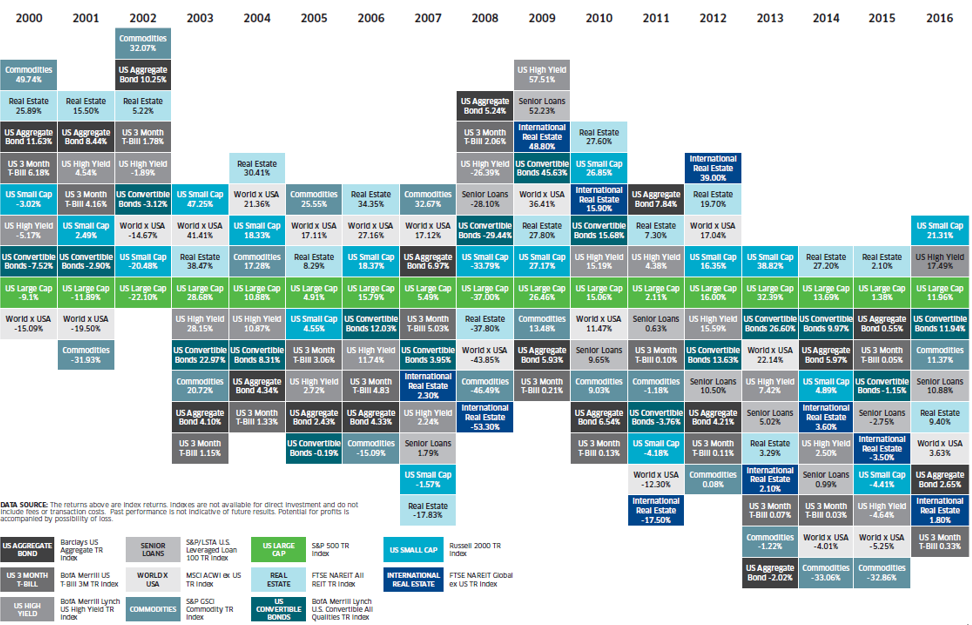
The indexes are constructed to get a broad market exposure, often holding countries that are in political or economic turmoil to meet the construction requirements, and these negatively performing markets have a drag on the performance of the index. During the 1980’s, the Japanese markets continued to climb to new heights, and as a result by 1987 Japan had an almost 40% allocation within the MSCI ACWI Ex US Indexi. This was positive for the Index, as the markets continue to trend upward. However, during the correction a few years later, Japan traded down over 70% and was a large negative position in the Index. Such an example illustrates the importance of country selection wherein countries that are underperforming or experiencing turmoil can be reduced or eliminated from the portfolio. A tactically managed portfolio can rotate away from a country experiencing underperformance, allowing it to reduce the negative exposure.
John Lewis, Senior Portfolio Manager at Nasdaq Dorsey Wright, has written several papers on relative strength and rotation models over the past 10 years that we were able to utilize as the basis for this study. We applied the same methodology used within his 2014 paper, “Sector Rotation with Point & Figure Matrices” that successfully implemented sector rotation models, and we applied it to countries; allowing us to own the countries with the highest relative strength characteristics.
Our model uses a ranking based on Point and Figure (PnF) relative strength to determine which securities have the best momentum. A PnF chart produces a series of columns across the page. A column of X’s indicates the security is performing better than the benchmark, so the ratio line is moving up. A column of O’s indicates the security is underperforming the benchmark, and the ratio line is falling. As columns move across the chart, a series of columns that consist of either X’s or O’s appear in an alternating fashion. When the top of a current column of X’s exceeds the top of the previous column of X’s it is considered a buy signal (see figure 1). When the current column of O’s exceeds the low of the pervious column of O’s that is considered a sell signal. In the most basic interpretation, a Point and Figure relative strength chart has four states:
The Point and Figure column and signal give insight into the intermediate and long-term direction of momentum, respectively. Securities with the best relative strength pattern are those on a buy signal and in a column of X’s, while securities on a sell signal and in a column of O’s are securities investors would want to avoid.
We applied the model to developed markets (DM), emerging markets (EM) and a combined Global ex US portfolio (GXUS). For each universe we constructed a PnF matrix ranking the underlying countries versus each other. We used the Nasdaq classification of Emerging and Developed markets for the model construction. MSCI has the same country classification while the only change that FTSE makes is moving Korea from an emerging to developed country. The models held the top five holdings in the Developed (DM5) and Emerging (EM5) markets. The global portfolio (Global10) expanded the number of holdings to ten holdings to better capture the expanded country universe.
We found that by actively selecting countries based on their relative strength versus the rest of the index constituents, we are able to increase the total return and risk adjusted return versus the original index.
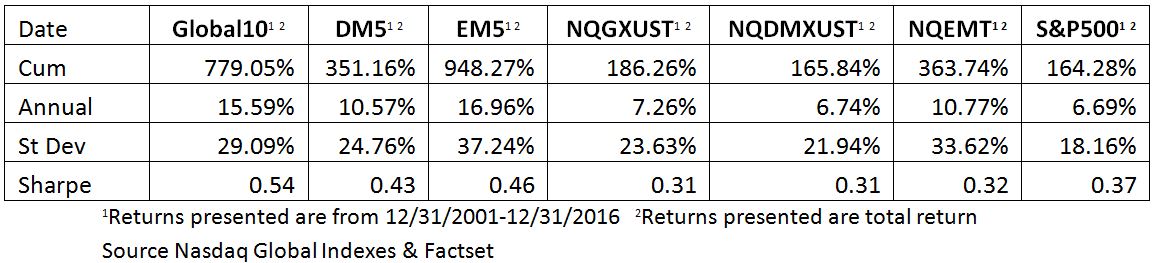
The table above shows that implementing country selection increases the returns of the index by 200%-400%, while only marginally increasing the volatility of the portfolio. Similar to the passive indexes, EM5 had the highest total return in the group over the 15 year time frame, but also with the highest level of volatility. In all of the models, the risk adjusted return was increased by more than 30% handily beating the index, as well as the US markets, as measured by the S&P 500 Index.
The Global10 model has a lower total return than the EM5 model but also had a notably better risk adjusted return. The Global10 portfolio is the best risk adjusted return out of the model portfolios and the comparable indexes including the S&P 500 Index. Unlike a traditional cap weighted Global ex US portfolio, the Global10 model has the ability to adjust, unconstrained, to areas of strength in both emerging and developed markets. During the testing period we found that the Global10 preferred EM to DM during most periods, at times allocating 100% of the portfolio to emerging markets.

*The graph above is based on a strategy back-test that utilizes uninvestable indexes. Please see the disclosures for important information regarding back-testing.
Removing the model’s allocation restraints allows it to find the highest strength countries indiscriminate of human emotion. The excess exposure to EM did not dramatically affect the volatility; however, it did increase the risk adjusted and total return. This is also true of developed markets at times when they may not be the ideal investable universe, such as Japan in the 1990s, Greece in 2014-2015, or Western Europe in 2016. In 2016, the back tested model had a low allocation to European countries during Brexit concerns, and was underweight emerging markets from 2013 to 2015 when emerging markets significantly underperformed developed markets.
In the relative strength Point and Figure chart below, we see that emerging markets and developed markets both have periods of strength and weakness.

Emerging markets, in this example, outperformed developed markets during the last 15 years, however developed markets did have periods of strength, most notably during 2008, and 2012-2014.
Exposure to international markets often comes at the price of higher volatility and periods of underperformance versus US markets. The enhanced return capabilities and portfolio diversification, however, are important considerations to keep in mind in portfolio construction. Through the use of tactical country selection, returns can be increased over a traditional broad index and volatility can be managed effectively to increase the risk adjusted return.
Allocating based on individual country exposure is more calculated than investing in a large market cap index. You can continue to drill down further into each country to make country specific sector bets; however, this can prove difficult in less liquid markets and requires a much larger trading department to trade on each local exchange. Exposure to individual countries is available on US exchanges through the use of ETFs and American Depository Receipts (ADRs). Exposure to the majority of the countries in developed and emerging markets can be garnered through investment in ETFs, some of which allow for broad exposure, while others implement a specific factor tilt.
Dorsey, Wright & Associates, LLC, a Nasdaq Company, is a registered investment advisory firm.
The relative strength strategy is NOT a guarantee. There may be times where all investments and strategies are unfavorable and depreciate in value.
Each investor should carefully consider the investment objectives, risks and expenses of any Exchange-Traded Fund (“ETF”) prior to investing. Before investing in an ETF investors should obtain and carefully read the relevant prospectus and documents the issuer has filed with the SEC. ETFs may result in the layering of fees as ETFs impose their own advisory and other fees.
There are risks inherent in international investments, which may make such investments unsuitable for certain clients. These include, for example, economic, political, currency exchange, rate fluctuations, and limited availability of information on international securities.
Back-tested performance is hypothetical and is provided for informational purposes to illustrate the effects of the strategy during a specific period. The hypothetical returns have been developed and tested by DWA, but have not been verified by any third party and are unaudited. Back-testing performance differs from actual performance because it is achieved through retroactive application of a model investment methodology designed with the benefit of hindsight. Model performance data (both back tested and live) does not represent the impact of material economic and market factors might have on an investment advisor’s decision making process if the advisor were actually managing client money.
Past performance does not guarantee future results. In all securities trading, there is a potential for loss as well as profit. It should not be assumed that recommendations made in the future will be profitable or will equal the performance as shown. Investors should have long-term financial objectives when working with Dorsey, Wright & Associates.
Investors cannot invest directly in an Index.

We “follow” the score system rather than predicting where scores “should be.” We don’t put a lot of weight on the thoughts of where scores should be, but rather where the Scores “are.”
Out of the top 20 movers in score direction, 16 are Non-US related. This sends you the message that 80% of the best acceleration now comes from international markets. The All Global & International score is now at a 3.80 with a direction over 1.50. This group could conceivably get its score above the 4 area. Confidently holding a score above 4 in this macro group puts you back to 2007 and earlier from a relative strength perspective. Clearly you are seeing interesting things in your own inventory and some of those things you have not seen for years.

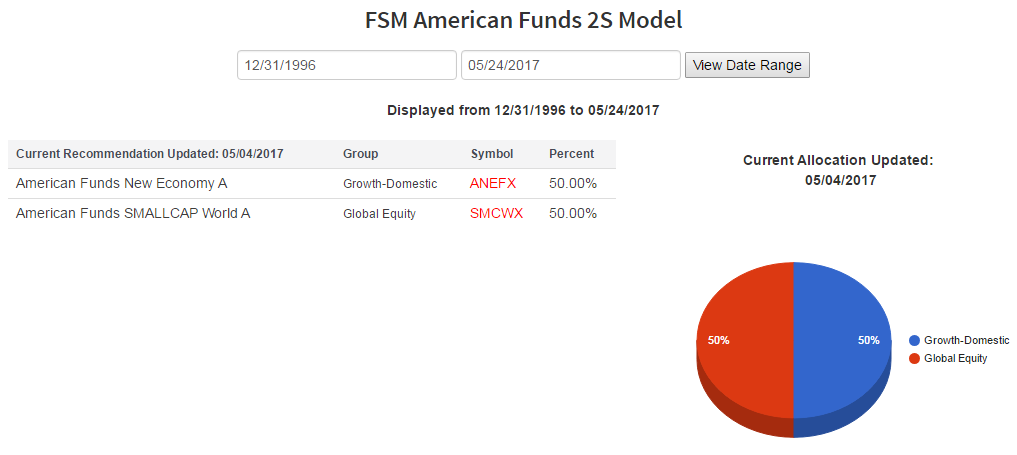
The recent American Funds Model updates show two new entries into the line-up. These assets also include significant Non-US weightings. New Economy, though to be a US fund has a 33% exposure Non-US. Small World has a 47% stake off-shore. Together you get 40% Non-US exposure. That weighing is spread out over Developed and Emerging countries including Europe, which has improved here recently.
Here is the informative part. Since early May, scores for 3 other American Funds have moved into the Top Shelf of the Fund Score readings. Can you guess who they are? You guessed it, New Perspective, EuroPac and New World. At least 2 of these 3 are Top 5 Score contenders as we speak. New Perspective has a 44% Non-US weighting, EuroPac holds 85% Non-US and New World holds 69% off-shore. So that shows you where things are going. For comparative purposes, if the top 5 were constituted today, the result would produce a Non-US weighting of 45%, up from about 25% currently. Yes, I know you already bought the early selected May funds, but keep your hand on the wheel to evaluate these others as you have need. The next regular schedule update to FSM American Funds is in August.
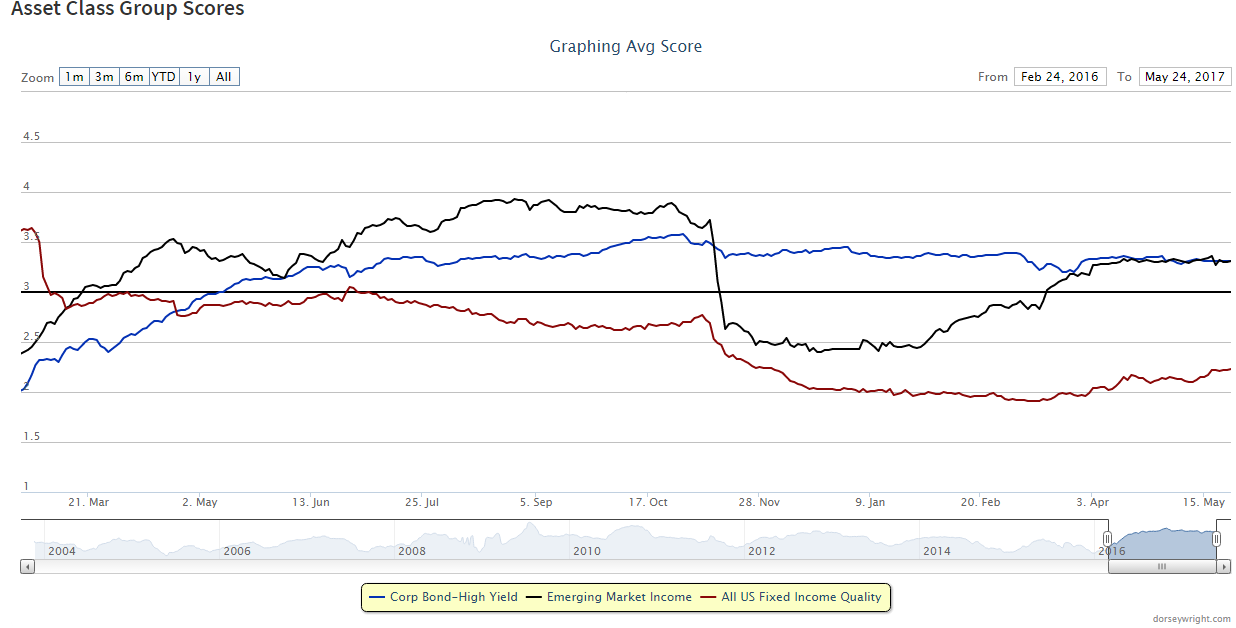
The Fixed Income landscape shows an equivalent score among the major score leaders of US High Yield and Emerging Market Debt. This 3.31 score level is at the top of the FI food chain and these areas are where we been and still continue to advocate. The Emerging Debt class holds the newest boost in score and it is possible, they will return to the mid 4's last seen in the middle 2000's.
With all the good things to say, I also want to point out the US Fixed Income Quality is up-ticking in score. This uptick mode is measurable and can give you an additional unique layer to your allocation. Remember that High Yield and Emerging Market Debt is very much a part of the “Correlated” Fixed Income camp. This means these groups are directly correlated to the US Equity Markets. That’s right, you’re thinking Fixed Income should be completely different from the equity component, and that it will break up the correlation and provide diversity to your allocation. And that is why Quality Fixed Income becomes such a necessary group for your allocation.
The Distribution Report below places Major Market ETFs and Indices into a bell curve style table based upon their current location on their 10-week trading band. The middle of the bell curve represents areas of the market that are "normally" distributed, with the far right being 100% overbought on a weekly distribution and the far left being 100% oversold on a weekly distribution. The weekly distribution ranges are calculated at the end of each week, while the placement within that range will fluctuate during the week. In addition to information regarding the statistical distribution of these market indexes, a symbol that is in UPPER CASE indicates that the RS chart is on a Buy Signal. If the symbol is dark Green then the stock is on a Point & Figure buy signal, and if the symbol is bright Red then it is on a Point & Figure sell signal.
The average Bullish Percent reading this week is 56.41% up 0.71% from the previous week
| <--100 | -100--80 | -80--60 | -60--40 | -40--20 | -20-0 | 0-20 | 20-40 | 40-60 | 60-80 | 80-100 | 100-> | |||
 |
||||||||||||||
| Symbol | Name | Symbol | Name |
| AGG | iShares US Core Bond ETF | NASD | Nasdaq Composite |
| CL/ | Crude Oil Continuous | NDX | NASDAQ-100 Index |
| DJIA | Dow Jones Industrial Average | RSP | Guggenheim S&P 500 Equal Weight ETF |
| DVY | iShares Dow Jones Select Dividend Index | RUT | Russell 2000 Index |
| DX/Y | NYCE U.S.Dollar Index Spot | SHY | iShares Barclays 1-3 Year Tres. Bond Fund |
| EFA | iSharesMSCI EAFE Index Fund | SML | S&P 600 Small Cap Index |
| FXE | CurrencyShares Euro Trust | SPX | S & P 500 Index |
| GC/ | Gold Continuous | TLT | iShares Barclays 20+ Year Treasury Bond Fund |
| GSG | iShares S&P GSCI Commodity-Indexed Trust | UV/Y | Continuous Commodity Index |
| HYG | iShares iBoxx $ High Yield Corporate Bond ETF | VOOG | Vanguard S&P 500 Growth ETF |
| ICF | iShares Cohen & Steers Realty Index | VOOV | Vanguard S&P 500 Value ETF |
| IEF | iShares Barclays 7-10 Yr. Tres. Bond Fund | VWO | Vanguard FTSE Emerging Markets ETF |
| LQD | iShares iBoxx $ Investment Grade Corp. | XLG | Guggenheim S&P 500 Top 50 ETF |
| MID | S&P 400 MidCap Index |

| Stock | Symbol | Sector | Current Price | Action Price | Target | Stop | Notes |
|---|---|---|---|---|---|---|---|
| Rockwell Automation, Inc. | ROK | Electronics | $159.26 | Hi 150s | 170 | 146 | 5 for 5'er, pulled back creating entry point, pos wkly mom change. |
| Cummins Inc. | CMI | Machinery and Tools | $155.86 | 154 - 158 | 200 | 142 | Favored sector, Triple top completes Shakeout Use pullback to initiate positions, Positive trend RS charts in Xs. |
| Leidos Holdings Inc. | LDOS | Computers | $55.13 | 53-55 | 63 | 47 | 5 for 5'er, favored Comp sector, above average yield, R-R > 2, pos wkly mom change |
| Arch Capital Group Ltd. | ACGL | Insurance | $95.04 | mid-90s | 111 | 91/84 | 4/5'er, Positive weekly momentum change, "90 to 100" candidate. |
| Cirrus Logic Inc | CRUS | Semiconductors | $65.84 | mid-60s | 95 | 58 | 5/5'er, Great risk-reward, Strong sector, Can be used as covered write (Sept. 70 calls). |
| LogMeIn, Inc. | LOGM | Internet | $110.10 | 110-116 | 175 | 89 | 5/5'er, High ranking in INET sector matrix, pullback to top of base, Potential covered write (September 115 calls). |
| Manpower Inc | MAN | Business Products | $102.35 | 99-104 | TOP (112) | 97/91 | 3 for 5'er, top 20% of BUSI sector matrix, pos wkly mom change, middle of trading band. |
| Canadian Pacific Railway Limited | CP | Transports/Non Air | $159.33 | 150s | 194 | 138 | 4/5'er, Major breakout at $158 this month, Positive Monthly Momentum change. |
| Callidus Software | CALD | Software | $22.60 | 20-22 | 32.5 | 18 | 4/5'er, Big Base Breakout, Strengthening stock in strong sector. |
| Synopsys Inc | SNPS | Software | $73.53 | 72-74 | 106 | 68 | 4 for 5'er, favored Software sector, R-R > 5-to-1 |
| Stock | Symbol | Sector | Current Price | Action Price | Target | Stop | Notes |
|---|---|---|---|---|---|---|---|
| Simon Property Group, Inc. | SPG | Real Estate | $160.70 | (160-170) | 140 | 182 | 1/5'er, Recent RS Sell Signal, Move to "low attribute" rating for first time since early-2009. |
| Dollar General Corp. | DG | Retailing | $72.47 | (BO/69) | 60 | 76 | 1/5'er, Recent RS Sell Signal, Low Ranking in Laggard sector (Retail), Pot. Bearish Triangle, Lower buy stop to $76, Earn. 6/1. |
| Genesee & Wyoming Inc | GWR | Transports/Non Air | $65.56 | mid 60's | 51 | 72 | 0 for 5'er, bottom of unfavored Non Air Transport sector matrix, bearish R-R > 2, negative diverger. |
| Comment |
|---|
| BBY Best Buy Co., Inc. R ($59.16) - Retailing - Shares of BBY rallied above $61 on Thursday, after a well-received earnings call. The stock is now trading at more than 240% overbought levels. Those with long positions from the initial recommendation back in February, can use this rally as an opportunity to take partial or full profits. Our initial price objective was $63, and we are now within 4 points of that target. |
SNPS Synopsys Inc R ($74.41) - Software - SNPS is a 4 for 5'er within the favored Software sector, and is nearing the top quartile of the sector's matrix as well. It's chart offers a recent series of higher tops and higher bottoms after a long stem up from $57 to $73 in the beginning of the year. With an upside target of $106 and good support afforded in the upper 60's, the reward-to-risk opportunity is nearing more than 5-to-1. Okay to consider new long positions between $72 and $74, with a stop afforded at $68.
| 08 | 09 | 10 | 12 | 13 | 14 | 15 | 16 | 17 | ||||||||||||||||||||||||||||||||||||||||||||||
| 75.00 | 5 | 75.00 | ||||||||||||||||||||||||||||||||||||||||||||||||||||
| 74.00 | X | O | x | 74.00 | ||||||||||||||||||||||||||||||||||||||||||||||||||
| 73.00 | X | 4 | O | x | 73.00 | |||||||||||||||||||||||||||||||||||||||||||||||||
| 72.00 | X | O | X | O | x | Med | 72.00 | |||||||||||||||||||||||||||||||||||||||||||||||
| 71.00 | X | O | X | O | 71.00 | |||||||||||||||||||||||||||||||||||||||||||||||||
| 70.00 | X | O | X | 70.00 | ||||||||||||||||||||||||||||||||||||||||||||||||||
| 69.00 | X | O | 69.00 | |||||||||||||||||||||||||||||||||||||||||||||||||||
| 68.00 | X | 68.00 | ||||||||||||||||||||||||||||||||||||||||||||||||||||
| 67.00 | X | Bot | 67.00 | |||||||||||||||||||||||||||||||||||||||||||||||||||
| 66.00 | X | 66.00 | ||||||||||||||||||||||||||||||||||||||||||||||||||||
| 65.00 | X | 65.00 | ||||||||||||||||||||||||||||||||||||||||||||||||||||
| 64.00 | X | 64.00 | ||||||||||||||||||||||||||||||||||||||||||||||||||||
| 63.00 | 2 | 63.00 | ||||||||||||||||||||||||||||||||||||||||||||||||||||
| 62.00 | X | 1 | 62.00 | |||||||||||||||||||||||||||||||||||||||||||||||||||
| 61.00 | A | X | O | X | 61.00 | |||||||||||||||||||||||||||||||||||||||||||||||||
| 60.00 | 9 | O | X | O | X | 60.00 | ||||||||||||||||||||||||||||||||||||||||||||||||
| 59.00 | X | O | X | C | X | 59.00 | ||||||||||||||||||||||||||||||||||||||||||||||||
| 58.00 | X | B | O | X | 58.00 | |||||||||||||||||||||||||||||||||||||||||||||||||
| 57.00 | X | O | 57.00 | |||||||||||||||||||||||||||||||||||||||||||||||||||
| 56.00 | 8 | 56.00 | ||||||||||||||||||||||||||||||||||||||||||||||||||||
| 55.00 | 7 | 55.00 | ||||||||||||||||||||||||||||||||||||||||||||||||||||
| 54.00 | X | 54.00 | ||||||||||||||||||||||||||||||||||||||||||||||||||||
| 53.00 | X | 53.00 | ||||||||||||||||||||||||||||||||||||||||||||||||||||
| 52.00 | 8 | X | 6 | 52.00 | ||||||||||||||||||||||||||||||||||||||||||||||||||
| 51.00 | 6 | O | B | O | X | 51.00 | ||||||||||||||||||||||||||||||||||||||||||||||||
| 50.00 | X | O | X | O | 5 | 50.00 | ||||||||||||||||||||||||||||||||||||||||||||||||
| 49.00 | 5 | O | A | O | 4 | 49.00 | ||||||||||||||||||||||||||||||||||||||||||||||||
| 48.00 | 4 | O | 9 | O | X | 48.00 | ||||||||||||||||||||||||||||||||||||||||||||||||
| 47.00 | X | O | X | C | 3 | 47.00 | ||||||||||||||||||||||||||||||||||||||||||||||||
| 46.00 | X | O | X | O | X | 46.00 | ||||||||||||||||||||||||||||||||||||||||||||||||
| 45.00 | X | 2 | O | X | O | X | 45.00 | |||||||||||||||||||||||||||||||||||||||||||||||
| 44.00 | C | O | X | O | 1 | X | 44.00 | |||||||||||||||||||||||||||||||||||||||||||||||
| 43.00 | X | O | X | O | 2 | 43.00 | ||||||||||||||||||||||||||||||||||||||||||||||||
| 42.00 | X | B | 1 | O | X | 42.00 | ||||||||||||||||||||||||||||||||||||||||||||||||
| 41.00 | 1 | X | O | X | O | X | 41.00 | |||||||||||||||||||||||||||||||||||||||||||||||
| 40.00 | X | O | 8 | O | X | O | 40.00 | |||||||||||||||||||||||||||||||||||||||||||||||
| 39.00 | C | O | X | A | X | • | 39.00 | |||||||||||||||||||||||||||||||||||||||||||||||
| 38.00 | 8 | X | 3 | X | O | X | • | 38.00 | ||||||||||||||||||||||||||||||||||||||||||||||
| 37.00 | 6 | O | X | 4 | O | • | 37.00 | |||||||||||||||||||||||||||||||||||||||||||||||
| 36.00 | X | O | X | • | 36.00 | |||||||||||||||||||||||||||||||||||||||||||||||||
| 35.00 | 2 | A | • | 35.00 | ||||||||||||||||||||||||||||||||||||||||||||||||||
| 34.00 | 9 | • | 34.00 | |||||||||||||||||||||||||||||||||||||||||||||||||||
| 33.00 | X | • | 33.00 | |||||||||||||||||||||||||||||||||||||||||||||||||||
| 32.00 | 8 | • | 32.00 | |||||||||||||||||||||||||||||||||||||||||||||||||||
| 31.00 | 3 | 7 | • | 31.00 | ||||||||||||||||||||||||||||||||||||||||||||||||||
| 30.00 | • | 2 | O | X | • | 30.00 | ||||||||||||||||||||||||||||||||||||||||||||||||
| 29.00 | X | • | X | 1 | O | X | • | 29.00 | ||||||||||||||||||||||||||||||||||||||||||||||
| 28.00 | 6 | A | O | • | 2 | O | C | 5 | • | 28.00 | ||||||||||||||||||||||||||||||||||||||||||||
| 27.00 | O | X | O | X | O | X | • | • | X | O | A | • | 27.00 | |||||||||||||||||||||||||||||||||||||||||
| 26.00 | O | X | O | X | B | C | O | X | • | C | 3 | X | • | 26.00 | ||||||||||||||||||||||||||||||||||||||||
| 25.00 | 5 | 7 | X | O | X | O | 5 | O | • | A | 6 | X | • | 25.00 | ||||||||||||||||||||||||||||||||||||||||
| 24.00 | 8 | X | O | X | 1 | X | O | • | 9 | 7 | X | • | 24.00 | |||||||||||||||||||||||||||||||||||||||||
| 23.00 | O | O | O | X | 8 | • | X | 8 | X | • | 23.00 | |||||||||||||||||||||||||||||||||||||||||||
| 22.00 | O | • | O | • | 4 | 9 | O | • | 22.00 | |||||||||||||||||||||||||||||||||||||||||||||
| 21.00 | • | • | O | • | • | X | O | 8 | • | 21.00 | ||||||||||||||||||||||||||||||||||||||||||||
| 20.00 | • | O | • | X | X | • | X | O | X | • | 20.00 | |||||||||||||||||||||||||||||||||||||||||||
| 19.50 | • | 9 | • | X | 2 | O | X | O | X | 5 | X | • | 19.50 | |||||||||||||||||||||||||||||||||||||||||
| 19.00 | • | A | • | 1 | O | X | O | X | O | X | O | X | • | 19.00 | ||||||||||||||||||||||||||||||||||||||||
| 18.50 | • | O | X | X | X | • | X | O | X | O | O | X | 7 | X | • | 18.50 | ||||||||||||||||||||||||||||||||||||||
| 18.00 | • | O | X | O | X | O | X | O | X | • | X | O | 3 | X | O | • | 18.00 | |||||||||||||||||||||||||||||||||||||
| 17.50 | O | X | O | X | O | X | O | X | O | X | • | O | • | • | 17.50 | |||||||||||||||||||||||||||||||||||||||
| 17.00 | O | X | O | X | O | X | B | X | O | X | • | • | 17.00 | |||||||||||||||||||||||||||||||||||||||||
| 16.50 | O | X | O | O | X | O | X | O | • | 16.50 | ||||||||||||||||||||||||||||||||||||||||||||
| 16.00 | O | X | O | X | O | X | X | • | 16.00 | |||||||||||||||||||||||||||||||||||||||||||||
| 15.50 | O | O | O | X | O | X | • | 15.50 | ||||||||||||||||||||||||||||||||||||||||||||||
| 15.00 | O | X | O | X | • | 15.00 | ||||||||||||||||||||||||||||||||||||||||||||||||
| 14.50 | O | X | C | • | 14.50 | |||||||||||||||||||||||||||||||||||||||||||||||||
| 14.00 | O | • | • | 14.00 | ||||||||||||||||||||||||||||||||||||||||||||||||||
| 08 | 09 | 10 | 12 | 13 | 14 | 15 | 16 | 17 |
| Comments |
|---|
| ABG Asbury Automotive Group Inc. ($55.35) - Retailing - broke a double bottom at $55. After failing at its bearish resistance line at $65, the stock has moved back to a sell signal with the next support not until $48. Continue to avoid ABG and if long consider moving to the sidelines here or on any bounce. The weekly and monthly momentums have also turned negative. |
| ALXN Alexion Pharmaceuticals ($97.48) - Biomedics/Genetics - broke a double bottom at $98. After rallying in May to break the bearish resistance line at $132 ALXN immediately sold off and moved back to a negative trend. It has had a sub 3 technical attribute count since March. We would continue to avoid ALXN. However, it is now significantly oversold and to see a bounce from here would not be a surprise. If long we would consider watching for that bounce to exit. |
| BIVV Bioverativ Inc ($57.69) - Biomedics/Genetics - broke a double top at $56. The chart is limited to 1 years data but it has now given three consecutive buy signals. There is not enough data yet for RS signals but the market and peer RS charts for BIVV are in Xs showing good shorter term relative strength. Traders can watch for a pullback to the $54 area to trade BIVV. A tight stop loss can be kept at $51 whcih would be a triple bottom break. Otherwise use $48, a violation of the bullish support line. |
| CRL Charles River Lab. Internat'l, Inc. ($92.85) - Biomedics/Genetics - broke a double top at $93. The stock is a 3 for 5'er and this is the fourth consecutive buy signal and new chart high. Demand is in control of the chart and traders can consider positions here and on pullbacks. Trouble will be a move to $86, a triple bottom break. |
| CRTO Criteo SA ($55.56) - Internet - broke a triple top at $56. The stock held strong support at $49 and reversed back to Xs to start a shakeout formation. This break completes that formation and puts the stock at previous chart highs. CRTO is a 4 for 5'er and partial positions can be considered here and pullbacks used to purchase additional shares. An initial stop loss can be kept at $47, a violation of the bullish support line which follows a spread quadruple bottom break. |
| ICLR Icon PLC - Sponsored (Ireland) ADR ($91.45) - Healthcare - broke a double top at $91. This is the second consecutive buy signal for this 4 for 5'er and take sit to a new chart high. Demand is in control of the chart but ICLR is now near the top of its distribution we would look to initiate partial positions and use pullbacks to add to them. A near term stop can be kept at $85, a double bottom break. Those willing to give it more room can use $79 which will be a violation of the bullish support line. |
| NSC Norfolk Southern Corporation ($122.17) - Transports/Non Air - broke a double top at $122. This break completes a bullish triangle formation and is the third consecutive buy signal. NSC is a 4 for 5'er and has a strong price objective of $157. With demand in control, positions can be considered here. An initial stop loss can be kept at $104, a spread double bottom break. |
| OZRK Bank of the Ozarks ($45.72) - Banks - Since peaking in February at $56, the trend chart of OZRK has been trading in a series of lower tops and lower bottoms, resulting in the formation of a bearish signal. With the recent market action, OZRK managed to reverse up into X's, taking it up from the bullish support line. This move has also taken OZRK a step closer to reversing the bearish signal. If OZRK breaks a double top from here at $51, the bearish signal would be reversed. Okay to consider OZRK on such a breakout. A move to $44 from here would violate the bullish support and shift the trend to negative for the first time since April 2002. |
| SFTBF Softbank Corp. ($80.27) - Internet - With the most recent action, SFTBF broke a double top buy signal at $79, which completed the bullish triangle pattern. The trend is positive here and it's a 3 for 5'er. Okay to consider SFTBF on the breakout. Near term support can be found at $74 so the first sign of trouble would be a violation of that support at $73, a double bottom sell signal. |
| THO Thor Industries, Inc. ($91.77) - Leisure - brkle a double bottom at $90. This is the third consecutive sell signal showing supply in control. Additionally, the RS charts are in Os showing poor recent relative strength. Continue to avoid THO. |
| VLO Valero Energy Corp ($62.46) - Oil - broke a triple bottom at $63. Although the stock is a 5 for 5'er, this is the second consecutive sell signal since January 2017. The stock is now just above its bullish support line which is at $62. We would not be buyers here but if long would give it room to $61 to see that it violates the bullish support line. |
| WGO Winnebago Industries, Inc. ($25.45) - Leisure - broke a double bottom at $25. The stock has made lowe top s and this is the second consecutive sell signal. Supply has gained control of the chart. The next support is not until the bullish support line at $19. No new positions in WGO here and if long would consider moving to the sidelines or hedging in some fashion. Both the Market and Peer RS charts are in Os indication poor near term relative strength. |
| Name | Option Symbol | Action | Stop Loss |
|---|---|---|---|
| Callidus Software - $22.93 | O:CALD 17I20.00D15 | Buy the September 20.00 calls at 0.00 | 18.00 |
| Name | Option | Action |
|---|---|---|
| Dunkin Brands Group Inc ( DNKN) | Sep. 50.00 Calls | Raise the option stop loss to 6.10 (CP: 8.10) |
| Caterpillar, Inc. ( CAT) | Aug. 97.50 Calls | Raise the option stop loss to 7.30 (CP: 9.30) |
| Name | Option Symbol | Action | Stop Loss |
|---|---|---|---|
| Molson Coors Company - $95.85 | O:TAP 17V105.00D20 | Buy the October 105.00 puts at 10.60 | 104.00 |
| Name | Option | Action |
|---|---|---|
| Nordstrom, Inc. (JWN) | Jul. 50.00 Puts | Stopped at 7.65 (CP: 7.65) |
| Name | Option Sym. | Call to Sell | Call Price | Investment for 500 Shares | Annual Called Rtn. | Annual Static Rtn. | Downside Protection |
|---|---|---|---|---|---|---|---|
| United Continental Holdings Inc. $81.41 | O:UAL 17I82.50D15 | Sep. 82.50 | 5.25 | $38,462.80 | 20.17% | 18.57% | 5.39% |
| Name | Action |
|---|---|
| Micron Technology, Inc. (MU) - 29.43 | Sell the July 29.00 Calls. |
| Momo Inc (China) ADR (MOMO) - 38.41 | Sell the October 40.00 Calls. |
| The Chemours Company (CC) - 42.31 | Sell the October 44.00 Calls. |
| Lumentum Holdings Inc (LITE) - 56.45 | Sell the September 55.00 Calls. |
| Lumber Liquidators Holdings Inc (LL) - 29.88 | Sell the November 30.00 Calls. |
| Cabot Oil & Gas Corporation (COG) - 22.85 | Sell the October 25.00 Calls. |
| Dish Network Corporation (DISH) - 63.90 | Sell the September 65.00 Calls. |
| Alcoa Inc. (AA) - 33.09 | Sell the October 35.00 Calls. |
| Name | Covered Write |
|---|---|
|
|
|
Daily Equity & Market Analysis
Loading, Please Wait...
