Non-US Weighting Increase.
We “follow” the score system rather than predicting where scores “should be.” We don’t put a lot of weight on the thoughts of where scores should be, but rather where the Scores “are.”
Out of the top 20 movers in score direction, 16 are Non-US related. This sends you the message that 80% of the best acceleration now comes from international markets. The All Global & International score is now at a 3.80 with a direction over 1.50. This group could conceivably get its score above the 4 area. Confidently holding a score above 4 in this macro group puts you back to 2007 and earlier from a relative strength perspective. Clearly you are seeing interesting things in your own inventory and some of those things you have not seen for years.

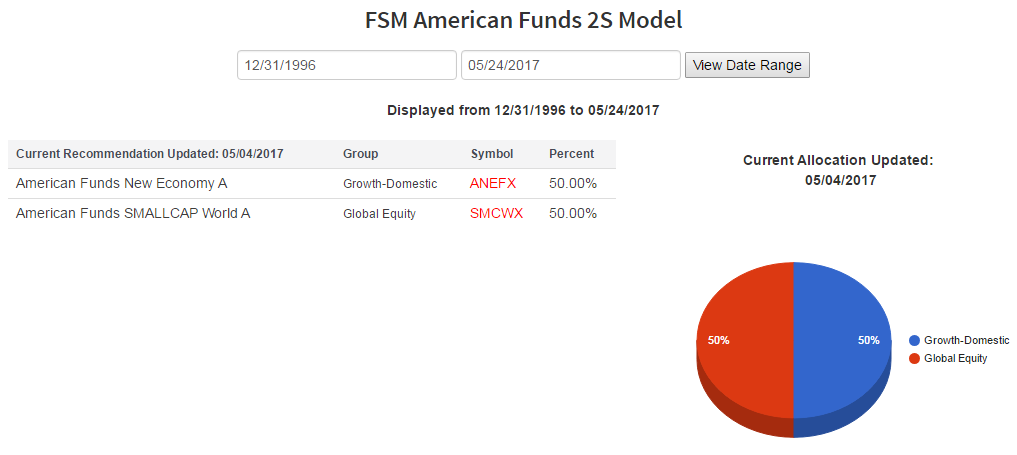
The recent American Funds Model updates show two new entries into the line-up. These assets also include significant Non-US weightings. New Economy, though to be a US fund has a 33% exposure Non-US. Small World has a 47% stake off-shore. Together you get 40% Non-US exposure. That weighing is spread out over Developed and Emerging countries including Europe, which has improved here recently.
Here is the informative part. Since early May, scores for 3 other American Funds have moved into the Top Shelf of the Fund Score readings. Can you guess who they are? You guessed it, New Perspective, EuroPac and New World. At least 2 of these 3 are Top 5 Score contenders as we speak. New Perspective has a 44% Non-US weighting, EuroPac holds 85% Non-US and New World holds 69% off-shore. So that shows you where things are going. For comparative purposes, if the top 5 were constituted today, the result would produce a Non-US weighting of 45%, up from about 25% currently. Yes, I know you already bought the early selected May funds, but keep your hand on the wheel to evaluate these others as you have need. The next regular schedule update to FSM American Funds is in August.
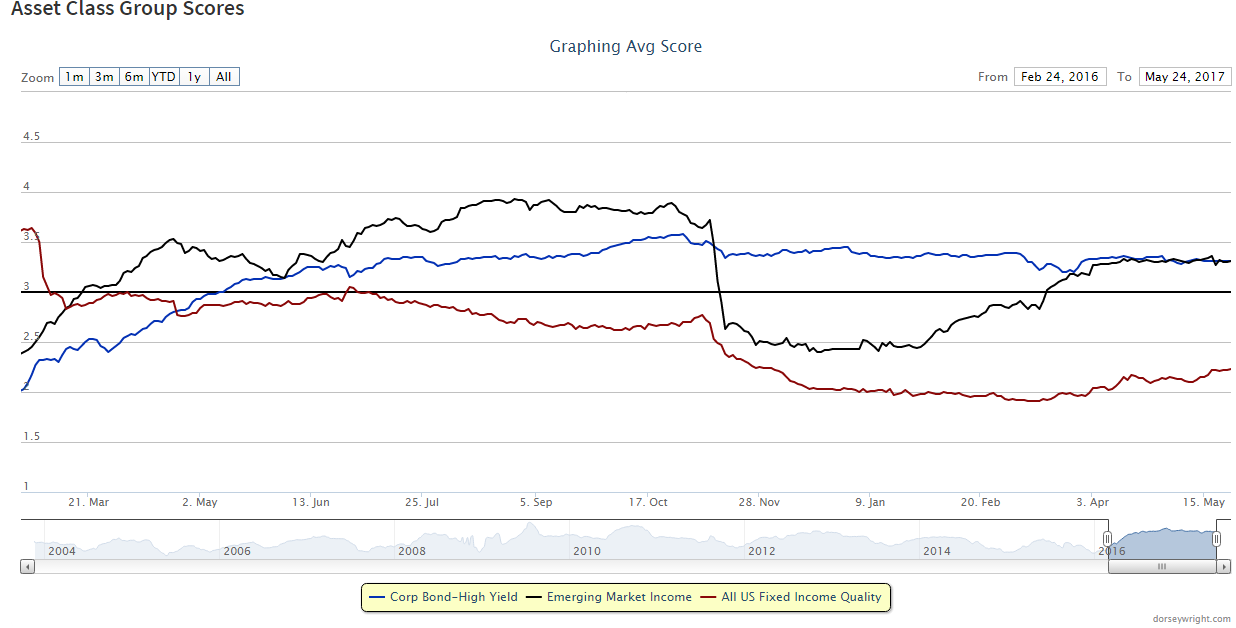
The Fixed Income landscape shows an equivalent score among the major score leaders of US High Yield and Emerging Market Debt. This 3.31 score level is at the top of the FI food chain and these areas are where we been and still continue to advocate. The Emerging Debt class holds the newest boost in score and it is possible, they will return to the mid 4's last seen in the middle 2000's.
With all the good things to say, I also want to point out the US Fixed Income Quality is up-ticking in score. This uptick mode is measurable and can give you an additional unique layer to your allocation. Remember that High Yield and Emerging Market Debt is very much a part of the “Correlated” Fixed Income camp. This means these groups are directly correlated to the US Equity Markets. That’s right, you’re thinking Fixed Income should be completely different from the equity component, and that it will break up the correlation and provide diversity to your allocation. And that is why Quality Fixed Income becomes such a necessary group for your allocation.