With action on May 25th, the S&P 500 Index made a new all-time high. Not only has the Index made new highs, but there have been numerous stocks that have made all-time highs as well. We will delve into what sectors those stocks making new highs are coming from.
On Thursday, May 25th the S&P 500 Index SPX rallied to an all-time intra-day high of $2,418.71, which bettered the high from May 16th. On the trend chart this move broke a spread triple top at $2410, and cleared near-term resistance from $2400 that dates back to March. The SPX continues to be the dominate index this year, as it has gained 7.87%, while the Mid Cap 400 and Small Cap 600 indices have gained 4.26% and -0.03% (thru 5/25/2017), respectively. Given the move to a new high for the S&P 500, a number of stocks within the index made new all-time highs as well. With that in mind, let's explore some of the sector themes that emerged as a result of the S&P 500 reaching a new high and review some of its constituents that moved to new highs in the month of May, as they present an opportunity for investors seeking exposure to areas offering divergence and strength.

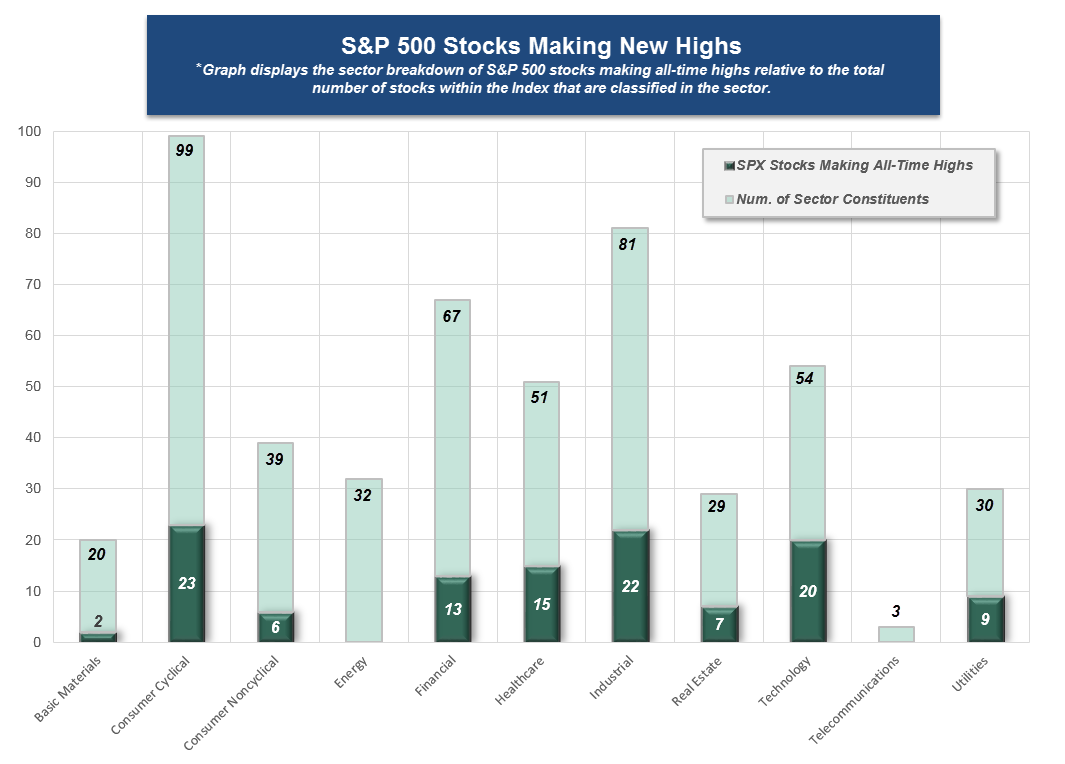
Using data through the close on May 25th, we discovered that 117 stocks (out of the 504 stocks that make up the S&P 500) made an all-time high during the month of May. In the graph below, we have shown the broad sector breakdown of stocks making all-time highs (dark green) and compared those to the total number of stocks in the Index that are classified in the particular sector (light green). We highlighted noteworthy trends from the data below. For the full list of S&P 500 stocks that have made all-time highs during the month of May, click here.
Observations:
- 80 out of the 117 stocks (or 68%) that made new all-time highs came from Consumer Cyclicals, Industrials, Technology, and Healthcare.
- 37% of the stocks in the Index that are classified as Technology made new all-time highs in May. Meanwhile, 23% of S&P 500 Consumer Cyclicals stocks and 27% of S&P 500 Industrials stocks made new all-time highs in May.
- There were no S&P 500 stocks from the Energy or Telecommunications sectors that were able to make new all-time high in May (through May 25, 2017).
- The average market capitalization of the SPX stocks that have made all-time highs during May is $66 billion, and 16 (out of 117) have market capitalizations in excess of $100 billion.
Since most of the stocks making new all-time highs came from only a handful of sectors (Consumer Cyclicals, Industrials, Technology, and Healthcare), we wanted to briefly highlight the sub-sector breakdown as well. Please bear in mind that many, but not all, of the stocks that have made all-time highs during May are in overbought territory. We will highlight the stocks that we believe are actionable even after making an all-time high. If looking to generate a shopping list of stocks, click here in order to get the full list of stocks making all-time highs.
Technology and Industrials
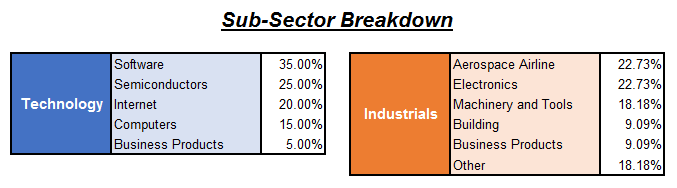
Technology and Industrials have ranked within the top 3 of the DALI sector rankings all year long, and as our graphic above shows, stocks within the sectors have continued to improve. In the sub-sector breakdown below, notice that Software and Semiconductors were the primary sub-sectors within Technology where stocks reached all-time highs. Within Industrials, stocks from the Aerospace Airline and Electronics sub-sectors had the largest representation of new all-time highs. For those who may be looking for exposure to the broad sectors, we would suggest focusing on the four aforementioned sub-sectors as good starting points for idea generation. In the stock highlights below, we focus on two stocks – one from the Software sub-sector and one from Aerospace Airlines.
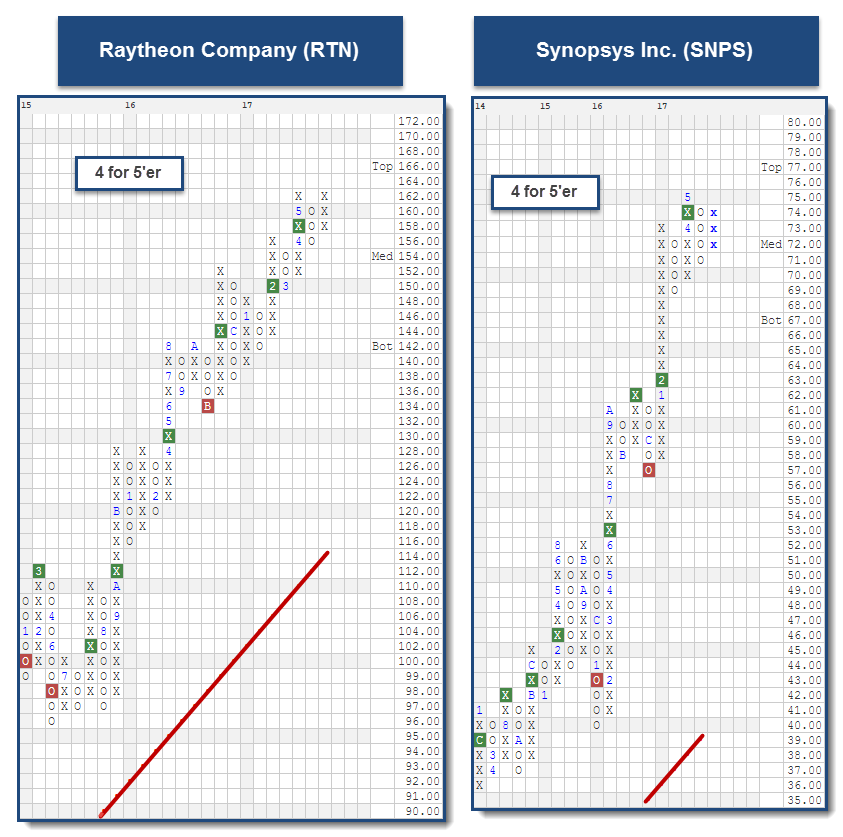
Among the Industrial stocks that we found intriguing was Raytheon Company RTN. The stock is a 4 for 5’er in the favored Aerospace Airline sector, a sector that has been trading a positive trend since December of 2011. RTN maintains positive market relative strength, and the stock currently has positive long-term RS versus its peers. On the trend chart below, RTN has given three consecutive buy signals and has now formed a double top at $162. From here, a move to $164 would break the double top and be a fourth consecutive buy signal. Although RTN is still trading near its highs, we believe the stock is actionable here and could be considered by those seeking Industrials exposure. Those who add here can look to a move to $148 as a possible stop loss point.
Although it may not be the most well-known Software stock, Synopsys Inc. SNPS presents a strong technical picture and could be considered by those seeking Technology exposure. Overall, SNPS is a 4 for 5’er that ranks in the top third of the Software sector matrix. On the trend chart, SNPS has been trading in a positive trend since March of 2009. The stock maintains positive long-term and near-term market relative strength, and positive near-term peer relative strength, as well. SNPS rallied up to its all-time high at $75 earlier this month, and reversed down into a column of O’s with last week’s action. Intra-day action on May 26th has caused the chart to move back into a column of X’s at $74. SNPS could be consider here, and those who may take exposure can look to a move to $68 as a stop loss point.
Consumer Cyclicals and Healthcare
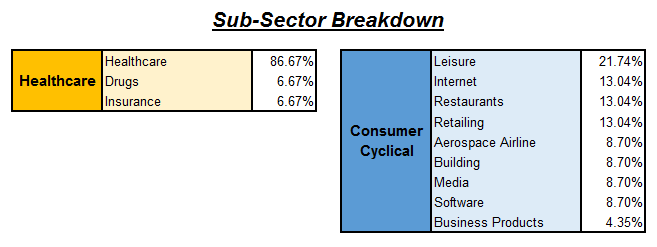
Although Consumer Cyclicals and Healthcare ranks outside of the top half of DALI, they have both shown improvement from a relative strength standpoint. In the DALI sector rankings, Consumer Cyclicals have gone from 8th at the beginning of the year, up to 6th. Healthcare has added 103 buy signals so far this year and climbed from 10th in DALI to 8th. Although Consumer Cyclicals has shown positive returns on a year to date basis – the DWA Consumer Cyclical Index DWAECCONCYC has gained 2.70%, which trails the S&P 500 SPX by 5.17%. Healthcare has been one of the top performers on the year (using the DWA Healthcare Index DWAECHEALTH as a proxy) having posted a gain of 14.64%, compared to the S&P 500 Index SPX, up 7.87% (thru 5/25). Within the sub-sector breakdowns, we discovered that most of the stocks making new all-time highs within Healthcare were simply just broad Healthcare stocks. Meanwhile, Leisure, Internet, Restaurants, and Retailing were the Consumer Cyclical sub-sectors with the largest concentration of new all-time highs. We have highlighted two stocks from the Healthcare and Leisure sub-sectors below.
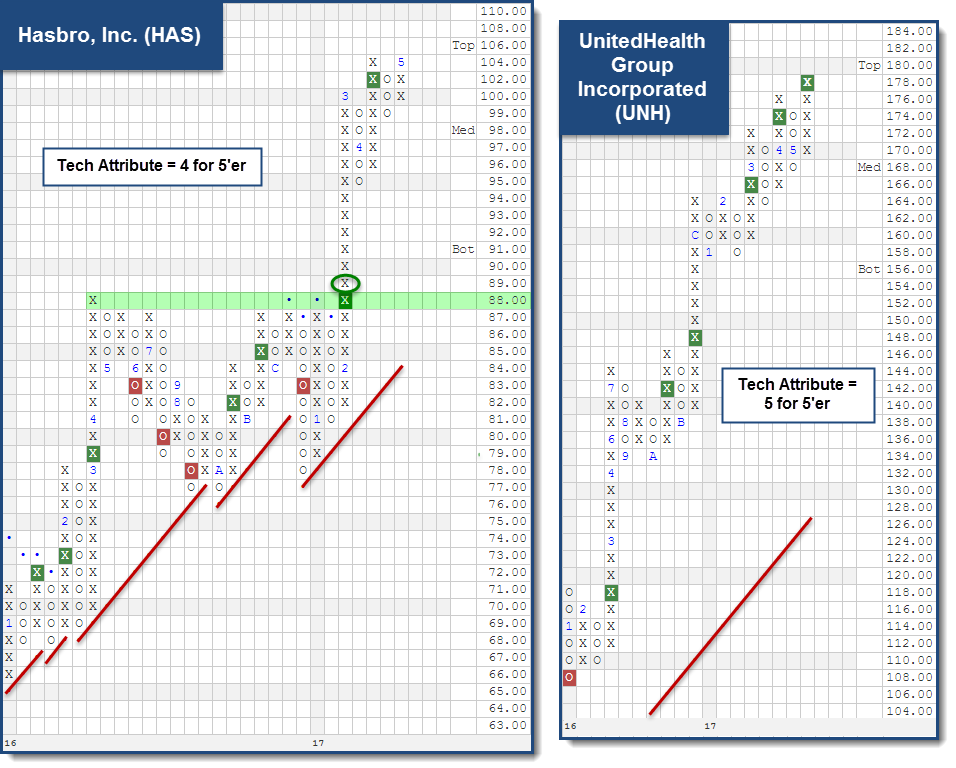
One stock that caught our eye from this list was Hasbro, Inc. HAS. It is a member of the broad Consumer Cyclical sector and the Leisure DWA group. Within the Leisure sector matrix, HAS ranks within the top half out of 53 stocks. In addition, it offers four positive technical attributes and also comes with a yield in excess of 2%. HAS also has a bullish price objective of $139, which suggests the potential for further price appreciation from current levels. Looking to its trend chart, we can see HAS was able to surpass resistance from April 2016 at $88 with the breakout in February. Since then, it has been able to better those highs and currently sits at $104 on its chart. Those interested in gaining exposure may could consider partial positions here, and look to add further exposure on a pullback to the $110 to $99 range. From here, support is at $99 and $95.
Another stock we wanted to highlight is UnitedHealth Group Incorporated UNH. Currently, UNH ranks in the top third of its sector rankings and boasts 5 for 5’er status. UNH also comes with an attractive reward to risk ratio in excess of 2-to-1, if using $162 as a stop. This stock is one that also benefited from the rally after the 2016 Presidential Election. Looking to its trend chart, it was able to make a higher bottom in November at $138 and continued to new highs through December. After developing support at $158, UNH was able to complete a bullish catapult at $174 and now trades at all-time highs in the upper $170’s (after it moved to new all-time highs on May 25, 2017). Those interested in gaining exposure to UNH may do so at current levels or on a pullback. Initial support is offered between $164 and $168 with longer term support coming at $158.