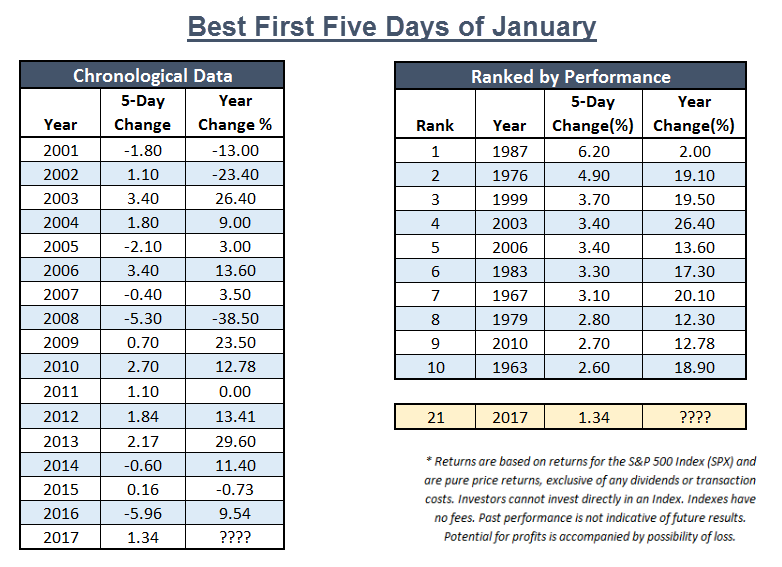
We have all heard the old market adage, "As January Goes, So Goes the Year," but for those who haven't heard, there is another saying that goes something like, " As the First Five Days of January Goes, So Goes January, and So Goes the Year." Well, as of Monday's close, we finished the first five days of January 2017, so we thought we would take a look at how things fared in the equity market for these first five days, and how this barometer has worked historically. According to the Stock Trader's Almanac, the last 41 up "First Five Days" periods were followed by full-year gains 35 times, for an 85.40% accuracy ratio and a 14.00% average gain in all 41 years. In 2016, the market as defined by the S&P 500 Index SPX, was down -5.96% after the first five days, making it the worst first five trading days of any year in history (for data going back to 1950). However, when all was said and done, the SPX finished up for the year with a gain of 9.54%. With the close on Monday, January 9th, 2017, the first week of the year proved to be a positive one as the SPX gained 1.34%, making it the 21st best year going back to 1950 when ranked by first 5 day performance. Ultimately, only time will tell what the markets have in store for the remaining 51 weeks of 2017. As always, we will continue to monitor our indicators and key charts to keep you abreast of any material developments from here.

- Amplify ETFs has filed for a fund that will provide MLP exposure. The fund, the Amplify YieldShares Oil Hedged MLP Fund, takes long positions in MLPs while shorting oil futures contracts. The fund will be actively managed and will seek to outperform the Oil Hedged MLP Index provided by ETP Ventures. Neither a ticker nor an expense ratio was provided however the fund will list on the Bats exchange.
- Elkhorn has filed for two Low Vol/High Beta ETFs. The Elkhorn Lunt SmallCap Low Vol/High Beta ETF and the Elkhorn Lunt MidCap Low Vol/High Beta ETF both join the Elkhorn Lunt Low Vol/High Beta ETF LVHB and will target the Small and Mid Cap spaces, respectively. The funds will track indexes provided by Lunt. LVHB targets the Large Cap space and launched in October. The filing did not include expense ratios or tickers but did indicate that the funds would list on the Bats exchange.
- Today the ALPS/Dorsey Wright Sector Momentum ETF (SWIN) launched on the Nasdaq exchange. On a quarterly basis, the Fund’s underlying index first ranks 10 sectors based on relative strength and then ranks individual stocks from each of the top seven ranked sectors from the Nasdaq Index. Components are equally weighted within the index and the index will generally have about 50 stocks. SWIN comes with an expense ratio of 0.40%.
This week we review the recent updates to the suite of Dorsey Wright Technical Leaders index series, which are employed exclusively within PowerShares DWA Momentum ETFs. While the suite of PowerShares DWA Momentum ETFs participated enough to produce positive absolute performance in 2016, and generally during the fourth quarter, the year of 2016 was nonetheless forgettable for the momentum return factor overall. The top performing ETF within this suite was the PowerShares DWA SmallCap Momentum Portfolio DWAS, which gained 4.94% for the final quarter of the year and posted a gain of 7.45% for the entire year. While constructive in absolute terms, the relative returns were still beneath its benchmarks on both accounts, reflecting the difficult environment that 2016 presented for momentum overall. The other two broad market US ETFs in the suite, the PowerShares DWA Momentum Portfolio PDP and the PowerShares DWA NASDAQ Momentum Portfolio DWAQ gained 1.52% and 5.01% for the year; respectively, and both lagged their benchmarks in the process. PDP lost a bit of ground during the fourth quarter, falling nearly 1%, while DWAQ gained 2.49% and outperformed its benchmark by more than 1%. As we move into the new year we have seen the suite of PowerShares ETFs adapt to numerous market driven changes taking shape during the last quarter of 2016. While this rotation doesn't help the recent past performance, its does allow the portfolios to enter the New Year much better aligned with the new leadership trends that are now in place within the market. We will take a closer look at the recent adaptations within this suite of ETFs and potential individual equity ideas that can be taken from them as well.

One of the best ways to screen for stock ideas is to sift through the underlying holdings of ETFs that track strategies designed to target market leadership or themes. With that in mind and considering the recent quarterly reconstitution across all of the PowerShares DWA Momentum ETFs, we thought we would put a few of these products under the microscope to accomplish two tasks. First, we want to see which holdings have been removed as a result of the recent changes. These are the stocks that have deteriorated sufficiently enough in terms of relative strength that they no longer rank high enough to hold. On the other side of the coin, we want to examine which stocks have been able to move into the indexes, as these are the emerging leaders and thus provide a logical starting place for new actionable ideas and also insight to broader themes taking shape. The three ETFs we will focus on today include the PowerShares DWA Momentum Portfolio PDP, the PowerShares DWA Small Cap Momentum Portfolio DWAS, and the PowerShares DWA NASDAQ Momentum Portfolio DWAQ.
PowerShares DWA Momentum Portfolio PDP:
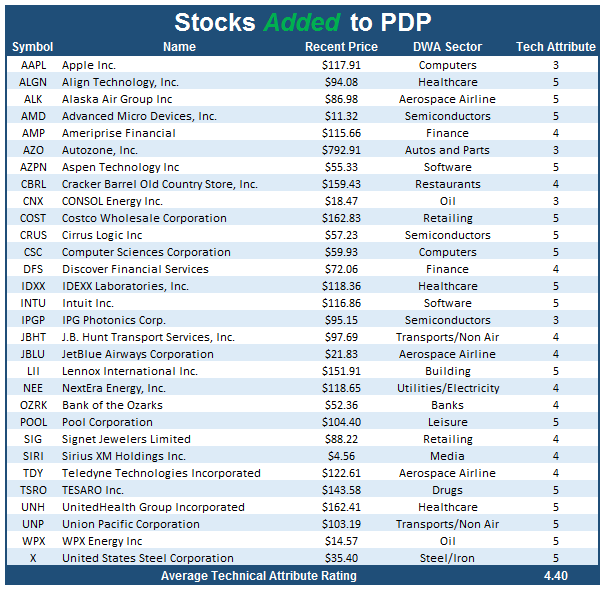
The process behind the PowerShares DWA Momentum Portfolio PDP is quite simple. We analyze approximately 1,000 large and mid cap US stocks relative to one another, and then target the strongest 100 names on a quarterly basis. The main goal of the quarterly reconstitution process is to allow the Index to weed out those stocks that are not performing well and replace them with stocks that are exhibiting superior relative strength characteristics. During the reconstitution at the end of the fourth quarter for 2016, 30 stocks were removed from the PowerShares DWA Momentum Portfolio and 30 new stocks were added. With 30% of the PDP holdings having turned over from quarter-to-quarter, 70% of the stocks still met the criteria to remain in the portfolio based upon their relative strength characteristics. A change to 30 holdings in one quarter is a fairly high number and symptomatic of the rather dynamic shift in leadership over the past many months. In the tables below, we have compiled the stocks that were either removed or added. One of the more interesting observations is the "Average Technical Attribute Reading" for the two lists. All 30 of the stocks that were added to PDP at the end of the quarter have a technical attribute reading of 3 or higher (with 25 of the 30 scoring a 4 or 5) while the average technical attribute reading of the added group is 4.40. By contrast, the stocks that were removed from the PDP this quarter have an average attribute rating of 2.33. All told, the average technical attribute reading across the names that constitute PDP is a 4.30 reading (out of 5). For a full list of the Q1 2017 PDP holdings, click here.

*Data as of 1/9/2017
One of the more notable themes that developed during the fourth quarter of 2016 is the improvement within the Financials sector, and specifically the "non-REIT" elements of that group. Within this particular suite of ETFs, Financials was the sector with the most additions in each fund. For PDP, not only did the Fund increase its exposure to Financials, it did so while rotating out of Real Estate, which many firms still consider to be a sub-sector of that broader Financial group. This contributed to a significant shift in the overall allocation for the ETF. Below we see the trend charts of Realty Income Corporation O and Bank of the Ozarks OZRK as they provide excellent evidence of why this shift is occurring. Within PDP this quarter Real Estate accounts for 20% of the stocks removed, and Real Estate was previously the lion's share of Financial exposure in the fund. That has changed with this last rebalance, as REITs have largely been purged from the portfolio, and replaced with other areas of the Financial sector. On Realty Income's O trend chart, we can see that during the last quarter the stock gave a sell signal at $63 and fell down to violate its trend line at $58 on its way down to a low of $53 by November. Meanwhile, many Bank stocks such as Bank of the Ozarks OZRK maintained positive trends or began new ones late in 2016. This shift in PDP is a classic example of relative strength causing adaptation, and in some cases that change is quite stark as we have seen most recently.

PowerShares DWA Small Cap Momentum Portfolio DWAS:
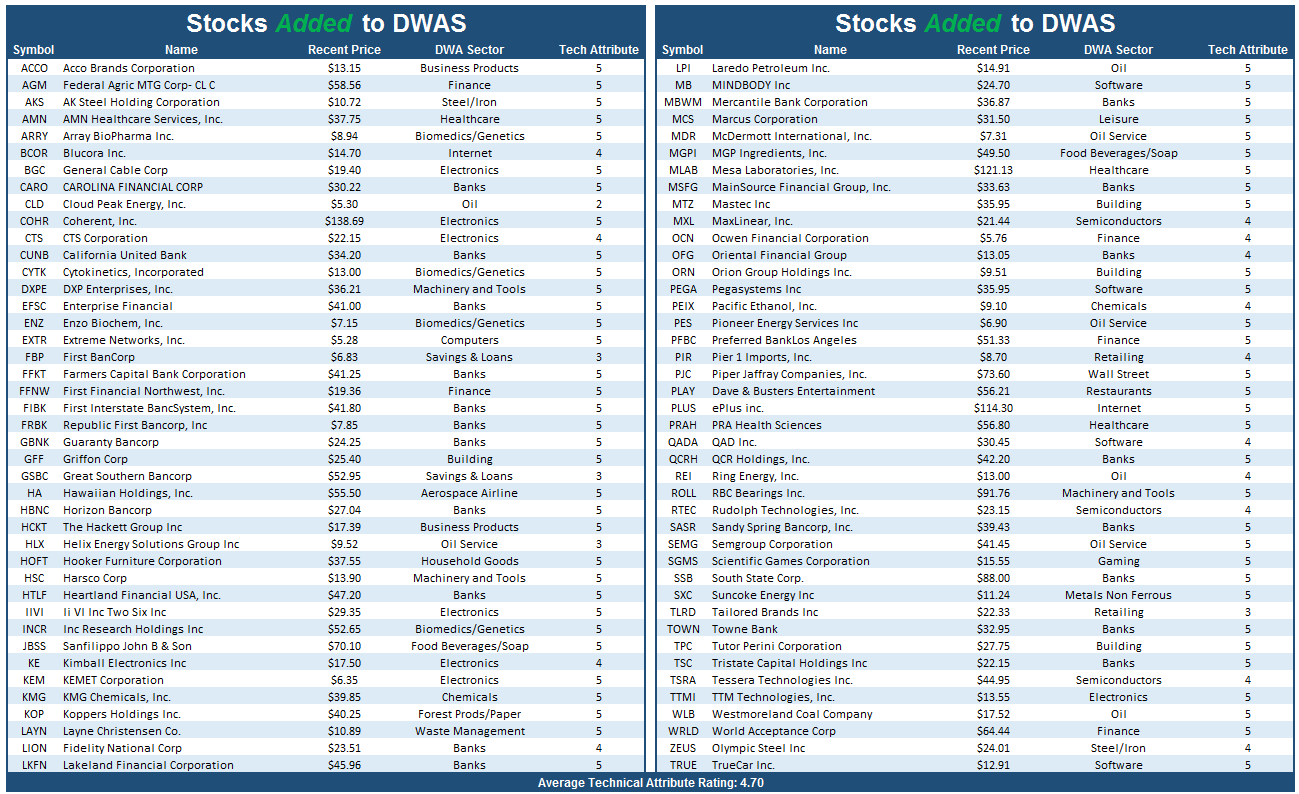
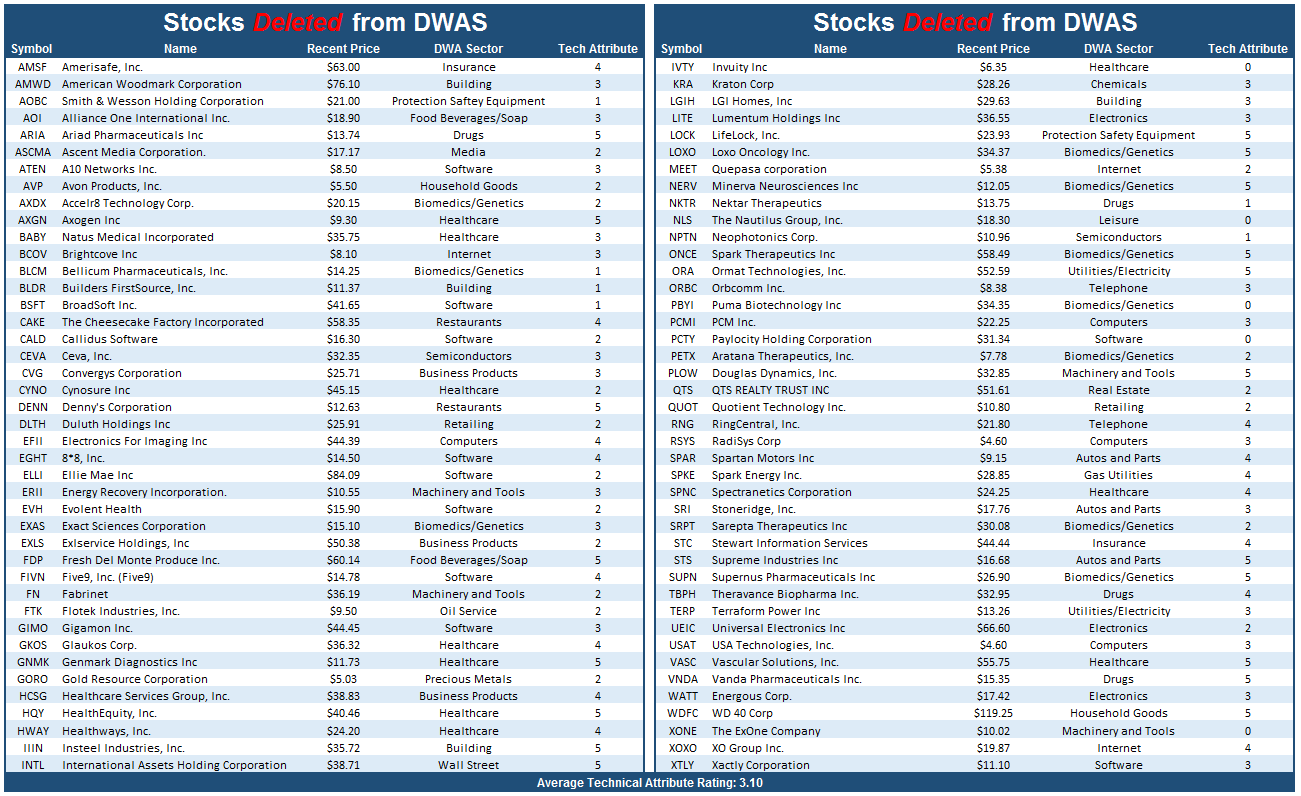
DWAS is designed to target approximately 200 stocks demonstrating powerful relative strength characteristics from a small-cap universe of approximately 2,000 US-listed companies. During the most recent quarterly update, 84 stocks were removed from DWAS, and 84 stocks were added. That means nearly 42% of the holdings turned over from quarter-to-quarter, which is near the average of the past couple of quarters, but certainly high by longer-term standards. In the tables below, we have compiled the list of additions and deletions to the Small Cap Portfolio. Like what we saw with PDP, there was a notable difference in the technical attributes for the additions relative to the deletions. Specifically, the average attribute rating for the deletions was slightly better than PDP’s deletions at about 3.10, while the average attribute rating for the additions is a strong 4.70. With these changes, the average attribute rating for the current holdings of DWAS is 4.71. For a full list of the Q1 2017 DWAS holdings, click here.
*Data as of 1/9/2017
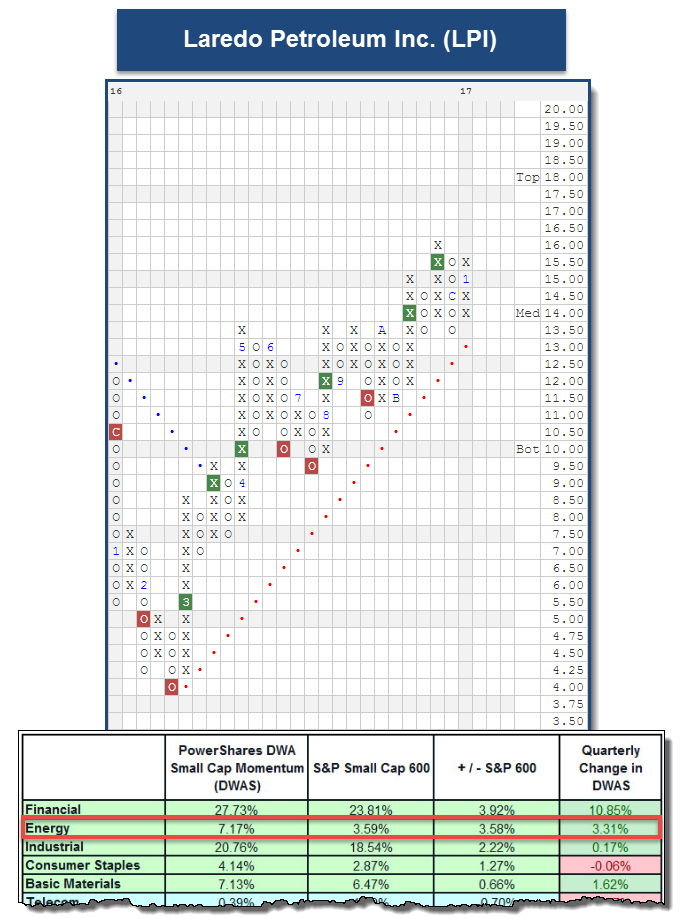
Like the other ETFs we’re featuring, DWAS added significant exposure to Financials. Because of that, DWAS has roughly 3.9% more Financials exposure than its benchmark, the S&P 600 Small Cap Index SML. Another leading sector in which DWAS now has a higher weight than its benchmark is Energy. In fact, DWAS has almost double the exposure that SML possesses. At this time, Energy sits in the top spot of DALI and continued leadership from this sector would be extremely beneficial for DWAS early in 2017.. One of the additions to DWAS this quarter and among the most actionable for single stock purchases is Laredo Petroleum Inc. LPI. Currently, LPI is a 5 for 5’er that maintains a positive trend and is trading one box below its November 2016 high at $16. Those seeking Energy exposure could consider LPI here with a potential stop loss point if a triple bottom break and violation of the bullish support line occurs at $13.
PowerShares DWA NASDAQ Momentum Portfolio DWAQ:
DWAQ is designed to target the 100 strongest RS stocks out of a universe of approximately 1,000 of the largest stocks trading on the Nasdaq. Just like PDP and DWAS, it is reconstituted and rebalanced on a quarterly basis, and with the most recent update, DWAQ saw 32 deletions and 32 subsequent additions to the portfolio. That is to say that roughly 68% of the holdings from Q4 have maintained sufficient RS to keep their spot in the underlying index. In the tables below, we have compiled the list of additions and deletions, and yet again, we see a difference in the average attribute reading between the two lists. The average attribute rating for the deletions was about 2.91, while the average attribute rating for the additions is a strong 4.66. These changes have allowed the average attribute rating for the current holdings of DWAQ to a reading of 4.63. For a full list of the Q1 2017 DWAQ holdings, click here.

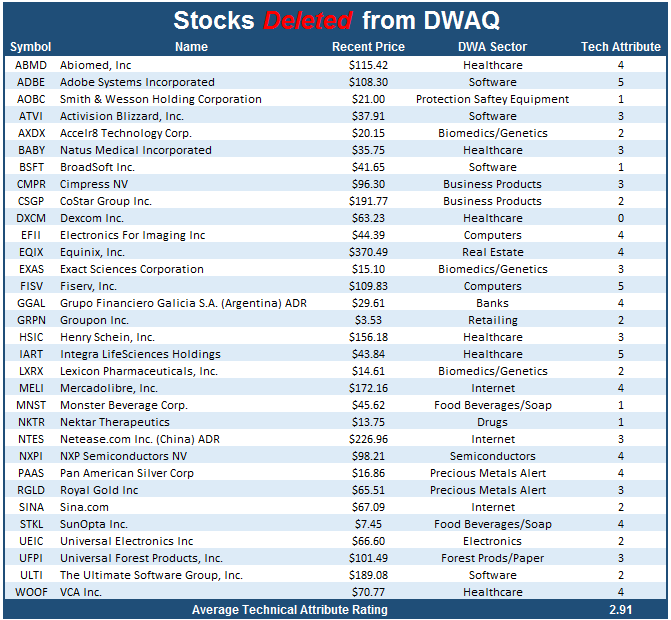
*Data as of 1/9/2017
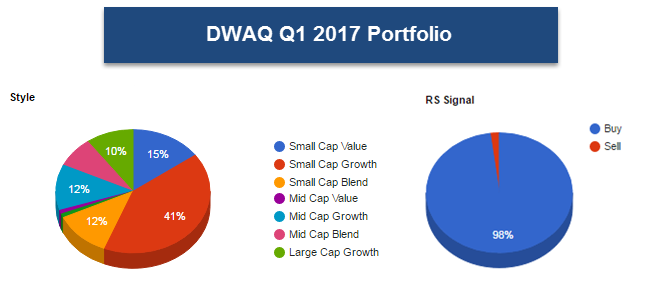
Although DWAQ is technically not a Small Cap portfolio this recent quarterly rebalance has caused a significant overweight into Small Caps. In fact, out of the 32 additions to DWAQ this quarter, almost 70% of them are members of the Small Cap space. As a result, the portfolio now has roughly 68% Small Cap exposure in total. Additionally, we also see that 98% of the stocks in the portfolio maintain a market relative strength buy signal at this time. With the emergence of Small Caps this quarter, one could look to the underlying holdings of DWAQ for idea generation. In fact, the average attribute rating for all the Small Cap stocks in DWAQ is 4.66 and over 73% of the stocks possess a technical attribute rating of 5.

Every week, the analysts here at DWA organize and write approximately 11 feature stories focusing within the inventories of multiple ETF providers. These articles can be found within the weekly ETF reports we conduct for those ETF families with which we provide guided model-based solutions. The weekly reports can be accessed from the Research Menu, but as of this week we will also compile a handful of those stories, which we feel are particularly relevant. We hope that this will serve as an "in case you missed it..." sort of section, where you can quickly access timely ETF features in a comprehensive fashion each week. We will include a link to the report along with a brief abstract summarizing our discussion within the respective features. This week's compilation is below.

First Trust Performance Review:
A look back on historical performance of the First Trust guided ETF model strategies. Click here to view the full report.
iShares Alternative Models Performance Review:
A look back on historical performance of the iShares Alternative guided ETF model strategies. Click here to view the full report.
iShares Equity Models Performance Review:
A look back on historical performance of the iShares Equity guided ETF model strategies. Click here to view the full report.
State Street Performance Review:
A look back on historical performance of the State Street guided ETF model strategies. Click here to view the full report.
The Distribution Report below places Major Market ETFs and Indices into a bell curve style table based upon their current location on their 10-week trading band. The middle of the bell curve represents areas of the market that are "normally" distributed, with the far right being 100% overbought on a weekly distribution and the far left being 100% oversold on a weekly distribution. The weekly distribution ranges are calculated at the end of each week, while the placement within that range will fluctuate during the week. In addition to information regarding the statistical distribution of these market indexes, a symbol that is in UPPER CASE indicates that the RS chart is on a Buy Signal. If the symbol is dark Green then the stock is on a Point & Figure buy signal, and if the symbol is bright Red then it is on a Point & Figure sell signal.
The average Bullish Percent reading this week is 60.37% up -0% from the previous week
| <--100 | -100--80 | -80--60 | -60--40 | -40--20 | -20-0 | 0-20 | 20-40 | 40-60 | 60-80 | 80-100 | 100-> | |||
 |
||||||||||||||
Legend:
| Symbol | Name | Symbol | Name |
| AGG | iShares Barclays Aggregate Bond Fund | NASD | Nasdaq Composite |
| CL/ | Crude Oil Continuous | NDX | NASDAQ Non Financial Index |
| DJIA | Dow Jones Industrial Average | RSP | Guggenheim S&P 500 Equal Weight ETF |
| DVY | iShares Dow Jones Select Dividend Index | RUT | Russell 2000 Index |
| DX/Y | NYCE U.S.Dollar Index Spot | SHY | iShares Barclays 1-3 Year Tres. Bond Fund |
| EFA | iSharesMSCI EAFE Index Fund | SML | S&P 600 Small Cap Index |
| FXE | CurrencyShares Euro Trust | SPX | S & P 500 Index |
| GC/ | Gold Continuous | TLT | iShares Barclays 20+ Year Treasury Bond Fund |
| GSG | iShares S&P GSCI Commodity-Indexed Trust | UV/Y | Continuous Commodity Index |
| HYG | iShares High Yield Corporate Bond Fund | VOOG | Vanguard S&P 500 Growth ETF |
| ICF | iShares Cohen & Steers Realty Index | VOOV | Vanguard S&P 500 Value ETF |
| IEF | iShares Lehman 7-10 Yr. Tres. Bond Fund | VWO | Vanguard MSCI Emerging Markets ETF |
| LQD | iShares iBoxx $ Investment Grade Corp. | XLG | Guggenheim Russell Top 50 ETF |
| MID | S&P 400 MidCap Index |

Long Ideas
| Stock | Symbol | Sector | Current Price | Action Price | Target | Stop | Notes |
|---|---|---|---|---|---|---|---|
| Laredo Petroleum Inc. | LPI | Oil | $14.39 | 14-16 | 22.50 | 13.0 | 5/5'er, New RS buy signal, Top 10 rank in Oil matrix, PB to support. |
| The Scotts Company | SMG | Chemicals | $94.70 | mid 90's | 118 | 89/83 | 4 for 5'er, leader in favored Chemicals sector, general positive diverger, good R-R, yield >2%, Earn. 1/31. |
| Power Integrations Inc | POWI | Semiconductors | $67.40 | 64-68 | 83.50 | 60/54 | 3/5'er, Big Base Breakout on 1/2 pt chart, High rank in SEMI matrix, Strong sub-sector (SEMI), Earn. 2/2. |
| Chubb Ltd | CB | Insurance | $130.51 | 128-135 | 163 | 120 | 4 for 5'er, leader in Favored Insurance sector, recent new high, R-R > 2, yield > 2%, Earn. 1/31. |
| Johnson Controls International PLC | JCI | Protection Safety Equipment | $42.60 | 39-44 | 66 | 38 | 4 for 5'er, in Favored PROT Sector, positive trend, on a pullback, Earn. 2/1. |
| KLA-Tencor Corporation | KLAC | Semiconductors | $79.59 | 78-83 | 116 | 74 | Favored Sector, 3 for 5'er, Bullish Triangle, Good R-R, yield > 2%, Earn. 1/26 |
| Microsoft Corporation | MSFT | Software | $62.64 | 61-64 | 86 | 57 | 5 for 5'er, top quartile of Favored SOFT sector matrix, pulled back from new highs, R-R > 4, yield > 2.5%, Earn. 1/26 |
| Devon Energy Corporation | DVN | Oil | $46.58 | hi-40s | 62 | 45/39 | 4/5'er, Bullish Catapult formation, High ranking in Oil matrix. |
| Copart Incorporated | CPRT | Autos and Parts | $56.53 | mid 50's | 68 | 49 | 4 for 5'er, Favored AUTO sector, pos wkly mom change, long term positive trend good R-R |
| Cintas Corporation | CTAS | Textiles/Apparel | $115.48 | 112-116 | 102 | 161 | 5 for 5'er, leader in TEXT sector, recent pullback from new highs, consistent bullish pattern. |
Short Ideas
| Stock | Symbol | Sector | Current Price | Action Price | Target | Stop | Notes |
|---|---|---|---|---|---|---|---|
| Universal Health Services, Inc. | UHS | Healthcare | $111.54 | (104-112) | 82 | 118/124 | 0 for 5'er, laggard in Healthcare sector, negative diverger, bounced off of new 52-week low |
| Lennar Corporation | LEN | Building | $43.55 | (42-45) | 30 | 50 | 1/5'er, laggard in Building group, ranked near the bottom of its group RS Matrix, negative weekly & monthly momentum |
| Mattel, Inc. | MAT | Leisure | $30.52 | (low-30s) | 19.50 | 35 | 2/5'er, Low ranking in LEIS matrix, "Sell on Rally" candidate, Earn. 1/30. |
Removed Ideas
| Stock | Symbol | Sector | Current Price | Action Price | Target | Stop | Notes |
|---|---|---|---|---|---|---|---|
| Raytheon Company | RTN | Aerospace Airline | $148.19 | 140s | 190 | 132 | Still actionable in the 140's, with a stop afforded at $132. |
Follow-Up Comments
| Comment | |||||||
|---|---|---|---|---|---|---|---|
|
|
|||||||
DWA Spotlight Stock
CTAS Cintas Corporation R ($114.90) - Textiles/Apparel - Although a member of the unfavored Textiles/Apparel sector, CTAS offers a positive technical picture and a viable entry point for new positions. It is a 5 for 5'er, speaking to its positive trend and relative strength characteristics, and also ranks 3rd out of 23 stocks in its sector Matrix. It has maintained a consistent pattern of higher tops and higher bottoms since February of last year, and recently hit a new high at $122. Shares of CTAS are currently changing hands around $114, putting it in the middle of its 10-week trading band. New positions are welcomed between $112 and $116, with a stop afforded at $102.
| 12 | 13 | 14 | 15 | 16 | |||||||||||||||||||||||||||||||||||||||||||||||||
| 122.00 | X | 122.00 | |||||||||||||||||||||||||||||||||||||||||||||||||||
| 120.00 | X | O | 120.00 | ||||||||||||||||||||||||||||||||||||||||||||||||||
| 118.00 | 9 | C | O | 118.00 | |||||||||||||||||||||||||||||||||||||||||||||||||
| 116.00 | X | O | X | O | 116.00 | ||||||||||||||||||||||||||||||||||||||||||||||||
| 114.00 | X | O | X | O | Med | 114.00 | |||||||||||||||||||||||||||||||||||||||||||||||
| 112.00 | X | O | X | 112.00 | |||||||||||||||||||||||||||||||||||||||||||||||||
| 110.00 | 8 | A | X | 110.00 | |||||||||||||||||||||||||||||||||||||||||||||||||
| 108.00 | X | O | X | 108.00 | |||||||||||||||||||||||||||||||||||||||||||||||||
| 106.00 | X | O | X | 106.00 | |||||||||||||||||||||||||||||||||||||||||||||||||
| 104.00 | X | B | 104.00 | ||||||||||||||||||||||||||||||||||||||||||||||||||
| 102.00 | X | Bot | 102.00 | ||||||||||||||||||||||||||||||||||||||||||||||||||
| 100.00 | X | 100.00 | |||||||||||||||||||||||||||||||||||||||||||||||||||
| 99.00 | 7 | 99.00 | |||||||||||||||||||||||||||||||||||||||||||||||||||
| 98.00 | X | 98.00 | |||||||||||||||||||||||||||||||||||||||||||||||||||
| 97.00 | X | 97.00 | |||||||||||||||||||||||||||||||||||||||||||||||||||
| 96.00 | X | 96.00 | |||||||||||||||||||||||||||||||||||||||||||||||||||
| 95.00 | X | X | 95.00 | ||||||||||||||||||||||||||||||||||||||||||||||||||
| 94.00 | X | X | O | X | 94.00 | ||||||||||||||||||||||||||||||||||||||||||||||||
| 93.00 | X | O | C | X | X | O | X | 93.00 | |||||||||||||||||||||||||||||||||||||||||||||
| 92.00 | X | O | X | O | X | O | 5 | 6 | 92.00 | ||||||||||||||||||||||||||||||||||||||||||||
| 91.00 | X | B | X | O | X | O | X | 4 | 91.00 | ||||||||||||||||||||||||||||||||||||||||||||
| 90.00 | X | O | X | O | X | 1 | X | O | X | 90.00 | |||||||||||||||||||||||||||||||||||||||||||
| 89.00 | X | X | X | O | O | O | X | O | X | 89.00 | |||||||||||||||||||||||||||||||||||||||||||
| 88.00 | X | X | O | X | O | X | O | X | O | X | 88.00 | ||||||||||||||||||||||||||||||||||||||||||
| 87.00 | X | O | 6 | X | 8 | O | X | O | X | O | X | X | O | X | 87.00 | ||||||||||||||||||||||||||||||||||||||
| 86.00 | X | O | X | O | X | O | X | O | 9 | O | X | O | 2 | O | 3 | O | 86.00 | ||||||||||||||||||||||||||||||||||||
| 85.00 | 3 | O | X | O | X | O | X | O | X | O | X | O | X | O | X | 85.00 | |||||||||||||||||||||||||||||||||||||
| 84.00 | X | O | X | 7 | O | O | X | A | O | X | O | X | X | 84.00 | |||||||||||||||||||||||||||||||||||||||
| 83.00 | X | O | 5 | O | X | O | X | O | X | O | X | 83.00 | |||||||||||||||||||||||||||||||||||||||||
| 82.00 | X | O | X | O | X | O | X | O | X | O | X | 82.00 | |||||||||||||||||||||||||||||||||||||||||
| 81.00 | 2 | O | X | O | X | O | X | O | O | 81.00 | |||||||||||||||||||||||||||||||||||||||||||
| 80.00 | X | X | 4 | O | X | O | 80.00 | ||||||||||||||||||||||||||||||||||||||||||||||
| 79.00 | X | O | X | O | X | 79.00 | |||||||||||||||||||||||||||||||||||||||||||||||
| 78.00 | X | O | X | O | 78.00 | ||||||||||||||||||||||||||||||||||||||||||||||||
| 77.00 | X | 1 | X | 77.00 | |||||||||||||||||||||||||||||||||||||||||||||||||
| 76.00 | X | O | 76.00 | ||||||||||||||||||||||||||||||||||||||||||||||||||
| 75.00 | X | 75.00 | |||||||||||||||||||||||||||||||||||||||||||||||||||
| 74.00 | C | • | 74.00 | ||||||||||||||||||||||||||||||||||||||||||||||||||
| 73.00 | X | X | • | 73.00 | |||||||||||||||||||||||||||||||||||||||||||||||||
| 72.00 | X | O | X | • | 72.00 | ||||||||||||||||||||||||||||||||||||||||||||||||
| 71.00 | X | X | X | O | X | • | 71.00 | ||||||||||||||||||||||||||||||||||||||||||||||
| 70.00 | X | O | X | O | X | B | • | 70.00 | |||||||||||||||||||||||||||||||||||||||||||||
| 69.00 | X | O | X | O | X | • | 69.00 | ||||||||||||||||||||||||||||||||||||||||||||||
| 68.00 | X | A | O | X | • | 68.00 | |||||||||||||||||||||||||||||||||||||||||||||||
| 67.00 | 9 | O | • | 67.00 | |||||||||||||||||||||||||||||||||||||||||||||||||
| 66.00 | X | • | 66.00 | ||||||||||||||||||||||||||||||||||||||||||||||||||
| 65.00 | 8 | • | 65.00 | ||||||||||||||||||||||||||||||||||||||||||||||||||
| 64.00 | X | • | 64.00 | ||||||||||||||||||||||||||||||||||||||||||||||||||
| 63.00 | X | 6 | • | 63.00 | |||||||||||||||||||||||||||||||||||||||||||||||||
| 62.00 | X | O | X | • | 62.00 | ||||||||||||||||||||||||||||||||||||||||||||||||
| 61.00 | X | O | X | • | 61.00 | ||||||||||||||||||||||||||||||||||||||||||||||||
| 60.00 | 1 | X | O | 5 | • | 60.00 | |||||||||||||||||||||||||||||||||||||||||||||||
| 59.00 | X | O | X | 3 | X | • | 59.00 | ||||||||||||||||||||||||||||||||||||||||||||||
| 58.00 | X | O | X | 4 | X | • | 58.00 | ||||||||||||||||||||||||||||||||||||||||||||||
| 57.00 | X | X | O | X | O | X | • | 57.00 | |||||||||||||||||||||||||||||||||||||||||||||
| 56.00 | X | O | X | 2 | O | • | 56.00 | ||||||||||||||||||||||||||||||||||||||||||||||
| 55.00 | B | O | X | • | 55.00 | ||||||||||||||||||||||||||||||||||||||||||||||||
| 54.00 | X | C | • | 54.00 | |||||||||||||||||||||||||||||||||||||||||||||||||
| 53.00 | A | • | 53.00 | ||||||||||||||||||||||||||||||||||||||||||||||||||
| 52.00 | X | • | 52.00 | ||||||||||||||||||||||||||||||||||||||||||||||||||
| 51.00 | X | • | 51.00 | ||||||||||||||||||||||||||||||||||||||||||||||||||
| 50.00 | 9 | • | 50.00 | ||||||||||||||||||||||||||||||||||||||||||||||||||
| 49.00 | 8 | • | 49.00 | ||||||||||||||||||||||||||||||||||||||||||||||||||
| 48.00 | X | • | 48.00 | ||||||||||||||||||||||||||||||||||||||||||||||||||
| 47.00 | 7 | • | 47.00 | ||||||||||||||||||||||||||||||||||||||||||||||||||
| 46.00 | 5 | • | 46.00 | ||||||||||||||||||||||||||||||||||||||||||||||||||
| 45.00 | X | X | • | 45.00 | |||||||||||||||||||||||||||||||||||||||||||||||||
| 44.00 | X | O | X | • | 44.00 | ||||||||||||||||||||||||||||||||||||||||||||||||
| 43.00 | B | O | 2 | • | 43.00 | ||||||||||||||||||||||||||||||||||||||||||||||||
| 42.00 | 9 | O | X | • | 42.00 | ||||||||||||||||||||||||||||||||||||||||||||||||
| 41.00 | X | O | X | • | 41.00 | ||||||||||||||||||||||||||||||||||||||||||||||||
| 40.00 | 3 | X | 8 | O | • | 40.00 | |||||||||||||||||||||||||||||||||||||||||||||||
| 39.00 | 2 | O | 7 | O | X | • | 39.00 | ||||||||||||||||||||||||||||||||||||||||||||||
| 38.00 | X | O | X | O | X | • | 38.00 | ||||||||||||||||||||||||||||||||||||||||||||||
| 37.00 | X | 5 | X | O | • | 37.00 | |||||||||||||||||||||||||||||||||||||||||||||||
| 36.00 | 1 | 6 | • | 36.00 | |||||||||||||||||||||||||||||||||||||||||||||||||
| 35.00 | X | • | 35.00 | ||||||||||||||||||||||||||||||||||||||||||||||||||
| 34.00 | X | • | 34.00 | ||||||||||||||||||||||||||||||||||||||||||||||||||
| 33.00 | O | X | • | 33.00 | |||||||||||||||||||||||||||||||||||||||||||||||||
| 32.00 | O | X | X | • | 32.00 | ||||||||||||||||||||||||||||||||||||||||||||||||
| 31.00 | 8 | X | O | C | • | 31.00 | |||||||||||||||||||||||||||||||||||||||||||||||
| 30.00 | O | X | O | X | • | 30.00 | |||||||||||||||||||||||||||||||||||||||||||||||
| 29.00 | O | X | 9 | X | • | 29.00 | |||||||||||||||||||||||||||||||||||||||||||||||
| 28.00 | O | X | A | X | • | 28.00 | |||||||||||||||||||||||||||||||||||||||||||||||
| 27.00 | O | • | O | • | 27.00 | ||||||||||||||||||||||||||||||||||||||||||||||||
| 12 | 13 | 14 | 15 | 16 |
| Comments |
|---|
| ACAT Arctic Cat, Inc. ($14.09) - Leisure - ACAT broke a triple bottom at $14.50 and continued lower to $14 on Tuesday. This move violated the bullish support line, therefore downticking this name to an unacceptable 0 for 5’er. Weekly momentum has been negative for three weeks, suggesting the potential for further downside from here. Additionally, this stock ranks 45th out of 53 names within the Leisure sector RS matrix, making it one of the weaker names within this space. Avoid as supply is in control and the weight of the evidence is negative. Note earnings are slated for 1/26/17. |
| ADSK Autodesk, Inc. ($79.78) - Software - ADSK has returned to a buy signal after breaking a double top at $80. The stock is a 5 for 5'er within the top 10 of the favored Software sector matrix, which consists of 94 stocks. The weight of technical evidence is positive allowing those looking to add new positions or add to current ones to initiate on this breakout. The first sign of trouble comes with a move to $73, a double bottom break. |
| ALK Alaska Air Group Inc ($91.78) - Aerospace Airline - As a follow up, ALK completed its shakeout formation today after breaking a triple top at $92. Those that were waiting for this potential break to occur may initiate positions here. Support is at $87 and earnings are expected on 1/19. |
| BDX Becton, Dickinson and Company ($171.98) - Healthcare - After developing support at the $162 level, BDX has returned to a buy signal after breaking a double top at $172. The stock is a 4 for 5'er whose weekly momentum recently flipped positive after spending 13 weeks in negative territory. New positions may be initiated upon this breakout. Initial support is at $162, while longer term support comes against the bullish support line at $152. Earnings are expected on 2/1. |
| EXEL Exelixis, Inc. ($18.62) - Biomedics/Genetics - After finding support at $14.50, shares of EXEL rallied, breaking a double top buy signal at $18.50, a new 52 week high. This stock is a perfect 5 for 5’er as it is trading in a positive trend and is showing significant strength relative to both the market and its peers. The weight of the evidence remains positive and demand is in control. Okay to buy or hold here. The first sign of trouble comes with a move to $14, a double bottom sell signal. |
| GNMK Genmark Diagnostics Inc ($12.89) - Healthcare - GNMK completed a bullish triangle pattern after breaking a double top at $13. The stock possesses all five positive technical attributes and has just flipped to positive weekly momentum. New entries are welcomed on this breakout. The first sign of trouble comes with a move to $10.50, a double bottom break. |
| HIIQ Health Insurance Innovations Inc. ($19.14) - Insurance - HIIQ broke a double top at $19, which completes a bullish triangle pattern. This marks the third consecutive double top in a strong uptrend. The stock is a 5 for 5'er with a bullish price objective of $23.5, which indicates the potential for further upside potential from here. Those interested in new positions may do so here and average down on a pullback. Initial support is in the $16's, while longer term support is available at $13. |
| KOF Coca Cola Femsa, Sa (Mexico) ADR ($60.18) - Food Beverages/Soap - KOF broke a double bottom at $60, completing a bearish catapult pattern. This stock is an unacceptable 0 for 5’er as it is trading in a negative trend and is showing weakness relative to both the market and its peers. There is no remaining support on the chart. Avoid. Resistance is at $64. |
| LEA Lear Corporation ($143.09) - Autos and Parts - LEA broke a double top at $140 and continued higher to $142 on Tuesday. This is a new all-time high on the chart as well as the fifth consecutive buy signal on the chart since July 2016. LEA is within the favored Autos and Parts sector and is a perfect 5 for 5’er as all of the trending and relative strength characteristics are positive here. Okay to hold here or buy on a pullback as the stock is nearing the top of the 10 week trading band. Support is at $132, the December low, and $118, the bullish support line. Note earnings are slated for 1/26/17. |
| SHAK Shake Shack Inc ($34.91) - Restaurants - After meeting resistance at the bearish resistance line, shares of SHAK slid, breaking double bottom at $35. SHAK has been trading below the bearish resistance line since August 2016 and has been showing long term weakness relative to both the market and its peers since October 2015. Additionally, this stock ranks within the bottom quartile of the Restaurants sector RS matrix, making it one of the weaker names. Weekly momentum has been negative for four weeks, suggesting the potential for further downside. Avoid. The next level of support is at $31 while resistance is at $38. |
Daily Option Ideas for January 10, 2017
New Recommendations
| Name | Option Symbol | Action | Stop Loss |
|---|---|---|---|
| Noble Energy Inc. - $37.04 | O:NBL 17H35.00D18 | Buy the August 35.00 calls at 5.30 | 32.00 |
Follow Ups
| Name | Option | Action |
|---|---|---|
| Waste Management, Inc. ( WM) | Apr. 60.00 Calls | Stopped at 9.40 (CP: 9.40) |
| Incyte Genomics, Inc. ( INCY) | Mar. 100.00 Calls | Raise the option stop loss to 15.00 (CP: 21.40) |
New Recommendations
| Name | Option Symbol | Action | Stop Loss |
|---|---|---|---|
| Molina Healthcare Inc. - $58.01 | O:MOH 17R60.00D16 | Buy the June 60.00 puts at 8.40 | 61.00 |
Follow Up
| Name | Option | Action |
|---|---|---|
| FirstEnergy Corp. (FE) | Jan. 35.00 Puts | Initiate an option stop loss of 3.50 (CP: 4.00) |
New Recommendations
| Name | Option Sym. | Call to Sell | Call Price | Investment for 500 Shares | Annual Called Rtn. | Annual Static Rtn. | Downside Protection |
|---|---|---|---|---|---|---|---|
| Take-Two Interactive Software, Inc. $50.46 | O:TTWO 17F55.00D16 | Jun. 55.00 | 2.70 | $24,347.00 | 27.70% | 10.30% | 4.20% |
Still Recommended
| Name | Action |
|---|---|
| United Rentals, Inc. (URI) - 106.16 | Sell the March 110.00 Calls. |
| Zillow Group Inc. Class C (Z) - 36.95 | Sell the May 40.00 Calls. |
| Petroleo Brasileiro S.A. (Brazil) ADR (PBR) - 10.83 | Sell the April 11.00 Calls. |
| Swift Transportation Company (SWFT) - 23.72 | Sell the May 26.00 Calls. |
| Integrated Device Technology, Inc. (IDTI) - 24.80 | Sell the May 26.00 Calls. |
| Western Digital Corporation (WDC) - 71.86 | Sell the April 72.50 Calls. |
| Murphy Oil Corp (MUR) - 30.56 | Sell the April 32.50 Calls. |
| Hess Corporation (HES) - 60.61 | Sell the May 65.00 Calls. |
| Marathon Oil Corporation (MRO) - 17.40 | Sell the April 19.00 Calls. |
| Carmax Group (KMX) - 65.19 | Sell the April 67.50 Calls. |
| QEP Resources Inc. (QEP) - 18.02 | Sell the June 20.00 Calls. |
The Following Covered Write are no longer recommended
| Name | Covered Write |
|---|---|
|
|
|

