There are no changes in any of this models this week. We offer complete performance review for each of the iShares equity models both for Q4 and 2016 as a whole.
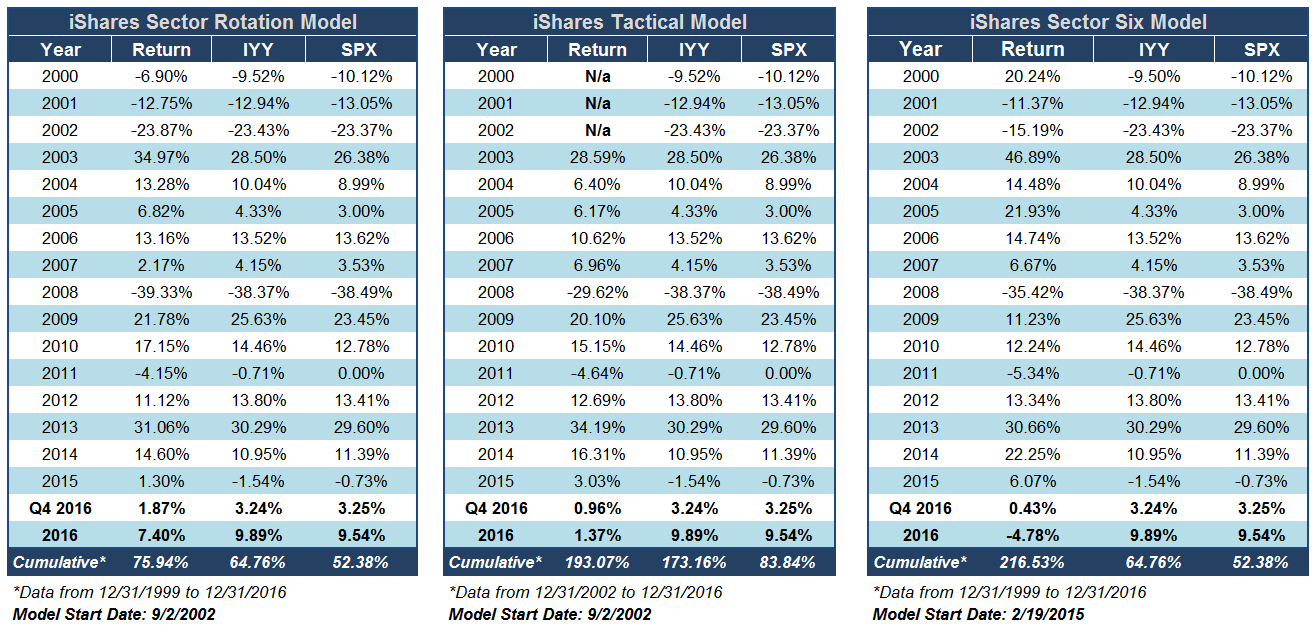
The last quarter of 2016 helped to pull the US equity benchmarks further into the green, being carried by Energy, Financials and Industrials in a strong post-election rally. However, these gains did not translate over to the iShares sector rotation models, as we continued to see Q4 plagued with similar turnover as the rest of the year, causing a lag in the portfolios. As a whole, the calendar year of 2016 will likely not be remembered fondly by most who weathered the markets of 2014 and 2015 with any success. US Equities, which had rewarded investors in the past few years, turned volatile early 2016 and recorded one of its worst January's in history. While US Equities recovered to post respectable gains for the year, it did so with style and sector leadership that was quite different than that of 2014 and 2015. The Healthcare (specifically Biotech) trends that previously benefited investors, gave way to emerging leadership from outcast investment sectors and styles like Energy and US Small Cap.
All in all, the investments that performed the best in 2016 were largely things that hadn't been too useful in the two years prior. Conversely, the worst returns of 2016 came from some of the strongest investments in years prior. As relative strength driven strategies adapted to this changing leadership (and continue to do so), we witnessed a considerable drag on performance caused by heightened turnover. The tables below offer a performance summary for the iShares sector rotation models for Q4 and the year as whole. We have also provided a breakdown of trades that occurred within the last 3 months.
iShares Sector Rotation Model ISHRSECT Q4 Changes:
iShares Tactical Model ISHRTACTICAL Q4 Changes:
iShares Sector Six Model ISHRSECT6 Q4 Changes:
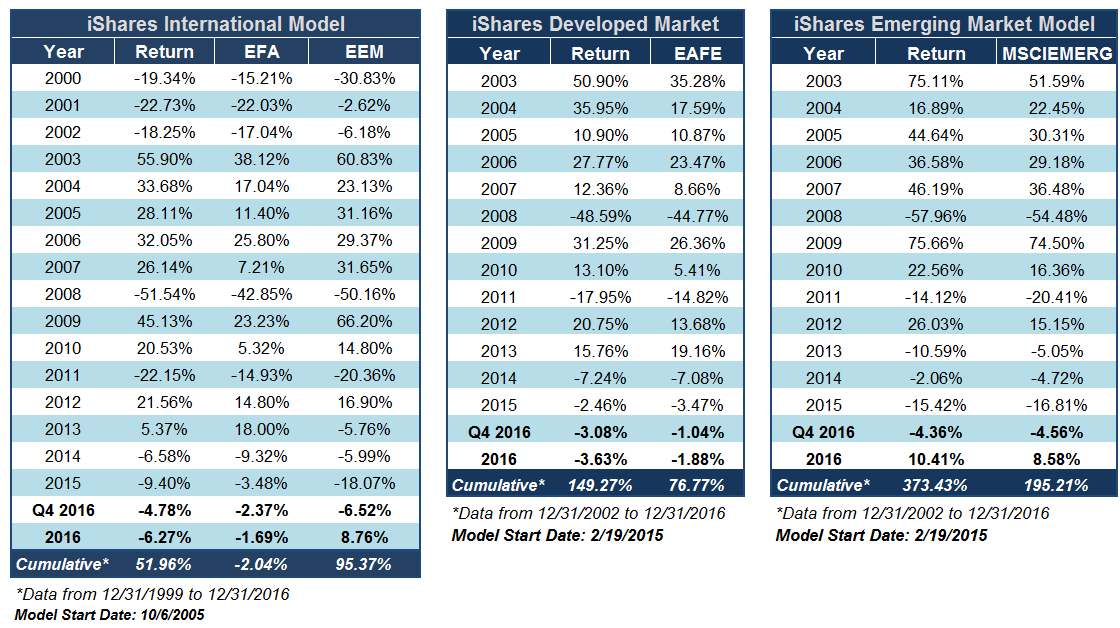
With respect to the International Equity asset class, Q4 was negative for both the emerging market and developed market segments. While this caused the developed market benchmark EFA to fall into the red for the year, the emerging market benchmark, EEM, was able to maintain attractive gains for the year in excess of 8%. This was in large part thanks for fairly sustainable leadership from the Emerging Latin America group, a theme that the iShares Emerging Market Model was able to participate in, as it was up more than 10% for the year, making it the single best performing iShares model in 2016. Below is a complete performance review for each of the iShares international equity models.
iShares International Model ISHRINTL Q4 Changes:
- No Changes
iShares Developed Market Model ISHRDEV Q4 Changes:
- No Changes
iShares Emerging Market Model ISHREMERG Q4 Changes:
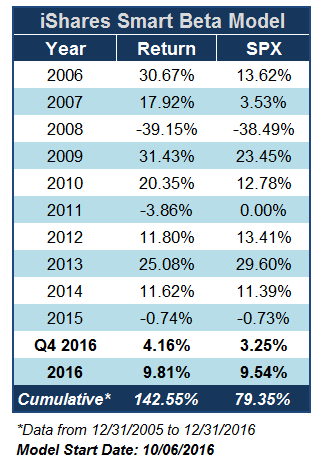
Early in Q4, we launched a new iShares models, the iShares Smart Beta Model ISHRSMART. Below is a complete performance table for the model, including the model backtest (prior to 10/6/2016). While live, the model managed to outpace the S&P 500 Index SPX, rallying 4.56% from 10/6 - 12/30. There were no changes to this model during Q4.