This week we review the recent updates to the suite of PowerShares DWA Momentum ETFs.
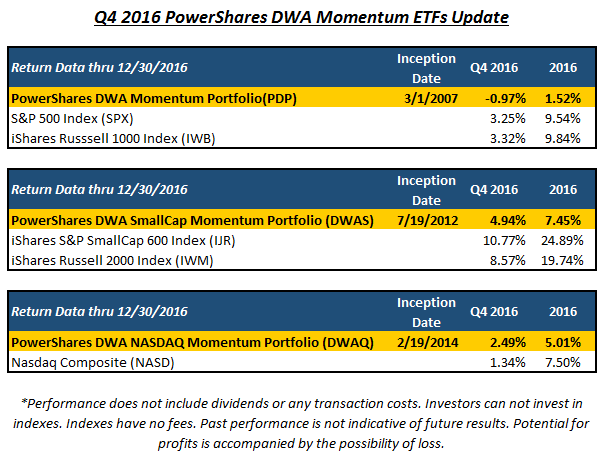
This week we review the recent updates to the suite of Dorsey Wright Technical Leaders index series, which are employed exclusively within PowerShares DWA Momentum ETFs. While the suite of PowerShares DWA Momentum ETFs participated enough to produce positive absolute performance in 2016, and generally during the fourth quarter, the year of 2016 was nonetheless forgettable for the momentum return factor overall. The top performing ETF within this suite was the PowerShares DWA SmallCap Momentum Portfolio DWAS, which gained 4.94% for the final quarter of the year and posted a gain of 7.45% for the entire year. While constructive in absolute terms, the relative returns were still beneath its benchmarks on both accounts, reflecting the difficult environment that 2016 presented for momentum overall. The other two broad market US ETFs in the suite, the PowerShares DWA Momentum Portfolio PDP and the PowerShares DWA NASDAQ Momentum Portfolio DWAQ gained 1.52% and 5.01% for the year; respectively, and both lagged their benchmarks in the process. PDP lost a bit of ground during the fourth quarter, falling nearly 1%, while DWAQ gained 2.49% and outperformed its benchmark by more than 1%. As we move into the new year we have seen the suite of PowerShares ETFs adapt to numerous market driven changes taking shape during the last quarter of 2016. While this rotation doesn't help the recent past performance, its does allow the portfolios to enter the New Year much better aligned with the new leadership trends that are now in place within the market. We will take a closer look at the recent adaptations within this suite of ETFs and potential individual equity ideas that can be taken from them as well.
One of the best ways to screen for stock ideas is to sift through the underlying holdings of ETFs that track strategies designed to target market leadership or themes. With that in mind and considering the recent quarterly reconstitution across all of the PowerShares DWA Momentum ETFs, we thought we would put a few of these products under the microscope to accomplish two tasks. First, we want to see which holdings have been removed as a result of the recent changes. These are the stocks that have deteriorated sufficiently enough in terms of relative strength that they no longer rank high enough to hold. On the other side of the coin, we want to examine which stocks have been able to move into the indexes, as these are the emerging leaders and thus provide a logical starting place for new actionable ideas and also insight to broader themes taking shape. The three ETFs we will focus on today include the PowerShares DWA Momentum Portfolio PDP, the PowerShares DWA Small Cap Momentum Portfolio DWAS, and the PowerShares DWA NASDAQ Momentum Portfolio DWAQ.
PowerShares DWA Momentum Portfolio PDP:
The process behind the PowerShares DWA Momentum Portfolio PDP is quite simple. We analyze approximately 1,000 large and mid cap US stocks relative to one another, and then target the strongest 100 names on a quarterly basis. The main goal of the quarterly reconstitution process is to allow the Index to weed out those stocks that are not performing well and replace them with stocks that are exhibiting superior relative strength characteristics. During the reconstitution at the end of the fourth quarter for 2016, 30 stocks were removed from the PowerShares DWA Momentum Portfolio and 30 new stocks were added. With 30% of the PDP holdings having turned over from quarter-to-quarter, 70% of the stocks still met the criteria to remain in the portfolio based upon their relative strength characteristics. A change to 30 holdings in one quarter is a fairly high number and symptomatic of the rather dynamic shift in leadership over the past many months. In the tables below, we have compiled the stocks that were either removed or added. One of the more interesting observations is the "Average Technical Attribute Reading" for the two lists. All 30 of the stocks that were added to PDP at the end of the quarter have a technical attribute reading of 3 or higher (with 25 of the 30 scoring a 4 or 5) while the average technical attribute reading of the added group is 4.40. By contrast, the stocks that were removed from the PDP this quarter have an average attribute rating of 2.33. All told, the average technical attribute reading across the names that constitute PDP is a 4.30 reading (out of 5). For a full list of the Q1 2017 PDP holdings, click here.
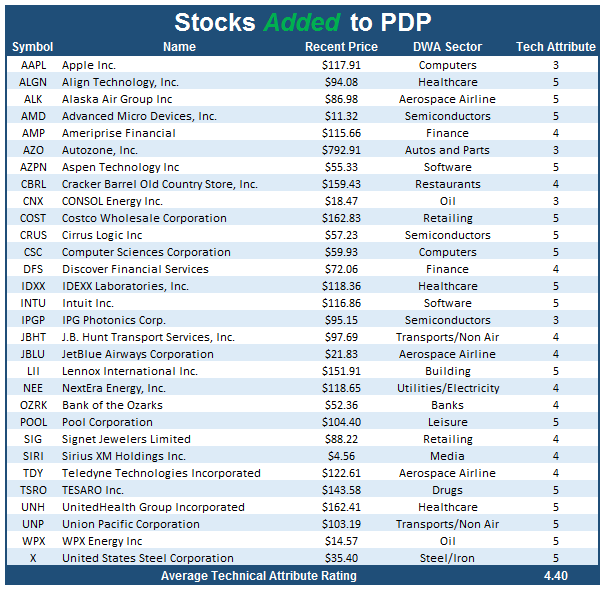

*Data as of 1/9/2017
One of the more notable themes that developed during the fourth quarter of 2016 is the improvement within the Financials sector, and specifically the "non-REIT" elements of that group. Within this particular suite of ETFs, Financials was the sector with the most additions in each fund. For PDP, not only did the Fund increase its exposure to Financials, it did so while rotating out of Real Estate, which many firms still consider to be a sub-sector of that broader Financial group. This contributed to a significant shift in the overall allocation for the ETF. Below we see the trend charts of Realty Income Corporation O and Bank of the Ozarks OZRK as they provide excellent evidence of why this shift is occurring. Within PDP this quarter Real Estate accounts for 20% of the stocks removed, and Real Estate was previously the lion's share of Financial exposure in the fund. That has changed with this last rebalance, as REITs have largely been purged from the portfolio, and replaced with other areas of the Financial sector. On Realty Income's O trend chart, we can see that during the last quarter the stock gave a sell signal at $63 and fell down to violate its trend line at $58 on its way down to a low of $53 by November. Meanwhile, many Bank stocks such as Bank of the Ozarks OZRK maintained positive trends or began new ones late in 2016. This shift in PDP is a classic example of relative strength causing adaptation, and in some cases that change is quite stark as we have seen most recently.

PowerShares DWA Small Cap Momentum Portfolio DWAS:
DWAS is designed to target approximately 200 stocks demonstrating powerful relative strength characteristics from a small-cap universe of approximately 2,000 US-listed companies. During the most recent quarterly update, 84 stocks were removed from DWAS, and 84 stocks were added. That means nearly 42% of the holdings turned over from quarter-to-quarter, which is near the average of the past couple of quarters, but certainly high by longer-term standards. In the tables below, we have compiled the list of additions and deletions to the Small Cap Portfolio. Like what we saw with PDP, there was a notable difference in the technical attributes for the additions relative to the deletions. Specifically, the average attribute rating for the deletions was slightly better than PDP’s deletions at about 3.10, while the average attribute rating for the additions is a strong 4.70. With these changes, the average attribute rating for the current holdings of DWAS is 4.71. For a full list of the Q1 2017 DWAS holdings, click here.
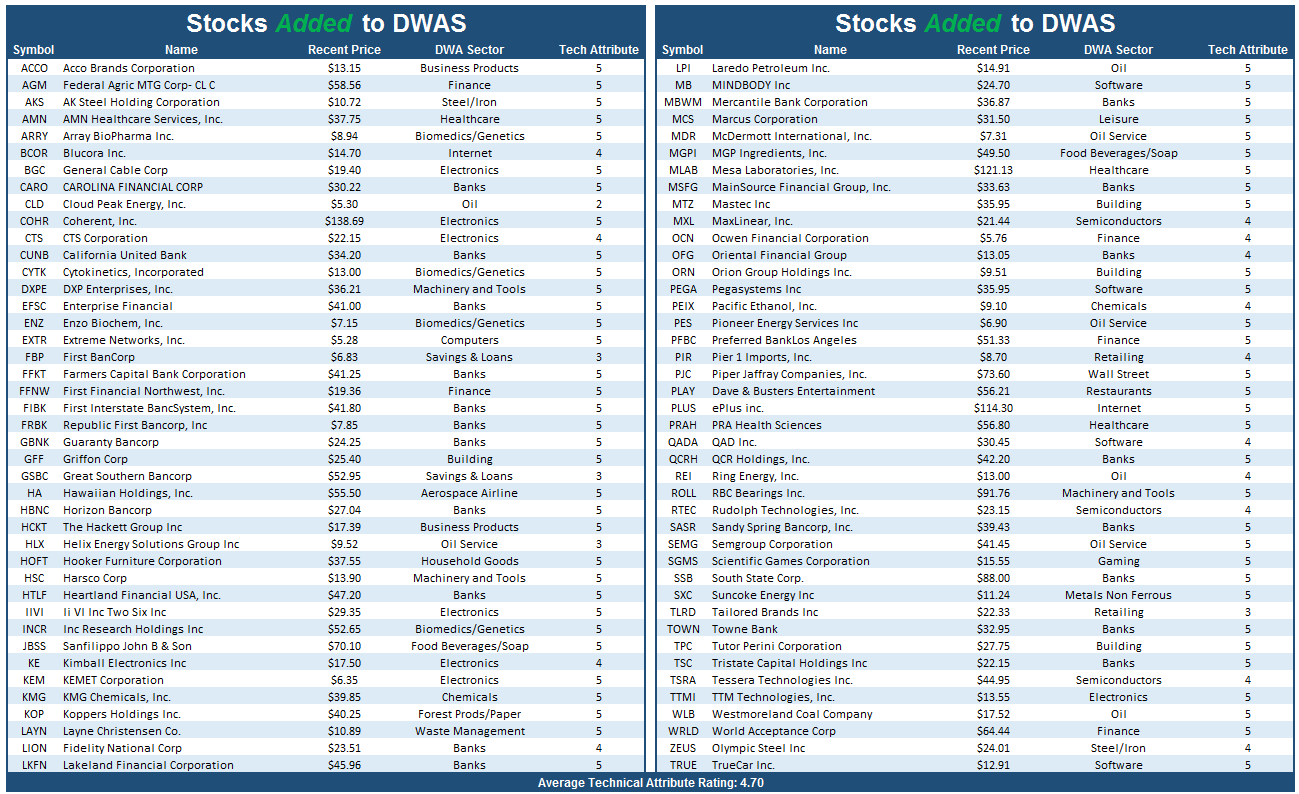
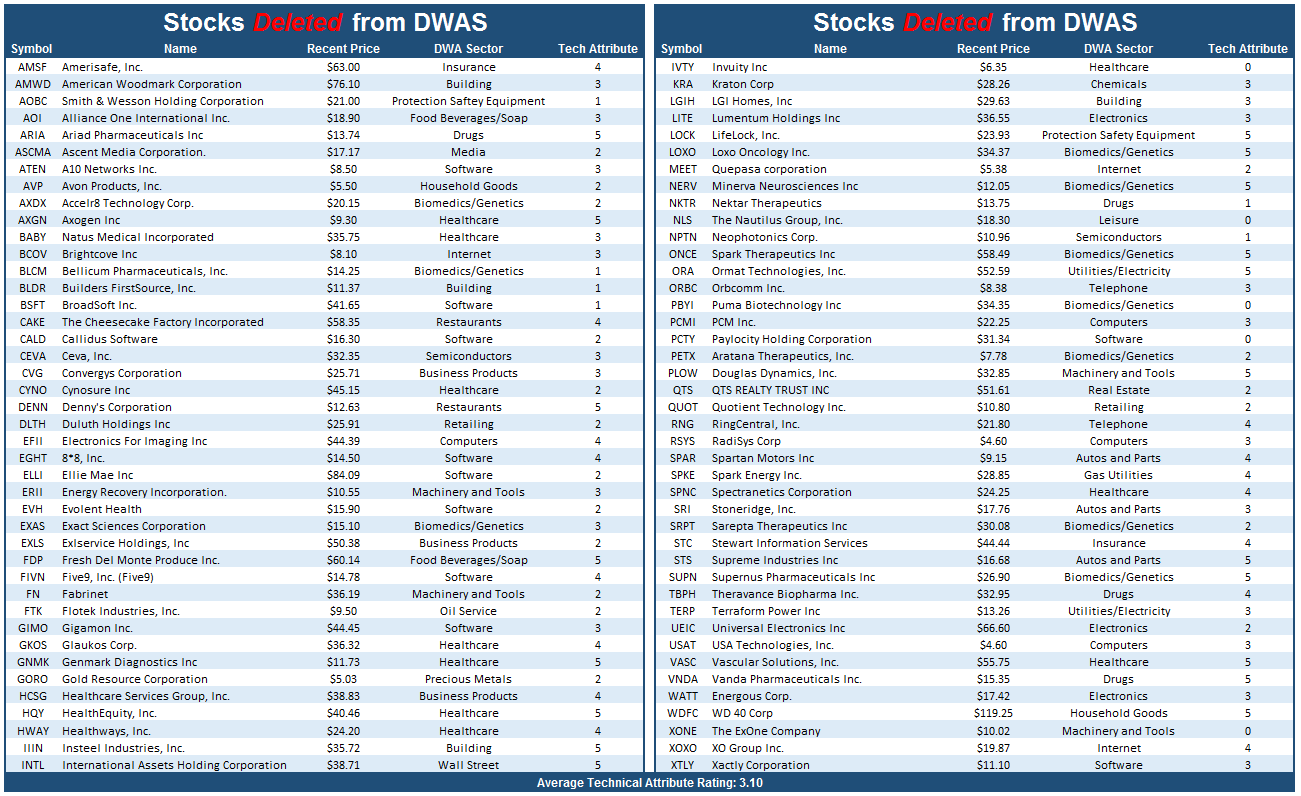
*Data as of 1/9/2017
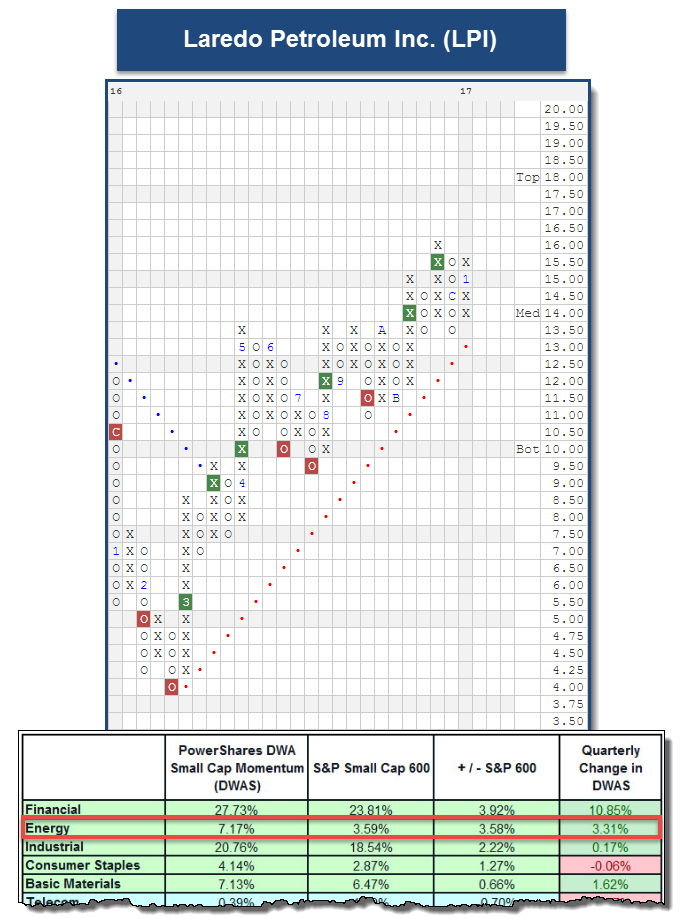
Like the other ETFs we’re featuring, DWAS added significant exposure to Financials. Because of that, DWAS has roughly 3.9% more Financials exposure than its benchmark, the S&P 600 Small Cap Index SML. Another leading sector in which DWAS now has a higher weight than its benchmark is Energy. In fact, DWAS has almost double the exposure that SML possesses. At this time, Energy sits in the top spot of DALI and continued leadership from this sector would be extremely beneficial for DWAS early in 2017.. One of the additions to DWAS this quarter and among the most actionable for single stock purchases is Laredo Petroleum Inc. LPI. Currently, LPI is a 5 for 5’er that maintains a positive trend and is trading one box below its November 2016 high at $16. Those seeking Energy exposure could consider LPI here with a potential stop loss point if a triple bottom break and violation of the bullish support line occurs at $13.
PowerShares DWA NASDAQ Momentum Portfolio DWAQ:
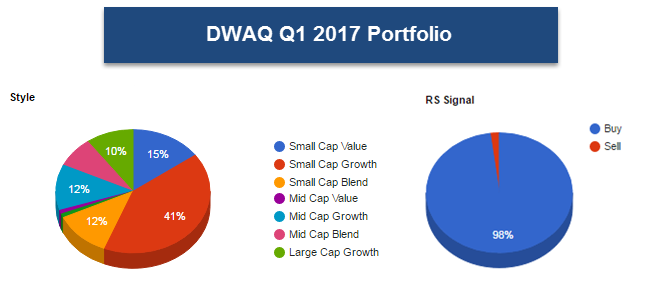
DWAQ is designed to target the 100 strongest RS stocks out of a universe of approximately 1,000 of the largest stocks trading on the Nasdaq. Just like PDP and DWAS, it is reconstituted and rebalanced on a quarterly basis, and with the most recent update, DWAQ saw 32 deletions and 32 subsequent additions to the portfolio. That is to say that roughly 68% of the holdings from Q4 have maintained sufficient RS to keep their spot in the underlying index. In the tables below, we have compiled the list of additions and deletions, and yet again, we see a difference in the average attribute reading between the two lists. The average attribute rating for the deletions was about 2.91, while the average attribute rating for the additions is a strong 4.66. These changes have allowed the average attribute rating for the current holdings of DWAQ to a reading of 4.63. For a full list of the Q1 2017 DWAQ holdings, click here.

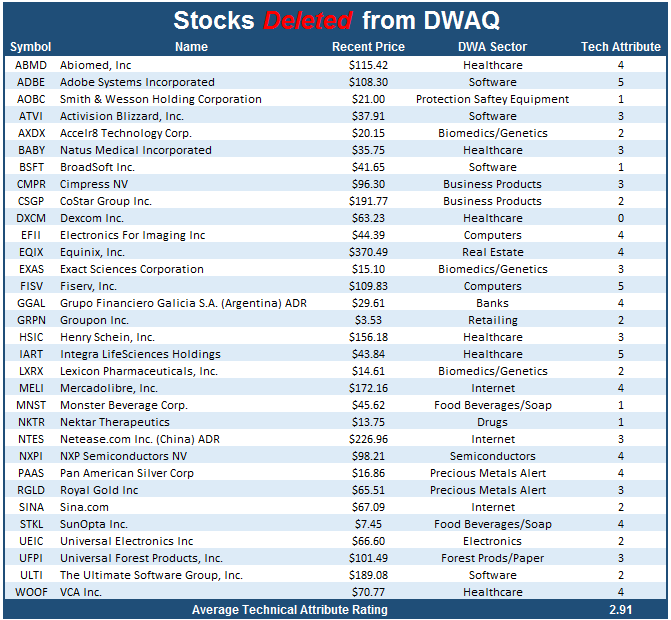
*Data as of 1/9/2017
Although DWAQ is technically not a Small Cap portfolio this recent quarterly rebalance has caused a significant overweight into Small Caps. In fact, out of the 32 additions to DWAQ this quarter, almost 70% of them are members of the Small Cap space. As a result, the portfolio now has roughly 68% Small Cap exposure in total. Additionally, we also see that 98% of the stocks in the portfolio maintain a market relative strength buy signal at this time. With the emergence of Small Caps this quarter, one could look to the underlying holdings of DWAQ for idea generation. In fact, the average attribute rating for all the Small Cap stocks in DWAQ is 4.66 and over 73% of the stocks possess a technical attribute rating of 5.