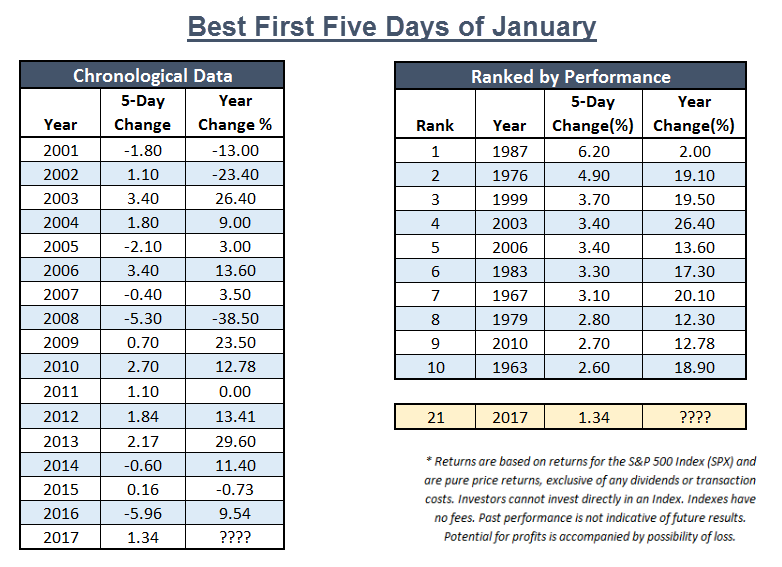
With the close on Monday, January 9th, the S&P 500 finished the first five days of January 2017 with a gain of 1.34%, making it the 21st best first five days since 1950.
We have all heard the old market adage, "As January Goes, So Goes the Year," but for those who haven't heard, there is another saying that goes something like, " As the First Five Days of January Goes, So Goes January, and So Goes the Year." Well, as of Monday's close, we finished the first five days of January 2017, so we thought we would take a look at how things fared in the equity market for these first five days, and how this barometer has worked historically. According to the Stock Trader's Almanac, the last 41 up "First Five Days" periods were followed by full-year gains 35 times, for an 85.40% accuracy ratio and a 14.00% average gain in all 41 years. In 2016, the market as defined by the S&P 500 Index SPX, was down -5.96% after the first five days, making it the worst first five trading days of any year in history (for data going back to 1950). However, when all was said and done, the SPX finished up for the year with a gain of 9.54%. With the close on Monday, January 9th, 2017, the first week of the year proved to be a positive one as the SPX gained 1.34%, making it the 21st best year going back to 1950 when ranked by first 5 day performance. Ultimately, only time will tell what the markets have in store for the remaining 51 weeks of 2017. As always, we will continue to monitor our indicators and key charts to keep you abreast of any material developments from here.