Most Requested Symbols


Today we have a change in the SSTREETGLOSECT Model: Sell XME, Buy KBE. We also have a change in the SSTREET Model: Sell XME.
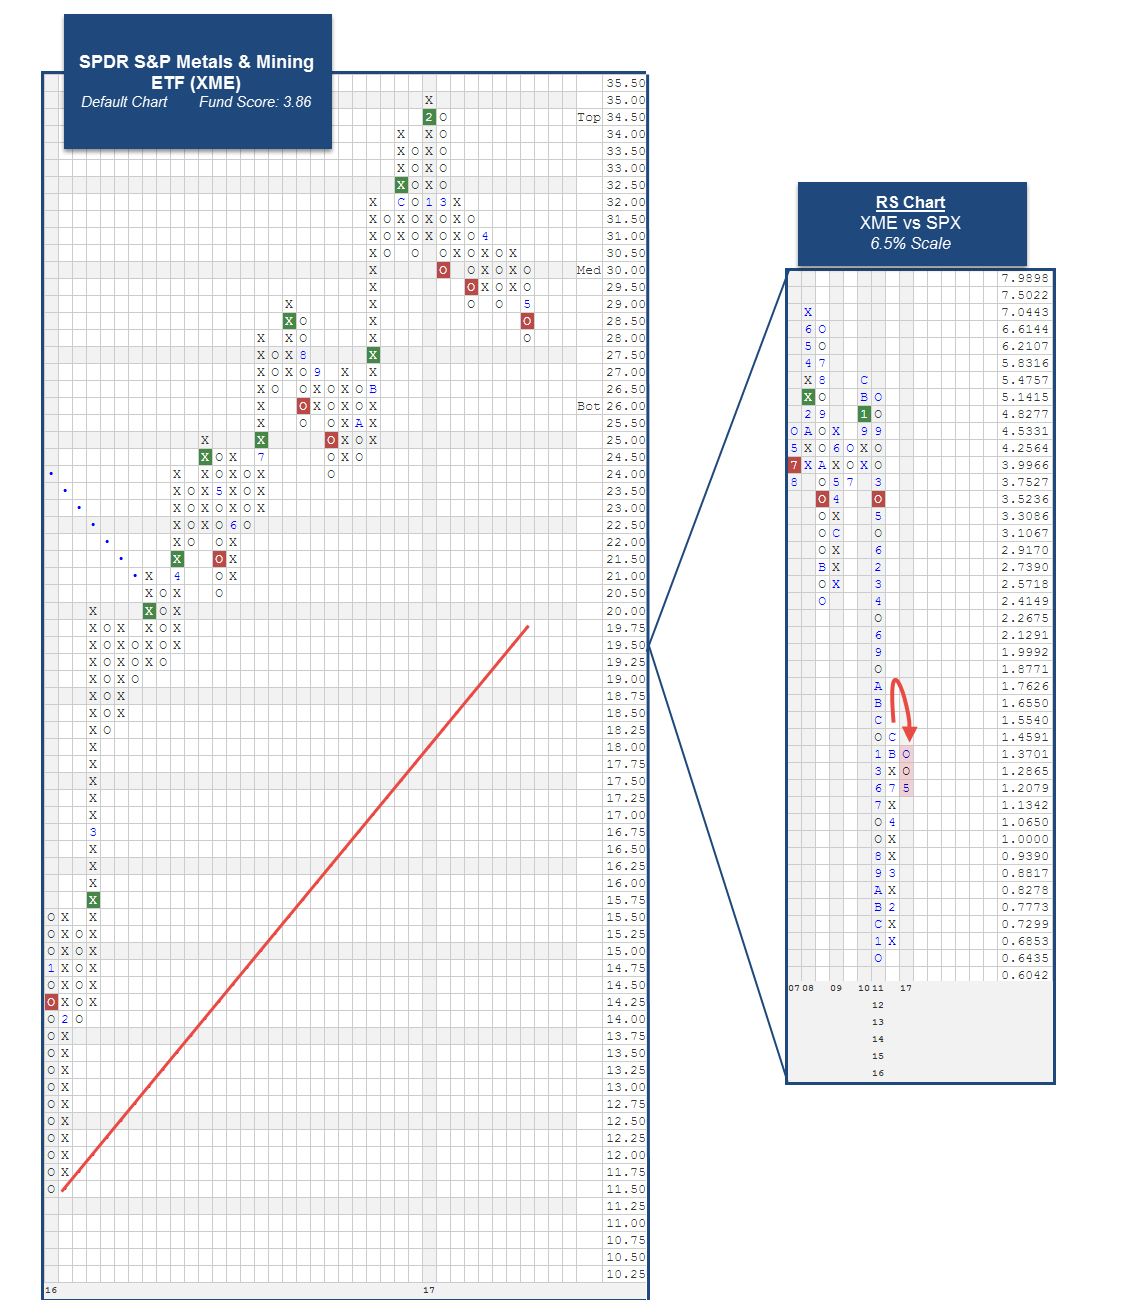
The first change this week comes from the State Street Sector Model SSTREET. The SPDR S&P Metals and Mining ETF XME has been removed from the Model after reversing down into O's versus the SPX on its RS chart.. This Model is designed to target exposure to the State Street sector ETFs that are demonstrating positive Relative Strength versus the S&P 500 Index SPX. Each week we monitor 31 Relative Strength charts for each ETF in the Model's universe versus the SPX. XME had been a holding in the SSTREET Model since 2/9/2016. Since being added, XME posted an impressive gain of 99.23% while the SPX was up 29.41% (through 5/9/2017). The SSTREET Model was up 32.62% over the same time frame. Looking at the trend chart of XME below, we find that after hitting a new 52 week high in February at $35, the chart pulled back significantly and gave three consecutive sell signals, with the most recent being a triple bottom break at $28.50. Additionally, it has seen considerable deterioration in its fund score which is now 3.86, with a score direction of -2.12. As a result of this change, the SSTREET Model has 17 holdings equally weighted at 5.88% each.
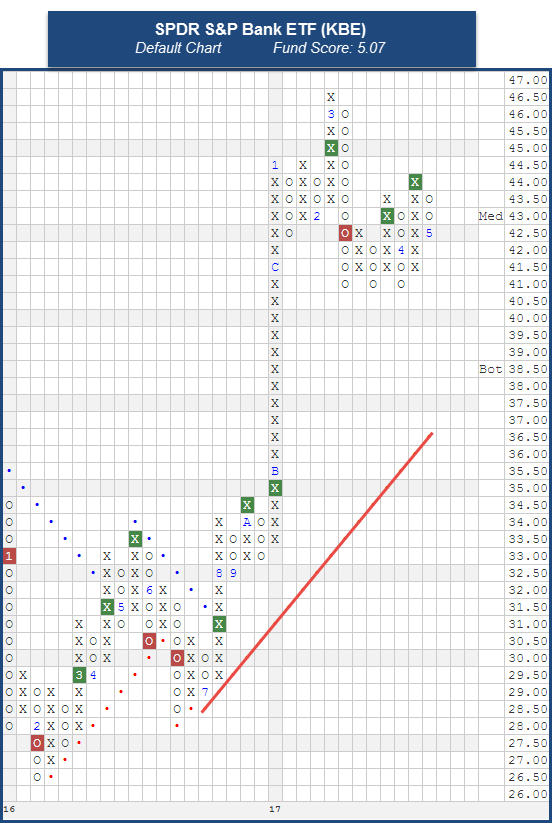
The second change this week comes from the State Street Global Sector Rotation Model SSTREETGLOSECT. As a refresher, the SSTREETGLOSECT Model is made up of five holdings, each of which is selected from a universe of both domestic and international sector funds. The ETFs within the Model universe are compared to one another using a relative strength matrix. The top five sector funds are bought and are only sold when they fall sufficiently out of favor versus the other sectors on a relative strength basis. With the most recent action, the SPDR S&P Metals and Mining ETF XME deteriorated enough in strength relative to the rest of the potential Model holdings to warrant its removal from the Portfolio. In its place, the SPDR S&P Bank ETF KBE has been added as it is the highest ranked ETF not already held by the Model. XME was added to the Model on 8/19/16 and was up 5.21% while the Model itself was up 10.52% (through 5/9/17). The Model benchmark, the MSCI World ex US Index MSCIWORLDXUS, was up 8.54% during the same time frame. Looking at the chart of KBE, we find that is trading well above its bullish support line and has a strong fund score of 5.07, speaking to its strong relative strength and trending characteristics. KBE has given two consecutive buy signals, confirming that demand is in control. With the most recent action, the chart has exhaled slightly to $42.50, offering investors an attractive entry point with support coming at $41. The SSTREETGLOSECT Model has five positions equally weighted at 20% each.
The performance numbers above a price return is not inclusive of dividends or all transaction costs. Past performance is not indicative of future results. Potential for profits is accompanied by possibility of loss.

Like a radar screen, the Weekly Activity Summary gives you a snap shot view of any technical changes to the State Street universe of ETFs. Included in the summary below are both long term technical changes and intermediate term technical changes.
| Symbol | Name | Price | Score | 30 Day Rtn | 90 Day Rtn | YTD Rtn |
|---|---|---|---|---|---|---|
| IPS | SPDR S&P International Consumer Staples Sector | 45.016 | 4.0384 | 5.055 | 9.415 | 13.807 |
| Symbol | Name | Price | Score | 30 Day Rtn | 90 Day Rtn | YTD Rtn |
|---|---|---|---|---|---|---|
| XLE | Energy Select Sector SPDR Fund | 67.230 | 1.4352 | -4.449 | -6.521 | -10.741 |
| Symbol | Name | Price | Score | 30 Day Rtn | 90 Day Rtn | YTD Rtn |
|---|---|---|---|---|---|---|
| BIL | SPDR Bloomberg Barclays 1-3 Month T-Bill ETF | 45.710 | 0.9660 | 0.022 | -0.022 | 0.022 |
| CBND | SPDR Bloomberg Barclays Issuer Scored Corporate Bond ETF | 31.890 | 0.7335 | 0.283 | 0.030 | 1.052 |
| Symbol | Name | Price | Score | 30 Day Rtn | 90 Day Rtn | YTD Rtn |
|---|---|---|---|---|---|---|
| SMD | SPDR S&P 1000 ETF | 91.914 | 4.1289 | 2.355 | 2.377 | 3.566 |
| FLRN | SPDR Bloomberg Barclays Investment Grade Floating Rate ETF | 30.700 | 1.3322 | 0.000 | 0.163 | 0.261 |
| MDY | SPDR S&P MIDCAP 400 ETF Trust | 314.200 | 5.1023 | 1.329 | 1.927 | 4.133 |
| KIE | SPDR S&P Insurance ETF | 85.600 | 4.0974 | 0.328 | 1.458 | 3.195 |
| RWR | SPDR Dow Jones REIT ETF | 90.820 | 1.0894 | -2.543 | -2.355 | -2.710 |
| XLF | Financial Select Sector SPDR Fund | 23.730 | 5.1336 | 0.893 | 1.454 | 2.065 |
| SDY | SPDR S&P Dividend ETF | 88.050 | 2.6219 | 0.319 | 2.158 | 2.910 |
| SPYV | SPDR S&P 500 Value ETF | 112.380 | 2.6967 | 0.187 | 1.467 | 2.658 |
| SLYG | SPDR S&P 600 Small Cap Growth ETF | 214.010 | 4.3523 | 2.574 | 3.108 | 2.850 |
| XAR | SPDR S&P Aerospace & Defense ETF | 68.530 | 5.5237 | 2.116 | 4.355 | 8.143 |
| SJNK | SPDR Bloomberg Barclays Capital Short Term High Yield Bond ETF | 27.950 | 1.7824 | 0.359 | 0.179 | 0.975 |
| VLU | SPDR S&P 1500 Value Tilt ETF | 91.530 | 3.1364 | 0.621 | 2.510 | 3.833 |
| SRLN | SPDR Blackstone / GSO Senior Loan ETF | 47.410 | 1.5489 | -0.042 | 0.169 | -0.168 |
| TWOK | SPDR Russell 2000 ETF | 81.693 | 4.1787 | 1.976 | 2.285 | 2.604 |
| SYV | SPDR MFS Systematic Value Equity ETF | 58.673 | 2.9410 | -0.037 | 1.858 | 0.295 |
| Symbol | Name | Price | Score | 30 Day Rtn | 90 Day Rtn | YTD Rtn |
|---|---|---|---|---|---|---|
| IPS | SPDR S&P International Consumer Staples Sector | 45.016 | 4.0384 | 5.055 | 9.415 | 13.807 |
| Symbol | Name | Price | Score | 30 Day Rtn | 90 Day Rtn | YTD Rtn |
|---|---|---|---|---|---|---|
| XLE | Energy Select Sector SPDR Fund | 67.230 | 1.4352 | -4.449 | -6.521 | -10.741 |
| Symbol | Name | Price | Score | 30 Day Rtn | 90 Day Rtn | YTD Rtn |
|---|---|---|---|---|---|---|
| GAF | SPDR S&P Emerging Middle East & Africa ETF | 60.190 | 3.9545 | 2.819 | 4.970 | 8.255 |
| BIL | SPDR Bloomberg Barclays 1-3 Month T-Bill ETF | 45.710 | 0.9660 | 0.022 | -0.022 | 0.022 |
| IST | SPDR S&P International Telecommunications Sector | 24.481 | 1.2868 | 2.947 | 4.888 | 7.988 |
| XLF | Financial Select Sector SPDR Fund | 23.730 | 5.1336 | 0.893 | 1.454 | 2.065 |
| SDY | SPDR S&P Dividend ETF | 88.050 | 2.6219 | 0.319 | 2.158 | 2.910 |
| XBI | SPDR S&P Biotech ETF | 69.350 | 5.6055 | 3.015 | 5.251 | 17.165 |
| XHB | SPDR S&P Homebuilders ETF | 38.070 | 4.5587 | 3.592 | 10.540 | 12.467 |
| SPYV | SPDR S&P 500 Value ETF | 112.380 | 2.6967 | 0.187 | 1.467 | 2.658 |
| XTL | SPDR S&P Telecom ETF | 71.050 | 4.0427 | 1.660 | 0.415 | 2.472 |
| QEMM | SPDR MSCI Emerging Markets StrategicFactors ETF | 57.380 | 3.6622 | 2.795 | 6.694 | 14.429 |
| QJPN | SPDR MSCI Japan StrategicFactors ETF | 70.580 | 3.7521 | 2.555 | 4.259 | 8.020 |
| SYG | SPDR MFS Systematic Growth Equity ETF | 69.250 | 5.0120 | 1.689 | 4.544 | 9.495 |
| LOWC | SPDR MSCI ACWI Low Carbon Target ETF | 82.150 | 5.3710 | 2.853 | 6.358 | 9.885 |
| Symbol | Name | Price | Score | 30 Day Rtn | 90 Day Rtn | YTD Rtn |
|---|---|---|---|---|---|---|
| BWX | SPDR Bloomberg Barclays International Treasury Bond ETF | 26.670 | 0.9420 | 0.490 | 1.214 | 2.656 |
| HYMB | SPDR Nuveen S&P High Yield Municipal Bond ETF | 56.750 | 2.6677 | -0.106 | 0.638 | 1.394 |
| BNDS | SPDR Bloomberg Barclays Aggregate Bond ETF | 57.120 | 0.4599 | 0.070 | -0.244 | 0.351 |
| ITE | SPDR Bloomberg Barclays Intermediate Term Treasury ETF | 59.850 | 0.4679 | 0.033 | -0.200 | 0.318 |
| IPW | SPDR S&P International Energy Sector | 18.140 | 2.8439 | -1.359 | 0.666 | -2.995 |
| IPU | SPDR S&P International Utilities Sector | 16.550 | 1.6168 | 2.604 | 8.596 | 11.546 |
| LWC | SPDR Bloomberg Barclays Long Term Corporate Bond ETF | 40.190 | 2.5953 | 0.075 | -0.322 | 0.803 |
| RWR | SPDR Dow Jones REIT ETF | 90.820 | 1.0894 | -2.543 | -2.355 | -2.710 |
| XPH | SPDR S&P Pharmaceuticals ETF | 41.900 | 2.1701 | -1.874 | 3.841 | 7.189 |
| TLO | SPDR Bloomberg Barclays Long Term Treasury ETF | 69.700 | 0.8925 | -0.143 | -1.317 | 1.176 |
| TFI | SPDR Nuveen Bloomberg Barclays Municipal Bond ETF | 48.140 | 2.0190 | 0.146 | 0.690 | 1.476 |
| SHM | SPDR Nuveen Bloomberg Barclays Short Term Municipal Bond ETF | 48.550 | 2.3160 | 0.144 | 0.455 | 1.272 |
| RWO | SPDR DJ Wilshire Global Real Estate | 47.200 | 1.8351 | -0.819 | -0.296 | 0.726 |
| SST | SPDR Bloomberg Barclays Capital Short Term Treasury ETF | 30.100 | 0.6042 | 0.033 | -0.133 | 0.166 |
The distribution curve places each ETF on a bell curve according to their respective degrees of overbought or oversold status using a 10-week distribution. ETFs that are statistically oversold will appear on the left-hand side of the bell curve, while those that have become statistically overbought will appear on the right-hand side of the bell curve. Perhaps the most useful attribute of this feature is that it displays the entire universe on the curve at one time with an "average level" to give us a general picture of whether the State Street ETF universe is generally overbought on a near-term basis, or generally oversold. Our best opportunities are to buy strong market ETFs that have regressed back toward mean conditions based on market weakness, or have become oversold based upon extreme market weakness.
Weekly Distribution is a short-term gauge that is most helpful in timing entry and exit points, while the longer-term information of trend and relative strength is a more controlling factor in the decision of whether to buy or sell. The Distribution Curve below displays those ETFs with positive RS in uppercase letters and those ETFs with poor RS versus the market in lowercase letters. As well, those ETFs that are on a Point & Figure Buy signal appear in Green letters, while those on Sell signals can appear in Red letters.
The average Bullish Percent reading this week is 58.01% down 1.86% from the previous week
| -100--80 | -80--60 | -60--40 | -40--20 | -20-0 | 0-20 | 20-40 | 40-60 | 60-80 | 80-100 | 100-> | ||||
 | ||||||||||||||

The DWA Matrix uses a Point & Figure relative strength comparison of each index to one another to identify the strongest and the weakest among the universe used. The ETFs with the most relative strength buy signals (suggesting outperformance) versus the others in the group are listed at the top. These ETFs should be overweighted in the portfolio. Those ETFs with the least amount of relative strength buy signals versus the others in the group are listed at the bottom. These ETFs should be underweighted in the portfolio.
| Ticker | Name | Buys | Xs | Tech Attribute/ Score |
|---|---|---|---|---|
| MDYG | SPDR S&P 400 Mid Cap Growth ETF | 14 | 8 | 4.35 |
| MDY | SPDR S&P MIDCAP 400 ETF Trust | 13 | 14 | 5.10 |
| SPYG | SPDR S&P 500 Growth ETF | 13 | 12 | 3.46 |
| SLYG | SPDR S&P 600 Small Cap Growth ETF | 11 | 14 | 4.35 |
| MDYV | SPDR S&P 400 Mid Cap Value ETF | 10 | 12 | 4.98 |
| SLY | SPDR S&P 600 Small Cap ETF | 10 | 7 | 3.98 |
| ONEK | SPDR Russell 1000 ETF | 8 | 8 | 3.29 |
| SPY | SPDR S&P 500 ETF Trust | 8 | 7 | 3.23 |
| DIA | SPDR Dow Jones Industrial Average ETF Trust | 8 | 6 | 3.47 |
| THRK | SPDR Russell 3000 ETF | 8 | 6 | 3.32 |
| SDY | SPDR S&P Dividend ETF | 7 | 4 | 2.62 |
| SLYV | SPDR S&P 600 Small Cap Value ETF | 6 | 5 | 3.95 |
| SMD | SPDR S&P 1000 ETF | 5 | 8 | 4.13 |
| SPYV | SPDR S&P 500 Value ETF | 4 | 6 | 2.70 |
| CWI | SPDR MSCI ACWI ex-US ETF | 2 | 4 | 3.44 |
| DGT | SPDR DJ Global Titans ETF | 1 | 5 | 3.67 |
| GLD | SPDR Gold Trust | 0 | 10 | 2.47 |
Ticker
Name
Buys
Xs
Tech
Attribute/
Score
DIA
SPDR Dow Jones Industrial Average ETF Trust
22
14
3.47
RBL
SPDR S&P Russia ETF
22
3
4.13
SPY
SPDR S&P 500 ETF Trust
20
16
3.23
19
10
N/A
DGT
SPDR DJ Global Titans ETF
16
12
3.67
15
5
N/A
GUR
SPDR S&P Emerging Europe ETF
14
12
3.21
RWO
SPDR DJ Wilshire Global Real Estate
13
5
1.84
GMF
SPDR S&P Emerging Asia Pacific ETF
12
19
4.67
GWX
SPDR S&P International Small Cap ETF
12
10
3.13
GXC
SPDR S&P China ETF
11
14
4.68
GII
The SPDR FTSE/Macquarie Global Infrastructure 100
11
11
3.13
GWL
SPDR S&P World (ex-US) ETF
11
9
3.04
GML
SPDR S&P Emerging Latin America ETF
10
22
5.41
GMM
SPDR S&P Emerging Markets ETF
9
15
4.50
GAF
SPDR S&P Emerging Middle East & Africa ETF
9
14
3.95
9
8
N/A
EWX
SPDR S&P Emerging SmallCap
8
16
4.56
CWI
SPDR MSCI ACWI ex-US ETF
8
7
3.44
RWX
SPDR DJ Wilshire International Real Estate ETF
7
4
2.56
FEZ
SPDR EURO STOXX 50 ETF
6
18
4.55
BIK
SPDR S&P BRIC 40
4
16
3.74
FEU
SPDR STOXX Europe 50 ETF
2
9
4.17
DWX
SPDR S&P International Dividend
2
8
3.18
| Ticker | Name | Buys | Xs | Tech Attribute/ Score |
|---|---|---|---|---|
| KRE | SPDR S&P Regional Banking ETF | 39 | 12 | 5.11 |
| XSD | SPDR S&P Semiconductor ETF | 38 | 29 | 5.26 |
| MTK | SPDR Morgan Stanley Technology ETF | 37 | 41 | 5.81 |
| KBE | SPDR S&P Bank ETF | 35 | 14 | 5.07 |
| KIE | SPDR S&P Insurance ETF | 33 | 26 | 4.10 |
| XAR | SPDR S&P Aerospace & Defense ETF | 33 | 26 | 5.52 |
| XBI | SPDR S&P Biotech ETF | 31 | 30 | 5.61 |
| XTN | SPDR S&P Transportation ETF | 31 | 10 | 3.84 |
| XHE | SPDR S&P Health Care Equipment ETF | 30 | 36 | 5.88 |
| XLY | Consumer Discretionary Select Sector SPDR Fund | 30 | 24 | 4.17 |
| XLF | Financial Select Sector SPDR Fund | 30 | 15 | 5.13 |
| XSW | SPDR S&P Software & Services ETF | 29 | 29 | 5.50 |
| XLI | Industrial Select Sector SPDR Fund | 29 | 23 | 3.66 |
| XTL | SPDR S&P Telecom ETF | 29 | 15 | 4.04 |
| XLK | Technology Select Sector SPDR Fund | 28 | 34 | 4.57 |
| XME | SPDR S&P Metals & Mining ETF | 27 | 3 | 3.86 |
| IPK | SPDR S&P International Technology Sector | 25 | 39 | 5.85 |
| 23 | 17 | N/A | ||
| XLB | Materials Select Sector SPDR Fund | 21 | 20 | 3.97 |
| XHB | SPDR S&P Homebuilders ETF | 20 | 27 | 4.56 |
| IPN | SPDR S&P International Industrials Sector | 19 | 30 | 3.68 |
| KCE | SPDR S&P Capital Markets ETF | 19 | 15 | 4.26 |
| XLV | Health Care Select Sector SPDR Fund | 18 | 25 | 3.96 |
| IRV | SPDR S&P International Materials Sector | 18 | 22 | 4.03 |
| IPW | SPDR S&P International Energy Sector | 18 | 9 | 2.84 |
| XLE | Energy Select Sector SPDR Fund | 16 | 2 | 1.44 |
| IPD | SPDR S&P International Consumer Discretionary Sector | 15 | 27 | 3.47 |
| XLU | Utilities Select Sector SPDR Fund | 14 | 20 | 2.62 |
| IPF | SPDR S&P International Financial Sector | 13 | 31 | 4.53 |
| XLP | Consumer Staples Select Sector SPDR Fund | 13 | 21 | 2.80 |
| XHS | SPDR S&P Health Care Services ETF | 12 | 35 | 4.99 |
| IPS | SPDR S&P International Consumer Staples Sector | 11 | 24 | 4.04 |
| XRT | SPDR S&P Retail ETF | 11 | 6 | 2.03 |
| XOP | SPDR S&P Oil & Gas Exploration & Production ETF | 11 | 2 | 1.51 |
| RWR | SPDR Dow Jones REIT ETF | 9 | 12 | 1.09 |
| RWO | SPDR DJ Wilshire Global Real Estate | 9 | 12 | 1.84 |
| XPH | SPDR S&P Pharmaceuticals ETF | 8 | 23 | 2.17 |
| XES | SPDR S&P Oil & Gas Equipment & Services ETF | 8 | 0 | 0.18 |
| IRY | SPDR S&P International Health Care Sector | 6 | 25 | 3.51 |
| GLD | SPDR Gold Trust | 5 | 20 | 2.47 |
| IST | SPDR S&P International Telecommunications Sector | 4 | 15 | 1.29 |
| IPU | SPDR S&P International Utilities Sector | 1 | 21 | 1.62 |
| Ticker | Name | Buys | Xs | Tech Attribute/ Score |
|---|---|---|---|---|
| CWB | SPDR Bloomberg Barclays Convertible Bond ETF | 21 | 17 | 3.51 |
| JNK | SPDR Bloomberg Barclays High Yield Bond ETF | 18 | 13 | 2.94 |
| EBND | SPDR Bloomberg Barclays Emerging Markets Local Bond ETF | 16 | 19 | 3.12 |
| 15 | 7 | N/A | ||
| TFI | SPDR Nuveen Bloomberg Barclays Municipal Bond ETF | 15 | 1 | 2.02 |
| BWX | SPDR Bloomberg Barclays International Treasury Bond ETF | 14 | 15 | 0.94 |
| IPE | SPDR Bloomberg Barclays TIPS ETF | 13 | 10 | 0.33 |
| ITR | SPDR Bloomberg Barclays Intermediate Term Credit Bond ETF | 13 | 8 | 1.99 |
| PSK | SPDR Wells Fargo Preferred Stock ETF | 11 | 19 | 2.62 |
| LWC | SPDR Bloomberg Barclays Long Term Corporate Bond ETF | 11 | 14 | 2.60 |
| WIP | SPDR Citi International Government Inflation-Protected Bond ETF | 10 | 19 | 1.85 |
| TLO | SPDR Bloomberg Barclays Long Term Treasury ETF | 9 | 15 | 0.89 |
| SCPB | SPDR Bloomberg Barclays Short Term Corporate Bond ETF | 9 | 6 | 2.08 |
| ITE | SPDR Bloomberg Barclays Intermediate Term Treasury ETF | 9 | 2 | 0.47 |
| SRLN | SPDR Blackstone / GSO Senior Loan ETF | 8 | 11 | 1.55 |
| FLRN | SPDR Bloomberg Barclays Investment Grade Floating Rate ETF | 8 | 8 | 1.33 |
| BIL | SPDR Bloomberg Barclays 1-3 Month T-Bill ETF | 8 | 5 | 0.97 |
| SHM | SPDR Nuveen Bloomberg Barclays Short Term Municipal Bond ETF | 8 | 5 | 2.32 |
| BNDS | SPDR Bloomberg Barclays Aggregate Bond ETF | 7 | 4 | 0.46 |
| MBG | SPDR Bloomberg Barclays Mortgage Backed Bond ETF | 5 | 1 | 1.25 |
| IBND | SPDR Bloomberg Barclays International Corporate Bond ETF | 4 | 17 | 2.59 |
| BWZ | SPDR Bloomberg Barclays Short Term International Treasury Bond ETF | 3 | 17 | 0.82 |
The State Street ETF Model Portfolios are designed to identify major leadership themes within a market, doing so through the use of Point and Figure relative strength tools. Each of the State Street Models are evaluated weekly and guided by a rules-based investment methodology. The construction of the State Street Sector ETF Portfolio is done through an analysis of the each State Street Sector ETF relative strength chart versus the S&P 500, while the Global Sector Rotation model employs a relative strength matrix ranking of the model's inventory. In either case, those with strong relative strength make the cut and are eligible to be included in the portfolio, while those that aren't, will sit upon the sideline. For more information on the portfolio construction and back testing please see the information files on the Models Page. To enter a portfolio amount and see shares to be purchased as well as modify the portfolio to your specifications, click here. (Note: All State Street ETF Models are updated Wednesday mornings by 9:30 am EST)
| ETF Name | Symbol | DWA Suggested Weighting | Date Added |
|---|---|---|---|
| SPDR Morgan Stanley Technology ETF | MTK | 5.882% | 03/11/2009 |
| SPDR S&P Bank ETF | KBE | 5.882% | 11/15/2016 |
| SPDR S&P Insurance ETF | KIE | 5.882% | 03/19/2013 |
| SPDR S&P Regional Banking ETF | KRE | 5.882% | 11/15/2016 |
| Financial Select Sector SPDR Fund | XLF | 5.882% | 11/15/2016 |
| Industrial Select Sector SPDR Fund | XLI | 5.882% | 05/04/2010 |
| Technology Select Sector SPDR Fund | XLK | 5.882% | 02/25/2009 |
| Utilities Select Sector SPDR Fund | XLU | 5.882% | 02/09/2016 |
| Health Care Select Sector SPDR Fund | XLV | 5.882% | 01/28/2014 |
| Consumer Discretionary Select Sector SPDR Fund | XLY | 5.882% | 02/24/2010 |
| SPDR S&P Semiconductor ETF | XSD | 5.882% | 02/25/2014 |
| SPDR S&P Biotech ETF | XBI | 5.882% | 11/15/2016 |
| SPDR S&P Transportation ETF | XTN | 5.882% | 11/15/2016 |
| SPDR S&P Telecom ETF | XTL | 5.882% | 11/22/2016 |
| SPDR S&P Health Care Equipment ETF | XHE | 5.882% | 09/20/2016 |
| SPDR S&P Aerospace & Defense ETF | XAR | 5.882% | 10/25/2011 |
| SPDR S&P Software & Services ETF | XSW | 5.882% | 10/25/2011 |
* - Model Inception:1/17/2007
* - Model Inception:10/15/2008
* - Model Inception:10/28/2008
State Street Global Sector Rotation Model SSTREETGLOSECT
ETF Name
Symbol
DWA Suggested Weighting
Date Added
SPDR Morgan Stanley Technology ETF
MTK
20.000%
10/25/2016
SPDR S&P Bank ETF
KBE
20.000%
05/09/2017
SPDR S&P Regional Banking ETF
KRE
20.000%
02/28/2017
SPDR S&P Semiconductor ETF
XSD
20.000%
11/10/2015
SPDR S&P Aerospace & Defense ETF
XAR
20.000%
07/15/2014
* - Model Inception: 07/28/2010
State Street Fixed Income Model SSFIXED
ETF Name
Symbol
DWA Suggested Weighting
Date Added
SPDR Bloomberg Barclays Convertible Bond ETF
CWB
25.000%
08/23/2016
SPDR Bloomberg Barclays High Yield Bond ETF
JNK
25.000%
11/01/2016
SPDR Bloomberg Barclays Intermediate Term Credit Bond ETF
ITR
25.000%
11/15/2016
SPDR Wells Fargo Preferred Stock ETF
PSK
25.000%
01/19/2016
* - Model Inception: 04/27/2011
State Street (Wed.)
Loading, Please Wait...
