
Today we have a change in the SSTREETGLOSECT Model: Sell XME, Buy KBE. We also have a change in the SSTREET Model: Sell XME
Today we have a change in the SSTREETGLOSECT Model: Sell XME, Buy KBE. We also have a change in the SSTREET Model: Sell XME.
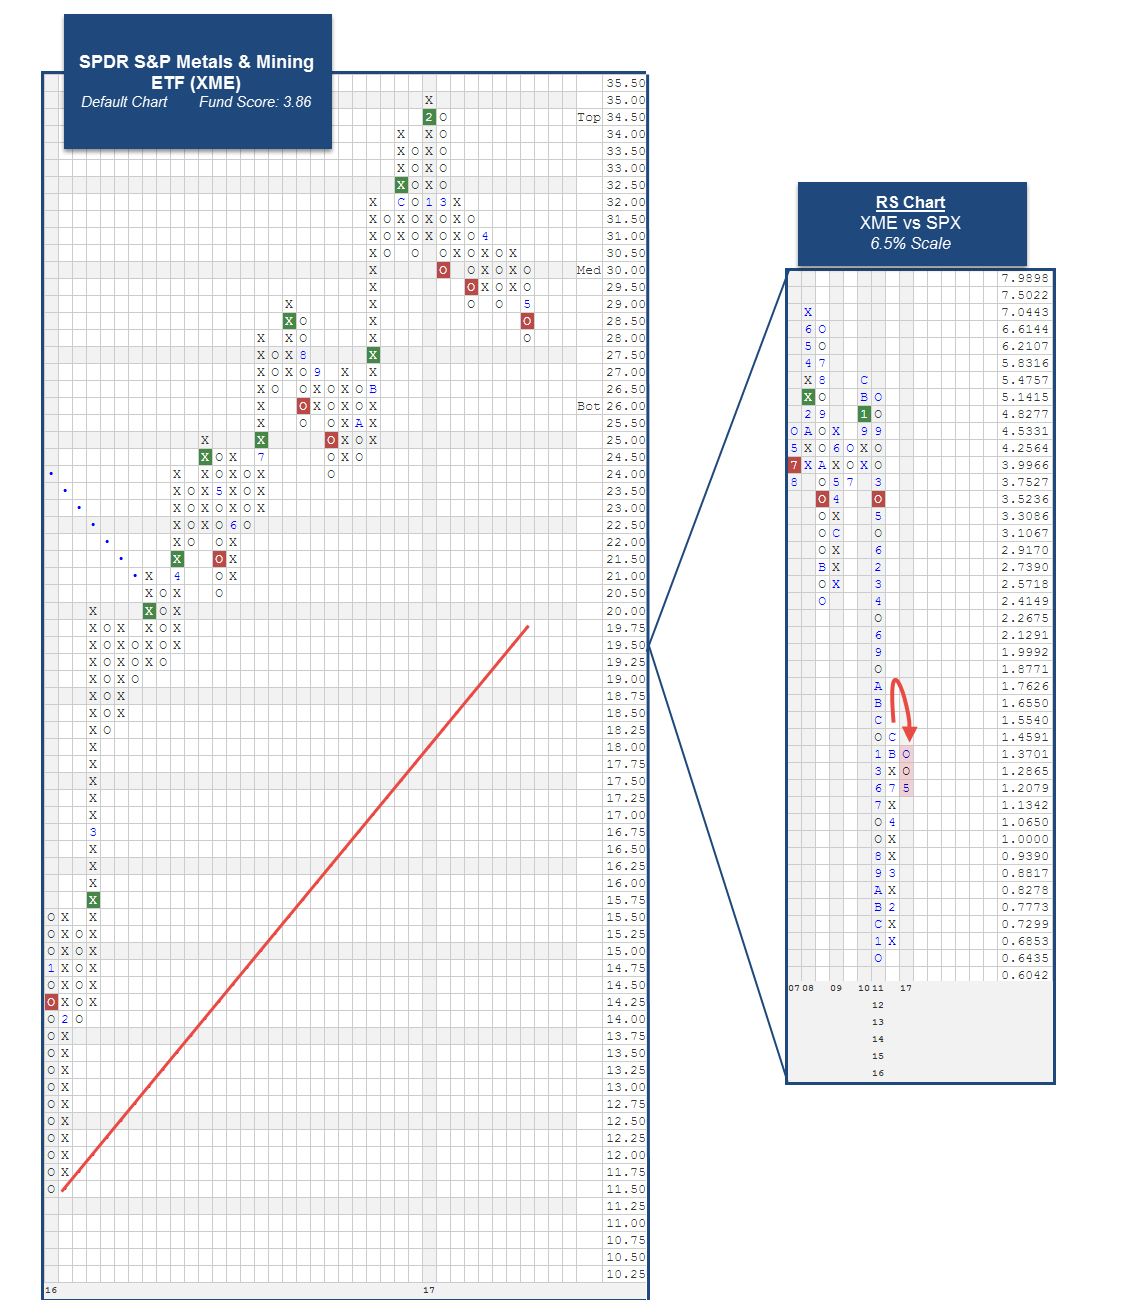
The first change this week comes from the State Street Sector Model SSTREET. The SPDR S&P Metals and Mining ETF XME has been removed from the Model after reversing down into O's versus the SPX on its RS chart.. This Model is designed to target exposure to the State Street sector ETFs that are demonstrating positive Relative Strength versus the S&P 500 Index SPX. Each week we monitor 31 Relative Strength charts for each ETF in the Model's universe versus the SPX. XME had been a holding in the SSTREET Model since 2/9/2016. Since being added, XME posted an impressive gain of 99.23% while the SPX was up 29.41% (through 5/9/2017). The SSTREET Model was up 32.62% over the same time frame. Looking at the trend chart of XME below, we find that after hitting a new 52 week high in February at $35, the chart pulled back significantly and gave three consecutive sell signals, with the most recent being a triple bottom break at $28.50. Additionally, it has seen considerable deterioration in its fund score which is now 3.86, with a score direction of -2.12. As a result of this change, the SSTREET Model has 17 holdings equally weighted at 5.88% each.
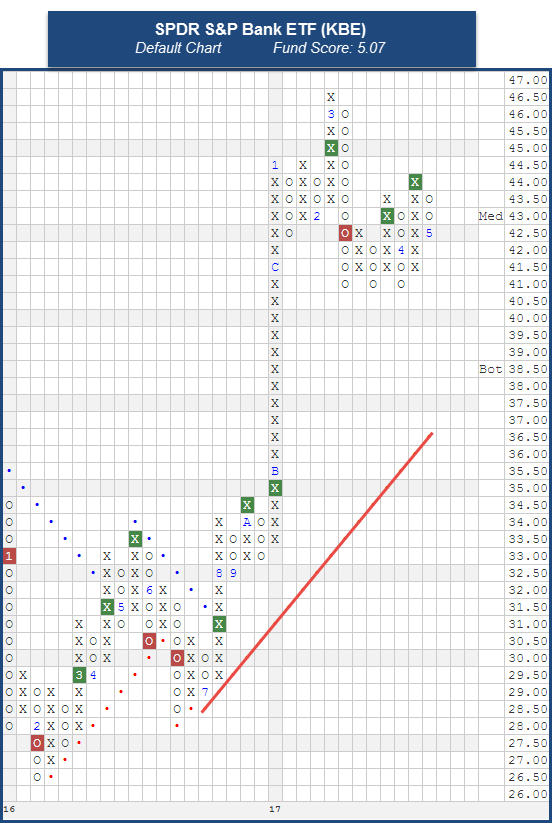
The second change this week comes from the State Street Global Sector Rotation Model SSTREETGLOSECT. As a refresher, the SSTREETGLOSECT Model is made up of five holdings, each of which is selected from a universe of both domestic and international sector funds. The ETFs within the Model universe are compared to one another using a relative strength matrix. The top five sector funds are bought and are only sold when they fall sufficiently out of favor versus the other sectors on a relative strength basis. With the most recent action, the SPDR S&P Metals and Mining ETF XME deteriorated enough in strength relative to the rest of the potential Model holdings to warrant its removal from the Portfolio. In its place, the SPDR S&P Bank ETF KBE has been added as it is the highest ranked ETF not already held by the Model. XME was added to the Model on 8/19/16 and was up 5.21% while the Model itself was up 10.52% (through 5/9/17). The Model benchmark, the MSCI World ex US Index MSCIWORLDXUS, was up 8.54% during the same time frame. Looking at the chart of KBE, we find that is trading well above its bullish support line and has a strong fund score of 5.07, speaking to its strong relative strength and trending characteristics. KBE has given two consecutive buy signals, confirming that demand is in control. With the most recent action, the chart has exhaled slightly to $42.50, offering investors an attractive entry point with support coming at $41. The SSTREETGLOSECT Model has five positions equally weighted at 20% each.
The performance numbers above a price return is not inclusive of dividends or all transaction costs. Past performance is not indicative of future results. Potential for profits is accompanied by possibility of loss.
